 Open Access Article
Creative Commons Attribution 3.0 Unported Licence
Catalytic decomposition of N2O over Rh/Zn–Al2O3 catalysts†
Chengyun Huanga,
Zhen Ma *b,
Changxi Miao*c,
Yinghong Yuea,
Weiming Hua
 *a and
Zi Gaoa
aShanghai Key Laboratory of Molecular Catalysis and Innovative Materials, Department of Chemistry, Fudan University, Shanghai 200433, P. R. China. E-mail: wmhua@fudan.edu.cn
bShanghai Key Laboratory of Atmospheric Particle Pollution and Prevention (LAP3), Department of Environmental Science and Engineering, Fudan University, Shanghai 200433, PR China. E-mail: zhenma@fudan.edu.cn
cShanghai Research Institute of Petrochemical Technology SINOPEC, Shanghai 201208, P. R. China. E-mail: miaocx.sshy@sinopec.com
First published on 16th January 2017
Abstract
Zn–Al2O3 supports were prepared by impregnating commercial γ-Al2O3 powders with different amounts of Zn(NO3)2, followed by calcination in air at 500 or 800 °C. Rh/Zn–Al2O3 catalysts were then prepared by impregnating Zn–Al2O3 supports with Rh(NO3)3 followed by calcination in air at 500 °C. The catalysts and/or supports were characterized by ICP-OES, XRD, N2 adsorption, Raman spectroscopy, TEM-EDX, XPS, CO2-TPD, H2-TPR, and O2-TPD, and the catalytic performance of supported Rh catalysts in N2O decomposition was tested. It is concluded that the support can be described as ZnO/Al2O3 (ZnO supported on Al2O3) when calcining Zn(NO3)2/Al2O3 at 500 °C, whereas ZnAl2O4 spinel forms on the Al2O3 surface at 800 °C. Rh/Zn–Al2O3 catalysts are much more active than Rh/Al2O3 and Rh/ZnO. The best catalyst (Rh/Zn–Al2O3-800 with 1 wt% Rh and 1 wt% Zn) has the smallest Rh2O3 particle size and can desorb O2 at lower temperature than other catalysts. Both factors may be important for achieving high activity in N2O decomposition.
Introduction
The negative environmental impact of N2O on global warming and ozone layer depletion has raised much concern. The concentration of N2O in the atmosphere has been increasing at an annual rate of 0.2–0.3% since the industrial revolution.1 Anthropogenic N2O emission comes from several chemical processes (e.g., nitric acid and adipic acid production) and fossil fuel/biomass burning. N2O can be decomposed into N2 and O2 over supported noble metal catalysts, bare or supported metal oxides, or zeolite-based catalysts.2–5 Rh-Based catalysts often exhibit high activity at relatively low reaction temperatures. Rh species can exist in the form of metallic Rh or Rh2O3, depending on whether the catalysts are reduced or not. Typical supports for loading Rh species include bare metal oxides,6–14 mixed/composite metal oxides,15–21 zeolites,22–24 and metal phosphates/hydroxyapatite.25–27Al2O3 is both a support and a catalyst widely used in industry. Rh/Al2O3 shows moderate catalytic activity in N2O decomposition.8,10,11,25 Attempts have been made to improve Al2O3-based Rh catalysts for N2O decomposition. For example, Haber et al. reported that the presence of alkali metal additives on Rh/Al2O3 can lead to more active catalysts due to the improved dispersion of Rh species.28 Parres-Esclapez et al. found that Sr can promote the activity of Rh/Al2O3 due to the improved dispersion and reducibility of Rh species.29 Zhao et al. reported that Rh/SiO2–Al2O3 shows high activity, because oxygen desorption property is improved and Rh0 species is stabilized.30 Kim and co-workers reported that Rh/Ce–Al2O3 is more active than Rh/Al2O3, due to increased surface area and improved reducibility of Rh species.31
It has been reported that spinel phase has a strong interaction with noble metals, resulting in smaller size and better stability of supported noble metal particles,32,33 which is beneficial for N2O decomposition.22,25,28 High temperature calcination of Al2O3-supported metal nitrates is a convenient method to form spinel phase.34–36 However, to the best of our knowledge, there has been no work dealing with N2O decomposition over Rh/M–Al2O3 catalysts with spinel phase.
Herein, we prepared Zn–Al2O3 supports by impregnating Zn(NO3)2 on commercial γ-Al2O3 powders followed by calcination. Rh/Zn–Al2O3 catalysts were synthesized by impregnating Rh(NO3)3 onto Zn–Al2O3 supports. The catalyst prepared under optimal conditions was found to be much more active than Rh/Al2O3 and Rh/ZnO in N2O decomposition. The catalysts were characterized in detail, and reasons for the high activity of Rh/Zn–Al2O3 were elucidated.
Experimental section
Preparation
A calculated amount of Zn(NO3)2·6H2O was dissolved in 20 mL deionized water in an agate mortar. Then, 1.98 g γ-Al2O3 powder (specific surface area = 110 m2 g−1) was added and the slurry was mixed sufficiently using an agate pestle, followed by drying under an infrared lamp. The Zn(NO3)2/Al2O3 precursors were calcined in a muffle furnace at a certain temperature (500, 600, 700, 800, or 900 °C) for 4 h under flowing air. The obtained supports are referred to as x% Zn–Al2O3-y, where x% represents the wt% Zn in the catalysts and y the calcination temperature in °C. Zn–Al2O3-y in the text usually has 1 wt% Zn, unless otherwise specified.For comparison, commercial γ-Al2O3 was also calcined at 800 °C for 4 h under flowing air. ZnO was prepared by precipitation. 50 mL ammonia solution (2.8 mol L−1) was added dropwise to 100 mL Zn(NO3)2 solution (0.6 mol L−1) under stirring. The precipitates were isolated by filtration, thoroughly washed by deionized water till pH value of filter liquor reached 7, dried at 100 °C overnight, and calcined at 800 °C for 4 h under flowing air. These two samples are referred to as Al2O3-800 and ZnO-800, respectively. An additional ZnO sample was prepared by calcining Zn(NO3)2·6H2O at 800 °C for 4 h under flowing air.
Rhodium was loaded onto supports by impregnation. 1.98 g support was mixed with 10 mL Rh(NO3)3 solution (2 mg mL−1) in an agate mortar and dried under a infrared lamp (theoretical Rh content is 1 wt%). The obtained powders were calcined at 500 °C for 4 h.
Characterization
XRD patterns were recorded on a MSAL XD2 X-ray diffractometer using CuKα radiation at a scanning speed of 4° min−1, with voltage of 40 kV and current of 30 mA. BET surface areas were measured on a Micromeritics Tristar 3000 instrument. The samples were treated at 300 °C in vacuum for 3 h, followed by N2 adsorption at −196 °C. ICP-OES was measured on a PerkinElmer OPTIMA 2100 DV optical emission spectrometer. 0.1 g sample was dissolved in a mixture of 3 mL HNO3, 9 mL HCl, 1 mL HClO4, 0.5 mL H2O2, and 3 mL HF reagents, followed by heating at 150 °C for 2–3 h. After that, the sample was mixed with 1 mL HNO3, 3 mL HCl, 0.5 mL HClO4, and 1 mL HF again, and the mixture was transferred to Teflon autoclave, heated at 180 °C for 4 h, cooled to the ambient temperature, and then diluted with distilled water for analysis.Raman spectra were recorded on a HORIBA Jobin Yvon XploRA spectrometer. In order to avoid fluorescence of ZnO, wavelength of exciting light was selected as 532 nm. TEM data were obtained by an FEI Tecnai G2 F20 S-TWIN with an EDX instrument. All samples were measured under an accelerating voltage of 200 kV. XPS spectra were recorded on a Shimadzu/Kratos AXIS Ultra DLD spectrometer with AlKα radiation as the excitation source. The C1s line (284.6 eV) was used as the reference to calibrate the binding energy.
Rh dispersion was determined by CO chemisorption on a Micromeritics AutoChem II instrument, based on 1![[thin space (1/6-em)]](https://www.rsc.org/images/entities/char_2009.gif) :
:![[thin space (1/6-em)]](https://www.rsc.org/images/entities/char_2009.gif) 1 stoichiometry (CO/Rh). 0.15 g Rh catalyst (40–60 mesh) was pretreated in He flow at 400 °C for 1 h, and cooled to 30 °C. Then, a pulse of 5% CO–He mixture was repeatedly injected into the reactor via a six-way valve until the CO signals from the thermal conductivity detector remained constant. He was used as the carrier gas. The volume of CO chemisorbed was determined by summing the fractions of CO consumed in each pulse.
1 stoichiometry (CO/Rh). 0.15 g Rh catalyst (40–60 mesh) was pretreated in He flow at 400 °C for 1 h, and cooled to 30 °C. Then, a pulse of 5% CO–He mixture was repeatedly injected into the reactor via a six-way valve until the CO signals from the thermal conductivity detector remained constant. He was used as the carrier gas. The volume of CO chemisorbed was determined by summing the fractions of CO consumed in each pulse.
CO2-TPD experiments were conducted on a Micromeritics AutoChem II instrument. 0.2 g sample (40–60 mesh) was pretreated in He flow at 500 °C for 1 h, and cooled to 80 °C. The flow was switched to 5% CO2/He (30 mL min−1) and kept for 1 h, and then swept by He (30 mL min−1) for 1.5 h. Finally, the sample was heated in He (30 mL min−1) to 600 °C at a rate of 10 °C min−1.
H2-TPR experiments were conducted on a FINESORB-3010 instrument, equipped with a mass spectrometer (OmniStar™). 0.15 g catalyst (40–60 mesh) was pretreated in He flow at 400 °C for 1 h, cooled down to room temperature, and further cooled in an ice-water bath. Then, the catalyst was exposed in 4% H2–He mixture (30 mL min−1) at 0 °C for 1 h, and heated by a furnace to 600 °C at a rate of 10 °C min−1. The profile was recorded through the channel of m/z = 2.
O2-TPD experiments were conducted on a FINESORB-3010 instrument. 0.2 g catalyst (40–60 mesh) was pretreated in He flow at 500 °C for 1 h, and cooled to 50 °C. The catalyst was exposed to O2 (10 mL min−1) at 50 °C for 1 h, swept by He (30 mL min−1) for 3 h, and heated in He (30 mL min−1) to 580 °C at a rate of 10 °C min−1.
Catalytic tests
Catalytic activity of N2O decomposition was tested in a fixed-bed flow microreactor. 0.5 g catalyst (40–60 mesh) was packed in a U-shaped glass tube (7 mm inner diameter) sealed by quartz wool. A gas stream of 0.5% N2O (balanced by He) flowed through the catalyst at a rate of 60 mL min−1. The catalyst (first kept at near room temperature) was exposed to the gas stream for 1 h during which the existing stream was periodically analyzed by a gas chromatograph (GC, Agilent 7890A) equipped with columns (Sepuco 6ftQ and Sepuco Q&5A, column temperature: 80 °C) that can separate N2O, O2, and N2. The reaction temperature was then raised using a furnace and kept at various elevated temperature for 0.5 h in each temperature step. The exhaust was again periodically analyzed by the GC, and the conversion of N2O was calculated according to X = ([N2O]in − [N2O]out)/[N2O]in, where [N2O]in refers to the N2O concentration or peak area at room temperature, and [N2O]out refers to the N2O concentration or peak area at an elevated temperature.Results and discussion
Structural and physical properties
Rh/Zn–Al2O3-500 and Rh/Zn–Al2O3-800 catalysts were prepared by using different supports prepared by calcining Zn(NO3)2/Al2O3 in air at 500 or 800 °C. The Zn and Rh contents are both fixed to be 1 wt%. In addition, Rh/Al2O3-800 and Rh/ZnO-800 were also prepared for comparison. The Rh contents of these four catalysts are determined by ICP-OES as 1.1 wt%, 1.1 wt%, 1.0 wt%, and 1.0 wt%, respectively. The Zn contents of Rh/Zn–Al2O3-500 and Rh/Zn–Al2O3-800 are determined as 1.1 wt% and 1.1 wt%, respectively, in accordance with the theoretical value.Fig. 1 shows the XRD patterns of supported Rh catalysts. Rh/Zn–Al2O3-500, Rh/Zn–Al2O3-800, and Rh/Al2O3-800 exhibit identical diffraction peaks at ca. 33, 37, 40, 46, 60, and 67°, in accordance with the diffraction peaks of γ-Al2O3 (PDF#47-1308). In addition, no Rh or Rh2O3 can be detected, due to the low Rh content (ca. 1 wt%) and high dispersion, as demonstrated by TEM and Rh dispersion data later. Rh/ZnO-800 shows very sharp peaks corresponding to ZnO, implying that the ZnO support is highly crystalline and has a low surface area. Again, no Rh or Rh2O3 can be seen on the XRD pattern of Rh/ZnO-800. Fig. S1 in the ESI† depicts the XRD patterns in the 2θ = 30–40° region, highlighting that there is no difference among the XRD patterns of Rh/Zn–Al2O3-500, Rh/Zn–Al2O3-800, and Rh/Al2O3-800. No ZnO or ZnAl2O4 peaks can be observed for Rh/Zn–Al2O3-500 and Rh/Zn–Al2O3-800, due to the low loading of Zn (ca. 1 wt%).
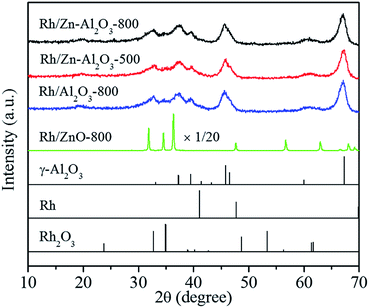 | ||
| Fig. 1 XRD patterns of the catalysts and standard patterns of γ-Al2O3 (PDF#47-1308), Rh (PDF#05-0685), and Rh2O3 (PDF#41-0541). | ||
According to the literature,34,35 surface spinel (ZnAl2O4) may be formed when calcining ZnO/Al2O3 at 800 °C. The fact that no ZnAl2O4 peaks are observed for Rh/Zn–Al2O3-800 may be because the Zn loading is so low (ca. 1 wt%). To prove this explanation, we additionally prepared Zn–Al2O3 supports with nominal Zn contents of 0.5 wt%, 5 wt%, 10 wt%, and 20 wt%, respectively. These supports were all calcined at 800 °C. All catalysts were accurately scanned in the 2θ = 30–40° range, where the XRD peaks of γ-Al2O3, ZnAl2O4, and ZnO can be distinguished clearly.
As shown in Fig. 2, the diffraction peaks are significantly enhanced with the increase of Zn content, and gradually shift toward 31.2 and 36.8° which represent (220) and (311) planes of ZnAl2O4, respectively. When the Zn content is or exceeds 10 wt%, the ZnAl2O4 peaks become clearer. When the Zn content is 20 wt%, the appearance of peaks at 31.8, 34.4, and 36.3° representing (100), (002) and (101) planes of ZnO respectively proves the formation of ZnO. The data infer that surface ZnAl2O4 may likely form on Zn–Al2O3-800 with a Zn content of 1 wt%, only that the ZnAl2O4 content is very low so the ZnAl2O4 phase can not be detected by XRD.
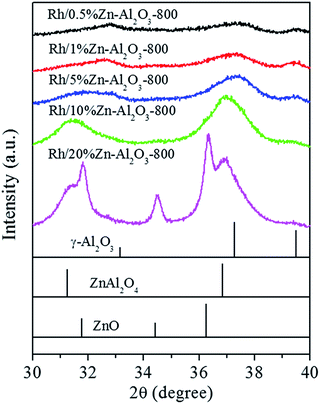 | ||
| Fig. 2 XRD patterns of Rh/Zn–Al2O3-800 catalysts with different Zn loading and standard patterns of γ-Al2O3 (PDF#47-1308), ZnAl2O4 (PDF#05-0699), and ZnO (PDF#36-1451). | ||
Fig. 3 presents the Raman spectra of several samples without Rh. ZnAl2O4 (synthesized via citric acid combustion method,37 pure phase proved by XRD) exhibits two Raman peaks at 418 and 659 cm−1, representing Eg and T2g vibration modes of spinel structure, respectively.38 For Zn–Al2O3-800, the peak at 418 cm−1 is obvious, indicating the formation of ZnAl2O4. However, the T2g peak at 659 cm−1 is missing, in accordance with a previous report.36 A possible explanation is that tetrahedron defects are induced into spinel structure by impregnating divalent metal cations onto γ-Al2O3 (a spinel-like structure with stoichiometric ratio of tetrahedron defects).36 For comparison, Zn–Al2O3-500 does not exhibit peaks at 418 or 659 cm−1. Instead, a board and weak peak at 440 cm−1 is observed, close to E2 vibration mode of ZnO at 437 cm−1.39 Therefore, high temperature (800 °C) is necessary for the formation of surface ZnAl2O4.
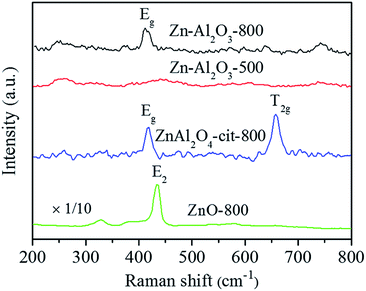 | ||
| Fig. 3 Raman spectra for Zn–Al2O3-800, Zn–Al2O3-500, and ZnAl2O4-cit-800 (synthesized via citric acid route, pure ZnAl2O4 phase) and ZnO-800 for comparison. | ||
Fig. S2† shows the Raman spectra of Zn–Al2O3-800 with different Zn content. The peaks at 418 and 659 cm−1 representing Eg and T2g vibration of ZnAl2O4 lattice become stronger as the Zn content in the sample increases from 1 wt% to 5 wt% and then to 10 wt%. The relative intensity of T2g vibration to that of Eg vibration also increases with the Zn content, probably because higher crystallinity of ZnAl2O4 restrains the formation of tetrahedron defects. However, when the Zn content of sample is 20 wt%, a new peak at 438 cm−1 representing E2 vibration of ZnO lattice appears, indicating the formation of ZnO, as also revealed by XRD (Fig. 2).
Fig. 4 shows the TEM graphs of supported Rh catalysts. The size and morphology of Zn–Al2O3 supports (Fig. 4a and b) are identical to those of Al2O3 (Fig. 4c). This conclusion is in line with the XRD patterns (Fig. 1) and specific surface area data (Table 1). The surface area of Al2O3-800 is 110 m2 g−1, and those of Zn–Al2O3-500 and Zn–Al2O3-800 are 108 and 105 m2 g−1, respectively. For comparison, ZnO-800 exhibits as much bigger spherical particles, in accordance with its low surface area (4 m2 g−1, Table 1). Rh2O3 particles are dispersed on these supports. The homogeneous distribution of Rh and Zn on Rh/Zn–Al2O3-800 is shown by EDX-mapping (Fig. S3†).
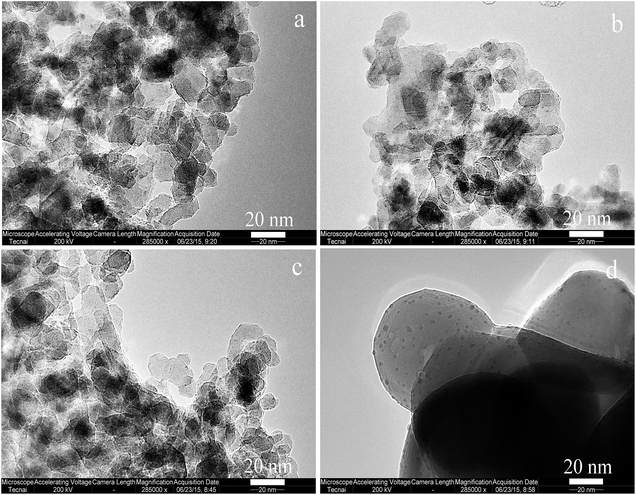 | ||
| Fig. 4 TEM graphs of (a) Rh/Zn–Al2O3-800, (b) Rh/Zn–Al2O3-500, (c) Rh/Al2O3-800, and (d) Rh/ZnO-800. | ||
| Sample | BET surface areaa (m2 g−1) | Average size of Rh2O3 particlesb (nm) | Rh dispersion (%) | Amount of basic sitesa (μmol g−1) | Starting desorption temperature of O2 (°C) | Amount of desorbed O2 (a.u.) |
|---|---|---|---|---|---|---|
| a Bare supports (without Rh).b Obtained by analyzing 300 Rh2O3 particles in TEM graphs. | ||||||
| Rh/Zn–Al2O3-800 | 105 | 0.70 ± 0.20 | 71 | 14.6 | 234 | 496 |
| Rh/Zn–Al2O3-500 | 108 | 0.78 ± 0.19 | 65 | 13.5 | 293 | 324 |
| Rh/Al2O3-800 | 110 | 0.87 ± 0.25 | 59 | 14.3 | 313 | 286 |
| Rh/ZnO-800 | 4 | 2.15 ± 0.90 | 7 | 4.4 | — | 0 |
Fig. S4† shows the TEM graphs with larger size. The graphs show that Rh2O3 are well dispersed on the supports. The size distributions of Rh2O3 particles were determined by analyzing 300 particles from over 5 TEM graphs for each sample. As shown in Fig. S5,† most Rh2O3 particles are in the range of 0.5 and 1.0 nm over Al2O3-based catalysts. However, due to the low surface area of ZnO support (4 m2 g−1), Rh2O3 particles on ZnO are relatively big. The average sizes of Rh2O3 particles on Zn–Al2O3-800, Zn–Al2O3-500, Al2O3-800, and ZnO-800 are 0.70, 0.78, 0.87, and 2.15 nm, respectively. Rh dispersions of Rh/Zn–Al2O3-800, Rh/Zn–Al2O3-500, Rh/Al2O3-800, and Rh/ZnO-800 are 71%, 65%, 59%, and 7%, respectively, in line with the trend of Rh2O3 particle size seen by TEM. The key observation here is that the addition of ZnO onto commercial Al2O3 can stabilize Rh2O3 particles, and the calcination of ZnO/Al2O3 at 800 °C can exert such an effect more obviously.
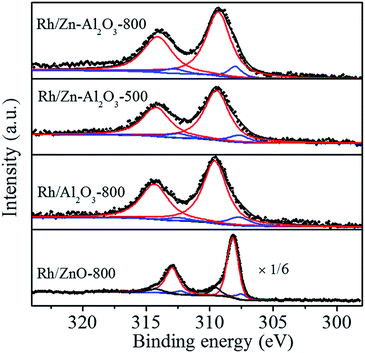
Fig. 5 shows the Rh 3d XPS spectra of fresh catalysts. Peaks assigned to Rh 3d5/2 and Rh 3d3/2 are at 306–311 eV and 311–317 eV, respectively. The following discussion will be focused on the Rh 3d5/2 peak due to its higher intensity. The binding energy of reduced Rh species (Rh0) is at 307.0–307.7 eV, that of non-stoichiometric Rh oxide (Rh+) is at about 308.1 eV, and that of Rh3+ is at 308.3–310.5 eV.6,12,40–42 Rh 3d5/2 peaks are located at 309.3, 309.5, and 309.6 eV for Rh/Zn–Al2O3-800, Rh/Zn–Al2O3-500, and Rh/Al2O3-800, respectively, indicating that Rh species mainly exist as Rh3+ in the form of Rh2O3. Only a small portion of Rh species (<10%) exist as Rh0. It is reasonable because the catalysts have been calcined at 500 or 800 °C in air and without further reduction. However, Rh 3d spectrum of Rh/ZnO-800 is quite different, showing a very sharp and strong peak at 308.2 eV, indicating the formation of non-stoichiometric Rh oxide. Due to low surface area of ZnO, relatively big Rh2O3 particles on ZnO (Fig. S4d†) have different chemical properties as compared to smaller particles.11 In addition, high surface Rh density on low-surface-area ZnO results in stronger Rh signal. Fig. S6† compares the XPS spectra of Rh/Zn–Al2O3-800 with and without being pretreated in 4% H2 (balance He) at 400 °C for 2 h. Binding energy of Rh 3d5/2 peak declines from 309.3 eV (without pretreatment) to 308.6 eV (with pretreatment), indicating the partial reduction of Rh species (the proportion of Rh0 increases from 9.1% to 26.0%) upon H2 pretreatment.
Activity measurement
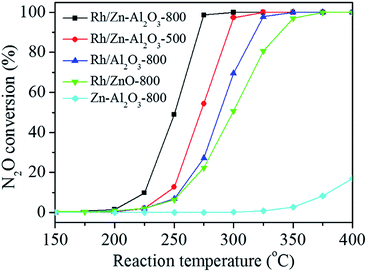
Fig. 6 shows the N2O conversions on supported Rh catalysts as a function of reaction temperature. The catalytic activity on these catalysts follows the sequence of Rh/Zn–Al2O3-800 > Rh/Zn–Al2O3-500 > Rh/Al2O3-800 > Rh/ZnO-800. The N2O conversions over these catalysts at 275 °C are 98.7%, 54.4%, 27.2%, and 22.3%, respectively. The specific rates of these catalysts (expressed as moles of N2O converted per mole of Rh per minute) at 275 °C are calculated to be 0.226, 0.125, 0.069, and 0.056 min−1, respectively. The T50 (temperature required for 50% conversion) values of these catalysts are 251, 273, 289, and 300 °C, respectively. Note that ZnO referred to above was prepared by precipitation. An additional Rh/ZnO-800 catalyst was prepared using ZnO obtained by calcining Zn(NO3)2·6H2O at 800 °C for 4 h. That catalyst is less active than Rh/ZnO-800 mentioned above (Fig. S7†). In addition, Zn–Al2O3-800 (without Rh) is much less active (17.0% N2O conversion at 400 °C) than Rh/Zn–Al2O3, indicating that Rh2O3 act as the main active sites for N2O decomposition.The effect of calcination temperature of Zn–Al2O3 on the activity of the resulting Rh/Zn–Al2O3 catalysts was studied. As shown in Fig. S8,† the N2O conversions over Rh/Zn–Al2O3-500, Rh/Zn–Al2O3-600, Rh/Zn–Al2O3-700, Rh/Zn–Al2O3-800, and Rh/Zn–Al2O3-900 at 275 °C are 54.4%, 55.5%, 68.0%, 98.7%, and 47.1%, respectively. The T50 values of these catalysts are 273, 272, 266, 251, and 277 °C, respectively. The activities of these catalysts follow the sequence of Rh/Zn–Al2O3-900 < Rh/Zn–Al2O3-500 ∼ Rh/Zn–Al2O3-600 < Rh/Zn–Al2O3-700 < Rh/Zn–Al2O3-800, i.e., Rh/Zn–Al2O3-800 is the most active.
The effect of Zn content on the performance of Rh/Zn–Al2O3 catalysts was also studied. As shown in Fig. S9,† the N2O conversions over Rh/Al2O3-800, Rh/0.5% Zn–Al2O3-800, Rh/1% Zn–Al2O3-800, Rh/10% Zn–Al2O3-800, and Rh/20% Zn–Al2O3-800 at 275 °C are 27.2%, 89.7%, 98.7%, 83.7%, and 70.1%, respectively. The T50 values of these catalysts are 289, 258, 251, 261, and 265 °C, respectively. The activities of these catalysts follow the sequence of Rh/Al2O3-800 < Rh/20% Zn–Al2O3-800 < Rh/10% Zn–Al2O3-800 < Rh/0.5% Zn–Al2O3-800 < Rh/1% Zn–Al2O3-800, i.e., Rh/1% Zn–Al2O3-800 is the most active.
Fig. S10† shows the influence of different GHSV values (7420, 14![[thin space (1/6-em)]](https://www.rsc.org/images/entities/char_2009.gif) 840, and 37
840, and 37![[thin space (1/6-em)]](https://www.rsc.org/images/entities/char_2009.gif) 100 h−1), achieved by adjusting the catalyst dosage (0.5, 0.25, and 0.1 g, respectively), on the performance of the optimal catalyst Rh/1% Zn–Al2O3-800. In general, a decrease of N2O conversion is seen at a high GHSV at the same reaction temperature. The T50 values are 251, 266, and 291 °C at GHSV of 7420, 14
100 h−1), achieved by adjusting the catalyst dosage (0.5, 0.25, and 0.1 g, respectively), on the performance of the optimal catalyst Rh/1% Zn–Al2O3-800. In general, a decrease of N2O conversion is seen at a high GHSV at the same reaction temperature. The T50 values are 251, 266, and 291 °C at GHSV of 7420, 14![[thin space (1/6-em)]](https://www.rsc.org/images/entities/char_2009.gif) 840, and 37
840, and 37![[thin space (1/6-em)]](https://www.rsc.org/images/entities/char_2009.gif) 100 h−1, respectively. However, the N2O conversion still reaches 87.5% at 325 °C when the GHSV is as high as 37
100 h−1, respectively. However, the N2O conversion still reaches 87.5% at 325 °C when the GHSV is as high as 37![[thin space (1/6-em)]](https://www.rsc.org/images/entities/char_2009.gif) 100 h−1.
100 h−1.
Fig. S11† shows the influence of Rh/M–Al2O3-800 (M = Zn, Mg, Co, Ni, Cu) catalysts with different divalent metal cations on N2O decomposition. The M content is fixed to be 1 wt%. All Rh/M–Al2O3-800 catalysts exhibit superior performance than Rh/Al2O3-800. The N2O conversions on Rh/Zn–Al2O3-800, Rh/Mg–Al2O3-800, Rh/Co–Al2O3-800, Rh/Ni–Al2O3-800, Rh/Cu–Al2O3-800, and Rh/Al2O3-800 at 275 °C are 98.7%, 64.1%, 76.0%, 72.9%, 82.5%, and 27.2% respectively. Rh/Zn–Al2O3-800 is still the most active among these catalysts.
Fig. 7 shows N2O conversion over Rh/Zn–Al2O3-800 and Rh/Al2O3-800 in the absence or presence of H2O, O2, or CO2. According to the literature,6,19 H2O and O2 cause competitive adsorption with N2O on active sites, leading to severe inhibition of activity on Rh-based catalysts. The T50 value of Rh/Zn–Al2O3-800 in the absence of H2O, O2, or CO2 is 251 °C. The T50 value increases to 272 °C when 5% O2 alone is added to the reaction mixture, and it increases more obviously to 321 °C when 2% H2O alone is added. When 5% O2 and 2% H2O are co-fed to the reaction mixture, the T50 value increases further to 333 °C. The addition of 2% CO2 alone makes the T50 value become 284 °C. The presence of H2O, O2, or CO2 also exerts similar inhibiting effects on Rh/Al2O3-800, only that Rh/Al2O3-800 is always much less active than Rh/Zn–Al2O3-800 under respective condition for comparison. The stability of both Rh/Zn–Al2O3-800 and Rh/Al2O3-800 as a function of time on stream is good, either in the absence or presence of 2% H2O and 5% O2 (Fig. S12†).
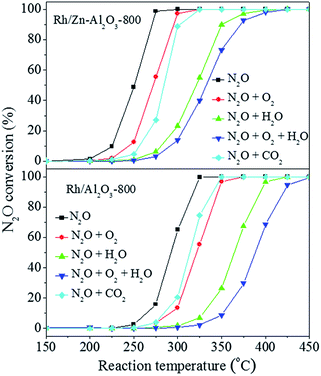 | ||
| Fig. 7 Influence of co-feed 5% O2, 2% H2O, or 2% CO2 on the conversion of N2O over Rh/Zn–Al2O3-800 and Rh/Al2O3-800 as a function of reaction temperature. | ||
Gas-switching experiments were conducted to know whether the inhibiting effect of O2, and H2O is reversible. Fig. 8 clearly shows that N2O conversion decreases almost immediately when 5% O2 is co-fed into the reactor, but the conversion can be restored when stopping feeding O2. 2% H2O has a more obviously inhibiting effect, but such an inhibiting effect is also reversible.11,26
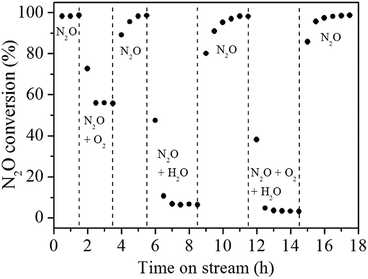 | ||
| Fig. 8 Response of N2O conversion to step changes of co-feed 5% O2 and/or 2% H2O over Rh/Zn–Al2O3-800 at 275 °C. | ||
O2 reaction order was measured by changing O2 concentration while keeping N2O concentration as 0.5%,43 to further explore the inhibition effect of oxygen. To eliminate diffusion factor, catalysts usage (0.128, 0.204, 0.256, and 0.306 g for Rh/Zn–Al2O3-800, Rh/Zn–Al2O3-500, Rh/Al2O3-800 and Rh/ZnO-800, respectively) and reaction temperature (230, 250, 260, and 290 °C for Rh/Zn–Al2O3-800, Rh/Zn–Al2O3-500, Rh/Al2O3-800 and Rh/ZnO-800, respectively) were chosen to control the N2O conversion below 15%. As shown in Fig. 9, a good linearity between ln(rate) versus ln(O2 concentration) enables us to derive O2 reaction orders as −0.352, −0.540, −0.598, and −0.707 for Rh/Zn–Al2O3-800, Rh/Zn–Al2O3-500, Rh/Al2O3-800, and Rh/ZnO-800, respectively. The data indicate that the inhibition effect of O2 on Rh/Zn–Al2O3-800 is the weakest, whereas that on Rh/ZnO-800 is the strongest.
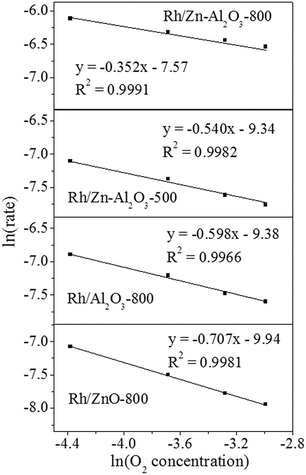 | ||
| Fig. 9 Influence of O2 concentration on the activities of Rh/Zn–Al2O3-800, Rh/Zn–Al2O3-500, Rh/Al2O3-800, and Rh/ZnO-800 in N2O decomposition. | ||
The influence of 4% H2 pretreatment on Rh/Zn–Al2O3-800 was investigated. As shown in Fig. S13,† the H2 pretreatment could improve the activity. The N2O conversion reaches 64.5% at 250 °C (in comparison to the 48.9% conversion achieved on the catalyst without being pretreated in H2). It has been reported that metallic Rh is more favorable for N2O decomposition on non-reducible support,10,25 thus the formation of some metallic Rh after H2 reduction (the proportion of Rh0 increases from 9.1% to 26.0% upon H2 pretreatment, Fig. S6†) should be the reason of the promoted activity although Rh2O3 can also catalyze this reaction.
Chemical properties of Rh/Zn–Al2O3 and reference samples
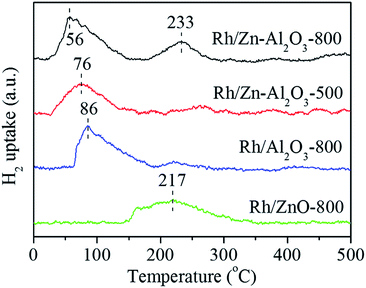
Fig. S14† shows the CO2-TPD profiles of Zn–Al2O3-800, Zn–Al2O3-500, Al2O3-800, and ZnO-800, and the values of calculated basicity are listed in Table 1. It was reported that ZnAl2O4 exhibits higher basic site density than Al2O3.44 However, here Zn–Al2O3-800, Zn–Al2O3-500, and Al2O3-800 show similar CO2-TPD profiles. The amounts of basic sites of these supports are 14.6, 13.5, and 14.3 μmol g−1, respectively. Low Zn loading should be the reason for the similarity, because only a small amount of ZnAl2O4 phase is formed on Al2O3 surface. On the other hand, ZnO-800 with a low surface area (4 m2 g−1) has the smallest amount of basic sites (4.4 μmol g−1), in accordance with a previous report.45Fig. 10 shows the H2-TPR profiles of Rh/Zn–Al2O3-800, Rh/Zn–Al2O3-500, Rh/Al2O3-800, and Rh/ZnO-800. All catalysts exhibit reduction peaks below 300 °C, assigned to the reduction of Rh species.17,30,42 The reduction temperature follows the sequence of Rh/Zn–Al2O3-800 (56 °C) < Rh/Zn–Al2O3-500 (76 °C) < Rh/Al2O3 (86 °C) < Rh/ZnO-800 (217 °C). The reduction temperature of Rh/ZnO-800 is much higher than those of other catalysts, probably due to larger Rh particles (TEM, Fig. 4 and S4†) with a distinctive electronic property (XPS, Fig. 5). In addition, a peak located at 233 °C is exhibited (the result is reproducible) in Rh/Zn–Al2O3-800, may due to the strong interaction between the support and Rh, resulting in the formation of other Rh-containing species instead of Rh2O3.46,47
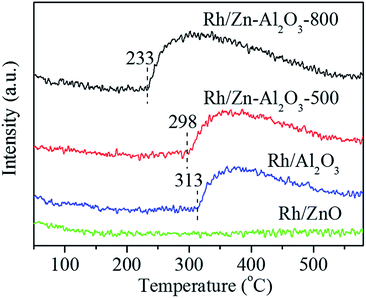
Fig. 11 shows the O2-TPD profiles of Rh/Zn–Al2O3-800, Rh/Zn–Al2O3-500, Rh/Al2O3-800, and Rh/ZnO-800. Rh/ZnO-800 does not show any oxygen desorption peak, whereas other three catalysts all show an oxygen desorption peak below 580 °C. The starting desorption temperature follows the order of Rh/Zn–Al2O3-800 (233 °C) < Rh/Zn–Al2O3-500 (298 °C) < Rh/Al2O3-800 (313 °C), whereas the amounts of oxygen desorption follow the sequence of Rh/Zn–Al2O3-800 > Rh/Zn–Al2O3-500 > Rh/Al2O3-800 (Table 1).
Discussion
The N2O decomposition activities of four catalysts follow the sequence of Rh/Zn–Al2O3-800 > Rh/Zn–Al2O3-500 > Rh/Al2O3-800 > Rh/ZnO-800 (Fig. 6). The catalytic performance of the best catalyst (Rh/Zn–Al2O3-800) in this work is then compared with the performance of other catalysts. Table S1† lists the T50 and T90 values of various catalysts, together with the reaction conditions. Although the Rh/Zn–Al2O3-800 catalyst seems to be more active than most of the catalysts, such as Cu-,48–50 Fe-,5,51,52 and Co-based catalysts,53–56 as well as Pd-, Pt-8,10,57 and Ir-based58 catalysts (judging from the T50 values), it is not appropriate to claim that because of the difference in reaction conditions. Hence, the activity of Rh/Zn–Al2O3-800 is compared with Rh/SiO2, Rh/Al2O3, Rh/TiO2, and Rh/CeO2 (all with ca. 1 wt% Rh) tested under the same reaction condition in our laboratory.25 As shown in Table S1,† the T50 values of Rh/Zn–Al2O3-800, Rh/SiO2, Rh/Al2O3, Rh/TiO2, and Rh/CeO2 are 251, 324, 289, 310, and 223 °C, respectively, indicating the good performance of Rh/Zn–Al2O3-800 among these supported Rh catalysts. The activity sequence of catalysts is Rh/CeO2 > Rh/Zn–Al2O3-800 > Rh/Al2O3 > Rh/TiO2 > Rh/SiO2. Rh/Zn–Al2O3-800 (T50 = 251 °C) is less active than Rh/HAP–PEG-200 (ca. 1 wt% Rh supported on hydroxyapatite nanorods synthesized through hydrothermal method, and tested under the same reaction condition) that shows a T50 value of 223 °C.27 However, the synthesis of Rh/Zn–Al2O3-800 is more convenient and of low cost, and Rh/Zn–Al2O3-800 shows superior activity than Rh/HAP–PEG-200 in the presence of 2% H2O and 5% O2. T50 values of these two catalysts under such a condition are 333 and 344 °C, respectively.After comparing the catalytic activity, we then attempt to discuss why Rh/Zn–Al2O3-800 is more active than Rh/Zn–Al2O3-500, Rh/Al2O3-800, and Rh/ZnO-800. The structural properties of γ-Al2O3 are not significantly altered by the incorporation of 1 wt% Zn, as seen from the micro-morphology (TEM, Fig. 4) and specific surface areas (Table 1). The average size of Rh2O3 particles follows the sequence of Rh/Zn–Al2O3-800 < Rh/Zn–Al2O3-500 < Rh/Al2O3-800 < Rh/ZnO-800 (also proved by Rh dispersion, Table 1), inversely correlating to the order of catalytic activity, in the sense that a catalyst with smaller Rh2O3 particles has higher activity in N2O decomposition.25,26,28 The data thus infer that the formation of surface ZnAl2O4 spinels on Al2O3 support may be beneficial for the high dispersion of Rh2O3 particles.
In our ongoing research, bulk ZnAl2O4 support is also found to be able to lead to high dispersion of Rh2O3 species, thus promoting the catalytic activity (data not shown). There seems to be a stronger interaction between Rh2O3 and ZnAl2O4 phase. Similar conclusions can be found in the literature. As revealed by theoretical calculation reveals that MgAl2O4 (spinel structure) has a stronger interaction with supported Rh and Ir particles than γ-Al2O3, promoting the dispersion of Rh and Ir as well as the stability of the catalysts in methane steam reforming.32 In addition, smaller Pd nanoparticles could be immobilized on ZnAl2O4 surface, leading to higher activity and good stability in Suzuki–Miyaura coupling reaction.33 It was also reported that Rh prefers to be located on the spinel phase of metal modified-Al2O3 support.59 Therefore, the better Rh dispersion on Rh/Zn–Al2O3-800 should be caused by the formation of ZnAl2O4 phase on Al2O3 support, as proved by Raman (Fig. 3). XRD data also provide indirect evidence because Zn–Al2O3-800 supports with low Zn contents do not show ZnAl2O4 peaks due to the low concentration of Zn, whereas Zn–Al2O3-800 supports with relatively high Zn contents show ZnAl2O4 peaks clearly (Fig. 2). Another piece of evidence showing the strong interaction between Rh2O3 and ZnAl2O4 comes from the H2-TPR data, as an additional reduction peak shows up at a higher temperature of 233 °C (Fig. 10).
As shown in XPS data (Fig. 5), the binding energies of Rh 3d5/2 follow the sequence of Rh/Zn–Al2O3-800 (309.3 eV) < Rh/Zn–Al2O3-500 (309.5 eV) < Rh/Al2O3-800 (309.6 eV), indicating the electronic properties of Rh species are altered by the supports. Rh/Zn–Al2O3-800 exhibits the lowest Rh 3d5/2 binding energy among these catalysts, indicating the strongest shielding effect caused by the highest outer electron density. It has been reported that metal–oxygen bonding energy is weaker in metal oxides with higher electron density, because the electron could fill into the empty orbit of oxygen.60–63 As a result, Rh2O3 on Zn–Al2O3-800 is easier to be reduced due to the weaker bonding between Rh and oxygen (H2-TPR, Fig. 10). In the literature, the higher activity of catalysts in N2O decomposition has been correlated to the reduction behaviour of catalysts (more specifically, the active components) in some cases.64–68 That is not to say that these catalysts have to be reduced prior to the reaction testing. Rather, the enhanced reducibility means the weakening of the M–O bonds, which is expected to be important for N2O decomposition, i.e., the adsorbed oxygen can be desorbed from the catalyst more easily.
In another aspect, oxygen desorption is a key step in N2O decomposition, even rate-determining step in many cases.2,10,24,56,69 If oxygen can not be smoothly desorbed from catalysts surface, the active sites will be occupied by oxygen, blocking the catalytic circle. As shown in Fig. 9, the starting O2-desorption temperature follows the order of Rh/Zn–Al2O3-800 (233 °C) < Rh/Zn–Al2O3-500 (298 °C) < Rh/Al2O3-800 (313 °C), in line with the notion that easy desorption of O2 is beneficial for catalytic N2O decomposition.26,27,70,71 In addition, the inhibition effect of O2 (as seen from the oxygen reaction order, Fig. 8) on catalytic activity follows the sequence of Rh/Zn–Al2O3-800 < Rh/Zn–Al2O3-500 < Rh/Al2O3-800 < Rh/ZnO, inversely correlating with the activity sequence of these catalysts.
Conclusions
Zn(NO3)2 was impregnated onto a commercial γ-Al2O3 support. The composite was then calcined in air at 500 or 800 °C. The resulting Zn–Al2O3-500 and Zn–Al2O3-800 supports were used to load Rh via impregnation with Rh(NO3)3 and calcination at 500 °C. While the Zn species in Rh/Zn–Al2O3-500 is ZnO, the Zn species in Rh/Zn–Al2O3-800 is ZnAl2O4. The activities of four catalysts in N2O decomposition follow the sequence of Rh/Zn–Al2O3-800 > Rh/Zn–Al2O3-500 > Rh/Al2O3-800 > Rh/ZnO-800, correlating with the size of Rh2O3 particles, the reducibility of Rh2O3, the O2-desorption property, and the oxygen reaction order. The most active Rh/Zn–Al2O3-800 has the smallest Rh2O3 particles (i.e., the highest Rh dispersion), the lowest reduction temperature of Rh2O3, the lowest O2 desorption temperature, and its activity is influenced by the presence of O2 least obviously. The formation of ZnAl2O4 on Al2O3 support is beneficial for the stabilization of Rh2O3 particles. This work demonstrates a convenient way for preparing active Rh catalysts based on commercial γ-Al2O3 support.Acknowledgements
Y. Yue thanks the financial support by the National Natural Science Foundation of China (21273043). Z. Ma thanks the financial support by the National Natural Science Foundation of China (21177028 and 21477022). W. Hua thanks the financial support by the Science and Technology Commission of Shanghai Municipality (13DZ2275200) and Shanghai Research Institute of Petrochemical Technology SINOPEC (14ZC06070009).Notes and references
- J. Pérez-Ramírez, F. Kapteijn, K. Schöffel and J. A. Moulijn, Appl. Catal., B, 2003, 44, 117–151 CrossRef.
- F. Kapteijn, J. Rodriguez-Mirasol and J. A. Moulijn, Appl. Catal., B, 1996, 9, 25–64 CrossRef CAS.
- M. L. Li, X. L. Yang, L. P. Tang, X. M. Xiong, S. L. Ren and B. Hu, Progr. Chem., 2012, 24, 1801–1817 CAS.
- M. Konsolakis, ACS Catal., 2015, 5, 6397–6421 CrossRef CAS.
- P. F. Xie, Y. J. Luo, Z. Ma, C. Y. Huang, C. X. Miao, Y. H. Yue, W. M. Hua and Z. Gao, J. Catal., 2015, 330, 311–322 CrossRef CAS.
- J. Oi, A. Obuchi, G. R. Bamwenda, A. Ogata, H. Yagita, S. Kushiyama and K. Mizuno, Appl. Catal., B, 1997, 12, 277–286 CrossRef CAS.
- G. Centi, L. Dall'Olio and S. Perathoner, Appl. Catal., A, 2000, 194, 79–88 CrossRef.
- K. Doi, Y. Y. Wu, R. Takeda, A. Matsunami, N. Arai, T. Tagawa and S. Goto, Appl. Catal., B, 2001, 35, 43–51 CrossRef CAS.
- J. M. Du, W. W. Kuang, H. L. Xu, W. Shen and D. Y. Zhao, Appl. Catal., B, 2008, 84, 490–496 CrossRef CAS.
- S. Parres-Esclapez, I. Such-Basañez, M. J. Illán-Gómez, C. S. M. de Lecea and A. Bueno-López, J. Catal., 2010, 276, 390–401 CrossRef CAS.
- H. Beyer, J. Emmerich, K. Chatziapostolou and K. Köhler, Appl. Catal., A, 2011, 391, 411–416 CrossRef CAS.
- M. Hussain, D. Fino and N. Russo, J. Hazard. Mater., 2012, 211, 255–265 CrossRef PubMed.
- V. Rico-Pérez and A. Bueno-López, Appl. Sci., 2014, 4, 468–481 CrossRef.
- M. Piumetti, M. Hussain, D. Fino and N. Russo, Appl. Catal., B, 2015, 165, 158–168 CrossRef CAS.
- S. Imamura, R. Hamada, Y. Saito, K. Hashimoto and H. Jindai, J. Mol. Catal. A: Chem., 1999, 139, 55–62 CrossRef CAS.
- G. Centi, S. Perathoner, F. Vazzana, M. Marella, M. Tomaselli and M. Mantegazza, Adv. Environ. Res., 2000, 4, 325–338 CrossRef.
- S. Imamura, J. Tadani, Y. Saito, Y. Okamoto, H. Jindai and C. Kaito, Appl. Catal., A, 2000, 201, 121–127 CrossRef CAS.
- S. S. Kim, S. J. Lee and S. C. Hong, J. Ind. Eng. Chem., 2012, 18, 1263–1266 CrossRef CAS.
- S. Parres-Esclapez, M. J. Illán-Gómez, C. S. M. de Lecea and A. Bueno-López, Int. J. Greenhouse Gas Control, 2012, 11, 251–261 CrossRef CAS.
- R. Amrousse and A. Tsutsumi, Catal. Sci. Technol., 2016, 6, 438–441 CAS.
- H. Liu, Y. Lin and Z. Ma, Chin. J. Catal., 2016, 37, 73–82 CrossRef CAS.
- K. Yuzaki, T. Yarimizu, S. Ito and K. Kunimori, Catal. Lett., 1997, 47, 173–175 CrossRef CAS.
- S. Imamura, T. Kitao, H. Kanai, S. Shono, K. Utani and H. Jindai, React. Kinet. Catal. Lett., 1997, 61, 201–207 CrossRef CAS.
- S. Tanaka, K. Yuzaki, S. Ito, S. Kameoka and K. Kunimori, J. Catal., 2001, 200, 203–208 CrossRef CAS.
- C. Y. Huang, Z. Ma, P. F. Xie, Y. H. Yue, W. M. Hua and Z. Gao, J. Mol. Catal. A: Chem., 2015, 400, 90–94 CrossRef CAS.
- Y. Lin, T. Meng and Z. Ma, J. Ind. Eng. Chem., 2015, 28, 138–146 CrossRef CAS.
- C. Y. Huang, Y. X. Jiang, Z. Ma, P. F. Xie, Y. Lin, T. Meng, C. X. Miao, Y. Y. Yue, W. M. Hua and Z. Gao, J. Mol. Catal. A: Chem., 2016, 420, 73–81 CrossRef CAS.
- J. Haber, M. Nattich and T. Machej, Appl. Catal., B, 2008, 77, 278–283 CrossRef CAS.
- S. Parres-Esclapez, F. E. López-Suárez, A. Bueno-López, M. J. Illán-Gómez, B. Ura and J. Trawczynski, Top. Catal., 2009, 52, 1832–1836 CrossRef CAS.
- X. Y. Zhao, Y. Cong, Y. Q. Huang, S. Liu, X. D. Wang and T. Zhang, Catal. Lett., 2011, 141, 128–135 CrossRef CAS.
- S. S. Kim, S. J. Lee and S. C. Hong, Chem. Eng. J., 2011, 169, 173–179 CrossRef CAS.
- D. H. Mei, V. Glezakou, V. Lebarbier, L. Kovarik, H. Y. Wan, K. O. Albrecht, M. Gerber, R. Rousseau and R. A. Dagle, J. Catal., 2014, 316, 11–23 CrossRef CAS.
- M. Fang, G. L. Fan and F. Li, Catal. Lett., 2014, 144, 142–150 CrossRef CAS.
- C. R. Gorla, W. E. Mayo, S. Liang and Y. Lu, J. Appl. Phys., 2000, 87, 3736–3743 CrossRef CAS.
- M. Nilsson, K. Jansson, P. Jozsa and L. J. Pettersson, Appl. Catal., B, 2009, 86, 18–26 CrossRef CAS.
- X. Y. Liu, S. J. Wang and L. C. Guo, Chin. J. Catal., 1994, 15, 1–7 CrossRef CAS.
- L. M. Chen, X. M. Sun, Y. N. Liu, K. B. Zhou and Y. D. Li, J. Alloys Compd., 2004, 376, 257–261 CrossRef CAS.
- S. López-Moreno, P. Rodríguez-Hernández, A. Muñoz, A. H. Romero, F. J. Manjón, D. Errandonea, E. Rusu and V. V. Ursaki, Ann. Phys., 2011, 523, 157–167 CrossRef.
- L. Yang, Y. J. Zhao, R. Yin and F. Li, J. Am. Ceram. Soc., 2014, 97, 1123–1130 CrossRef CAS.
- J. Soria, A. Martínez-Arias, J. L. G. Fierro and J. C. Conesa, Vacuum, 1995, 46, 1201–1204 CrossRef CAS.
- Y. Wang, Z. Song, D. Ma, H. Y. Luo, D. B. Liang and X. H. Bao, J. Mol. Catal. A: Chem., 1999, 149, 51–61 CrossRef CAS.
- A. Bueno-López, I. Such-Basáñez and C. S. M. de Lecea, J. Catal., 2006, 244, 102–112 CrossRef.
- T. N. Angelidis and V. Tzitzios, Ind. Eng. Chem. Res., 2003, 42, 2996–3000 CrossRef CAS.
- Q. H. Liu, L. Wang, C. X. Wang, W. Qu, Z. J. Tian, H. J. Ma, D. E. Wang, B. C. Wang and Z. S. Xu, Appl. Catal., B, 2013, 136, 210–217 CrossRef.
- E. Seker, Int. J. Hydrogen Energy, 2008, 33, 2044–2052 CrossRef CAS.
- C. Mateos-Pedrero, S. R. González-Carrazán, M. A. Soria and P. Ruíz, Catal. Today, 2013, 203, 158–162 CrossRef CAS.
- K. Polychronopoulou, J. L. G. Fierro and A. M. Efstathiou, J. Catal., 2004, 228, 417–432 CrossRef CAS.
- P. F. Xie, Z. Ma, H. B. Zhou, C. Y. Huang, Y. H. Yue, W. Shen, H. L. Xu, W. M. Hua and Z. Gao, Microporous Mesoporous Mater., 2014, 191, 112–117 CrossRef CAS.
- M. Konsolakis, S. A. C. Carabineiro, E. Papista, G. E. Marnellos, P. B. Tavares, J. A. Moreira, Y. Romaguera-Barcelay and J. L. Figueiredo, Catal. Sci. Technol., 2015, 5, 3714–3727 CAS.
- D. Pietrogiacomi, M. C. Campa, L. R. Carbone, S. Tuti and M. Occhiuzzi, Appl. Catal., B, 2016, 187, 218–227 CrossRef CAS.
- R. D. Zhang, K. Hedjazi, B. Chen, Y. X. Li, Z. G. Lei and N. Liu, Catal. Today, 2016, 273, 273–285 CrossRef CAS.
- Z. F. Yan, Z. Li, K. He, J. S. Zhao, X. R. Lou, Z. Li, J. S. Zhang and W. Huang, Energy Sources, Part A, 2016, 38, 315–321 CrossRef CAS.
- P. F. Xie, Y. J. Luo, Z. Ma, C. Y. Huang, Y. H. Yue, W. M. Hua and Z. Gao, Appl. Catal., B, 2015, 170–171, 34–42 CrossRef CAS.
- H. M. Choi, S. J. Lee, S. H. Moon, T. N. Phan, S. G. Jeon and C. H. Ko, Catal. Commun., 2016, 82, 50–54 CrossRef CAS.
- C. Zhang, Z. P. Zhang, C. Sui, F. L. Yuan, X. Y. Niu and Y. J. Zhu, ChemCatChem, 2016, 8, 2155–2164 CrossRef CAS.
- H. B. Yu, M. Tursun, X. P. Wang and X. X. Wu, Appl. Catal., B, 2016, 185, 100–118 CrossRef.
- S. Parres-Esclapez, M. J. Illán-Gómez, C. S. M. de Lecea and L. Bueno-López, Appl. Catal., B, 2013, 96, 370–378 CrossRef.
- E. Pachatouridou, E. Papista, A. Delimitis, M. A. Vasiliades, A. M. Efstathiou, M. D. Amiridis, O. S. Alexeev, D. Bloom, G. E. Marnellos, M. Konsolakis and E. Iliopoulou, Appl. Catal., B, 2016, 187, 259–268 CrossRef CAS.
- P. Benito, W. de Nolf, G. Nuyts, M. Monti, G. Fornasari, F. Basile, K. Janssens, F. Ospitali, E. Scavetta, D. Tonelli and A. Vaccari, ACS Catal., 2014, 4, 3779–3790 CrossRef CAS.
- L. Obalová, K. Karáskovà, K. Jitátová and F. Kovanda, Appl. Catal., B, 2009, 90, 132–140 CrossRef.
- K. Asano, C. Ohnishi, S. Iwamoto, Y. Shioya and M. Inoue, Appl. Catal., B, 2008, 78, 242–249 CrossRef CAS.
- L. Xue, H. He, C. Liu, C. B. Zhang and B. Zhang, Environ. Sci. Technol., 2009, 43, 890–895 CrossRef CAS PubMed.
- H. K. Cheng, Y. Q. Huang, A. Q. Wang, L. Li, X. D. Wang and T. Zhang, Appl. Catal., B, 2009, 89, 391–397 CrossRef CAS.
- H. J. Wang, Y. H. Teng, L. Radhakrishnan, Y. Nemoto, M. Imura, Y. Shimakawa and Y. Yamauchi, J. Nanosci. Nanotechnol., 2011, 11, 3843–3850 CrossRef CAS PubMed.
- Y. G. Wang, Y. Q. Wang, X. H. Liu, Y. Guo, Y. L. Guo, G. Z. Lu and F. Schuth, J. Nanosci. Nanotechnol., 2008, 8, 5652–5658 CrossRef CAS PubMed.
- Y. G. Wang, X. H. Yuan, X. H. Liu, J. W. Ren, W. Y. Tong, Y. Q. Wang and G. Z. Lu, Solid State Sci., 2008, 10, 1117–1123 CrossRef CAS.
- Y. S. Xia, H. X. Dai, L. Zhang, J. G. Deng, H. He and C. T. Au, Appl. Catal., B, 2010, 100, 229–237 CrossRef CAS.
- Y. S. Xia, H. X. Dai, H. Y. Jiang and L. Zhang, Catal. Commun., 2010, 11, 1171–1175 CrossRef CAS.
- S. Tanaka, K. Yuzaki, S. Ito, H. Uetsuka, S. Kameoka and K. Kunimori, Catal. Today, 2000, 63, 413–418 CrossRef CAS.
- M. Shimokawabe, K. Hirano and N. Takezawa, Catal. Today, 1998, 45, 117–122 CrossRef CAS.
- N. Pasha, N. Lingaiah, N. S. Babu, P. S. S. Reddy and P. S. S. Prasad, Catal. Commun., 2008, 10, 132–136 CrossRef CAS.
Footnote |
| † Electronic supplementary information (ESI) available. See DOI: 10.1039/c6ra25388a |
| This journal is © The Royal Society of Chemistry 2017 |

