 Open Access Article
Creative Commons Attribution 3.0 Unported Licence
Third- and high-order nonlinear optical properties of an intramolecular charge-transfer compound†
C. Wanga,
C. Fana,
C. Yuana,
G. Yanga,
X. Lia,
C. Jua,
Y. Feng*ab and
J. Xu *a
*a
aSchool of Chemical Engineering and Technology, Tianjin University, Yaguan Road 135, 300350, Tianjin, P. R. China. E-mail: jialiang.xu@tju.edu.cn; yqfeng@tju.edu.cn
bCollaborative Innovation Center of Chemical Science and Engineering, Weijin Road 92, 300072, Tianjin, P. R. China
First published on 17th January 2017
Abstract
An oligo(phenylenevinylene) bridged intramolecular charge-transfer (ICT) compound, (TCNQ)2OPV3, has been synthesized and its third- and fifth-order nonlinear optical refraction indexes have been determined by measurement with the 4f system with a phase-object, under near-infrared excitation.
Organic π-conjugated molecules have been extensively studied and applied in diverse fields ranging from field-effect transistors (FETs),1,2 organic light-emitting diodes (OLEDs),3,4 and organic photovoltaic cells (OPVs),5–7 thanks to their attractive optoelectronic properties. π-Conjugated compounds with electron donors (D) and electron acceptors (A) typically feature a intramolecular charge transfer (ICT) process. In the solid state, the properties of ICT compounds are determined not only by the intrinsic features of their component moieties but also by their molecular packing modes. Control over the relative orientation of the component parts and subtle modulation of intermolecular overlap are very important aspects for ensuring desired functions. These compounds are of particular importance for applications in material science such as nonlinear optical (NLO) materials,8–10 electrogenerated chemiluminescence materials,11 fluorescence probes12 and dye-sensitized solar cells.13–17 Libraries of electron donors and acceptors have been explored for constructing such materials systems in the past decades.18 Recently a series of novel D–π–A molecular systems of donor-substituted tetracyanoethylene (TCNE) and 7,7,8,8-tetracyanoquinodimethane (TCNQ) adducts have been explored by Diederich et al.19–23 and other groups,24–31 by taking advantage of the “click-type” near-quantitative [2 + 2] cycloadditions with appropriately activated alkynes, followed by retro-electrocyclizations. These naturally stable, nonplanar chromophores are ideal platforms for efficient intramolecular charge-transfer (ICT) processes and are regarded as promising nonlinear optical materials.19–22,32–36
In this work, we have designed and synthesized an oligo(phenylenevinylene) (OPV) bridged ICT compound, (TCNQ)2OPV3, and studied its third- and fifth-order optical nonlinearities by a nonlinear optical imaging technique with the phase-object (NIT-PO) at the entry of a 4f coherent imaging system.37 The method is based on a 4f system with top-hat beams and its theoretical model is simple Fourier optics, which leads to many advantages such as simple optical alignment, very high sensitivity and insensitivity to statistical fluctuations of the laser beam.38 The improved technique of greater signal sensibility can be used to measure the nonlinear absorption and refraction at the same time. Another vital advantage of the technique is that it can extract information about both the magnitude and the sign of the nonlinear coefficients simultaneously with only one-laser-shot39 without the necessarity of scanning of the sample as that of the Z-scan method.40 Although the method was initially developed to measure the nonlinear refraction index of the materials, it can simultaneously measure the nonlinear refraction index and nonlinear absorption coefficient of materials conveniently from the analysis of three experiment images.41 Moreover, the results of different sensitivity of nonlinear absorption and refraction are given by choosing different phase shift of the phase object.42 As an efficient method, the technique of measurement has successfully utilized to study the kinetics of photo-induced effects by shot-by-shot measurements.43
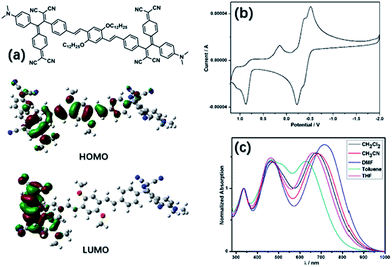
The ICT compound (TCNQ)2OPV3 has been synthesized following the [2 + 2] cycloaddition and the subsequent retro-electrocyclization of TCNQ with the OPV bridged alkynes which have been activated by electronic donating groups (Fig. 1a and Scheme S1 in the ESI†). The compound displays two charge-transfer (CT) bands at 470 nm and 677 nm, respectively, in CH2Cl2 in the UV-vis absorbance spectra, resulting from the two different D–A transitions of the compound (Fig. 1c and S1 in the ESI†). A distinct solvatochromic effect of (TCNQ)2OPV3 has been observed in varied solvents, which was a characteristic behavior of the dipolar ICT molecules.19–22,44 The major CT band at 677 nm (1.83 eV) in CH2Cl2 red-shifts to 687 nm (1.80 eV) in CH3CN and 718 nm (1.73 eV) in DMF, and blue-shifts to 658 nm (1.88 eV) in THF and 625 nm (1.98 eV) in toluene. The solvent effect of the CT band generally follows the reported tendency of red shift of such ICT compounds when increasing the solvent polarity.25 Cyclic voltammetry (CV) curves of (TCNQ)2OPV3 collected in CH2Cl2 with nBu4NPF6 (0.1 M) give the information on the redox properties (Fig. 1b). The compound shows two well-defined reversible one-electron reduction steps with the first electron transfer occurring at −0.51 V to −0.35 V and the second one at −0.38 V to −0.22 V (using the Ag/Ag+ electrode couple as the internal standard), occurring on the C![[double bond, length as m-dash]](https://www.rsc.org/images/entities/char_e001.gif) (CN)2 moieties of the molecule.20–22 The oxidation steps occurring on the aniline moieties are irreversible, as shown in the CV curves. Optimized geometry of the compound calculated from the B3LYP functional 6-31G(d,p) within the DFT level45–48 shows the greatly twisted configuration of the charge-transfer moieties and the slight distortion in the OPV3 bridge. The HOMO and LUMO obtained from DFT calculations show the electrons of HOMO are relatively homogeneous and a clear electron transfer while the electrons of LUMO are mainly distributed in the TCNQ derivative moieties.
(CN)2 moieties of the molecule.20–22 The oxidation steps occurring on the aniline moieties are irreversible, as shown in the CV curves. Optimized geometry of the compound calculated from the B3LYP functional 6-31G(d,p) within the DFT level45–48 shows the greatly twisted configuration of the charge-transfer moieties and the slight distortion in the OPV3 bridge. The HOMO and LUMO obtained from DFT calculations show the electrons of HOMO are relatively homogeneous and a clear electron transfer while the electrons of LUMO are mainly distributed in the TCNQ derivative moieties.
To study the NLO property of the compound, we use the shunt-wound double 4f system‡ to overcome the instability of energy and space distributing of the beam from OPG (optical parameter generator).49 The monitor branch is replaced by another 4f system. The theoretical model of the developed system is the same as the traditional ones. The shunt-wound double 4f system without material acquisition37 is only used to calculate the linear transmittance of the material if the linear transmittance of the material is known. This leads to simple calculation and easy data processing processes. The main difference between the developed 4f coherent imaging system and the traditional one is that the reference facula is used in the nonlinear acquisition instead of the main facula in the linear acquisition as the incident beam to fit the main facula in the nonlinear acquisition.
In a typical experiment, the excitation beam at 800 nm with 21 picoseconds (ps) pulse width (FWHM) which is emitted from the OPG pumped by a Q-switched, frequency-doubled Nd:YAG laser (Ekspla) is expanded to 40 mm in diameter and subsequently pass through the aperture with a phase-object (PO) (Scheme S2 in the ESI†). The radii of the aperture and PO are Rn = 1.70 mm and Ln = 0.5 mm respectively. The phase shift of the PO is φL = 0.266π. The 4f system of the main branch consists of two lenses L1 and L2 with the same focal length f1 = f2 = 100 mm, and the monitor branch consists of lenses L1 and L2 with the same focal length f1 = f2 = 100 mm. The airy radius at the focal plane of lens L1 is ω0 = 1.22λf1/(2Ra) = 28.7 μm, giving a Rayleigh range z0 = πω02/λ = 3.2 mm. This satisfies the thin sample approximation (2 mm-thick fused silica cell). The detecting system is a cooled charge-coupled device (CCD) camera with (1040 × 1376) pixels. The camera pixels have 4095 gray levels, and the size of each pixel is 6.4 × 6.4 μm2. Neutral filters (tf) are used to keep the CCD with its linear response range.
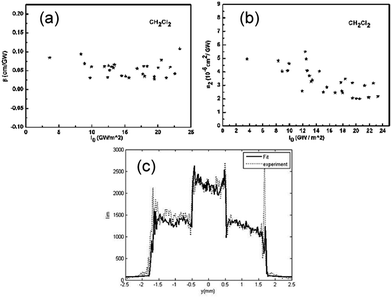
The nonlinear optical property of (TCNQ)2OPV3 has been deduced by subtracting nonlinear index of the solvent (CH2Cl2) from its solution for picoseconds excitation at 800 nm with the sample concentration of 8 × 10⁻⁵ M (see Fig. S2 in the ESI†). The values of third-order nonlinear absorption index β and third-order nonlinear refraction index n2 measured at different peak-on-axis intensity in the sample are shown in Fig. 2a and b, respectively. The average value of β is 0.0546 cm GW−1 with a standard error of ±13%, and the average value of n2 is 3.33 × 10⁻¹⁹ m2 W−1 with a standard error of ±6% (Fig. 2a and b). The comparison between the two profiles of experimental nonlinear image (in dots) and the calculated nonlinear image (in bold) shows a very good agreement between experimental result and numerical simulation (Fig. 2c).
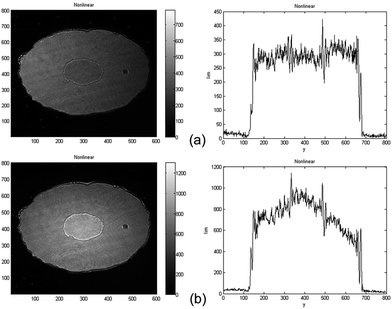
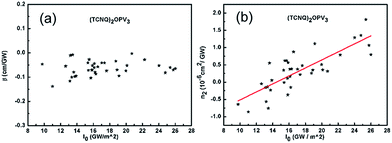
The optical nonlinearity of the solution has been measured under the same operation conditions as those for measuring the solvent. The two different main faculae of nonlinear image and its corresponding fluence distribution at x = 300 indicating two different sign of nonlinearity (Fig. 3). The values of β and n2 measured at different peak-on-axis intensity in the sample from 9.76 to 26 GW cm−2 are shown in Fig. 4a and b respectively. The change tendency of nonlinear absorption index β with peak-on-axis intensity is small with an average value of ![[small beta, Greek, macron]](https://www.rsc.org/images/entities/i_char_e0c3.gif) = −0.0638 cm GW−1, showing a good reproducibility of the measurements (Fig. 4a). The nonlinear absorption is mainly produced by the two-photon process (a third-order NLO).50,51 From Fig. 4b, a linear dependence of nonlinear refraction index n2 with peak-on-axis intensity has been noticed. One can clearly see that the solution exhibits negative nonlinearity as the peak-on-axis intensity is small (Fig. 3a), while it changes to positive when the peak-on-axis intensity is large enough (Fig. 3b). Because the nonlinear refraction index of the solvent is a little smaller as the peak-on-axis intensity is large enough, this indicates the existence of high-order nonlinearity besides the cubic term of the solute. High order terms with opposite sign are required to compensate the cubic term and to generate a sign change of the whole nonlinear refraction index of the solution. This is similar to what have been observed from quantum dot-polymer nanocomposite films,50,51 as determined by the Z-scan technique. We use the cubic/quintic model given by G. Boudebs et al.52–54 Let n2 and n4 represent the third-order and fifth-order nonlinear refraction indexes, respectively. The whole nonlinear refraction index measured is an effective refraction index and can be written as
= −0.0638 cm GW−1, showing a good reproducibility of the measurements (Fig. 4a). The nonlinear absorption is mainly produced by the two-photon process (a third-order NLO).50,51 From Fig. 4b, a linear dependence of nonlinear refraction index n2 with peak-on-axis intensity has been noticed. One can clearly see that the solution exhibits negative nonlinearity as the peak-on-axis intensity is small (Fig. 3a), while it changes to positive when the peak-on-axis intensity is large enough (Fig. 3b). Because the nonlinear refraction index of the solvent is a little smaller as the peak-on-axis intensity is large enough, this indicates the existence of high-order nonlinearity besides the cubic term of the solute. High order terms with opposite sign are required to compensate the cubic term and to generate a sign change of the whole nonlinear refraction index of the solution. This is similar to what have been observed from quantum dot-polymer nanocomposite films,50,51 as determined by the Z-scan technique. We use the cubic/quintic model given by G. Boudebs et al.52–54 Let n2 and n4 represent the third-order and fifth-order nonlinear refraction indexes, respectively. The whole nonlinear refraction index measured is an effective refraction index and can be written as
| neff2 = n2 + n4Im | (1) |
For α = 3.08 cm−1 (linear absorption index) and ![[small beta, Greek, macron]](https://www.rsc.org/images/entities/i_char_e0c3.gif) = −0.06382 cm GW−1, we obtain Im ≈ 0.9103I0 (see Fig. 4a), so eqn (1) becomes
= −0.06382 cm GW−1, we obtain Im ≈ 0.9103I0 (see Fig. 4a), so eqn (1) becomes
| neff2 = n2 + 0.9103n4I0 | (2) |
At the same time, we obtain eqn (3) by linear fit to the experimental result.
| neff2 (1 × 10⁻¹⁹ m2 W−1) = 0.1159I0 (GW m−2) − 1.6755 | (3) |
By comparing eqn (2) and (3), we obtain the two nonlinear refraction indexes n2 = −1.676 × 10⁻¹⁹ m2 W−1 and n4 = 1.273 × 10⁻³³ m4 W−2. So the nonlinear refraction index of solute can be deduced by subtracting nonlinear refraction index of solvent from the solution. The third- and fifth-order refraction indexes have been deduced to be nsolute2 = −5.01 × 10⁻¹⁹ m2 W−1 and nsolute4 = −1.273 × 10⁻³³ m4 W−2 respectively.
In conclusion, the nonlinear optical properties of an ICT compound (TCNQ)2OPV3 in the near infrared have been investigated by using a nonlinear-imaging technique with phase-object at the entry of a 4f coherent imaging system. The third-order and fifth-order nonlinear refraction indexes have been deduced to be n2 = −1.676 × 10⁻¹⁹ m2 W−1 and n4 = −1.273 × 10⁻³³ m4 W−2 by subtracting nonlinear refraction index of the solvent from its solution for picoseconds excitation at 800 nm. The picosecond third- and fifth-nonlinear optical properties of the compound in the near-infrared and the new technique of 4f coherent nonlinear-imaging system with phase-object for determining NLO properties of the D–π–A organic molecular systems indicate potential applications both in the basic research field of nonlinear optical theory and the fields of photonic device fabrications.
Acknowledgements
We are grateful for the fruitful discussions with Prof. Yuliang Li from the Institute of Chemistry, Chinese Academy of Sciences (ICCAS). This work was supported by the National Nature Science Foundation of China (NSFC, Project No. 51503143 and 21476162), the Tianjin Natural Science Foundation (Project No. 16JCQNJC05000), the China International Science and Technology Projects (Project No. 2012DFG41980 and S2016G3413), the Innovation Foundation of Tianjin University (Project No. 2016XRX-0017), the Tianjin Science and Technology Innovation Platform Program (Project No. 14TXGCCX00017), the Netherlands Organization for Scientific Research (NWO) with the Veni Grant (Project no. 680-47-437), and the Tianjin 1000 Youth Talents Plan.Notes and references
- C. Wang, H. Dong, W. Hu, Y. Liu and D. Zhu, Chem. Rev., 2012, 112, 2208–2267 CrossRef CAS PubMed.
- Y. Ie, A. Uchida, N. Kawaguchi, M. Nitani, H. Tada, F. Kakiuchi and Y. Aso, Org. Lett., 2016, 18, 4320–4323 CrossRef CAS PubMed.
- M. M. Rothmann, S. Haneder, E. D. Como, C. Lennartz, C. Schildknecht and P. Strohriegl, Chem. Mater., 2010, 22, 2403–2410 CrossRef CAS.
- L. Yao, S. Zhang, R. Wang, W. Li, F. Shen, B. Yang and Y. Ma, Angew. Chem., Int. Ed., 2014, 53, 2119–2123 CrossRef CAS PubMed.
- Z. Li, G. He, X. Wan, Y. Liu, J. Zhou, G. Long, Y. Zuo, M. Zhang and Y. Chen, Adv. Energy Mater., 2012, 2, 74–77 CrossRef CAS.
- A. Facchetti, Chem. Mater., 2011, 23, 733–758 CrossRef CAS.
- J. Zhou, Y. Zuo, X. Wan, G. Long, Q. Zhang, W. Ni, Y. Liu, Z. Li, G. He, C. Li, B. Kan, M. Li and Y. Chen, J. Am. Chem. Soc., 2013, 135, 8484–8487 CrossRef CAS PubMed.
- H. Meier, Angew. Chem., Int. Ed., 2005, 44, 2482–2506 CrossRef CAS PubMed.
- S. R. Marder, Chem. Commun., 2006, 131–134 RSC.
- T. Michinobu, J. C. May, J. H. Lim, C. Boudon, J. P. Gisselbrecht, P. Seiler, M. Gross, I. Biaggio and F. Diederich, Chem. Commun., 2005, 737–739 RSC.
- R. Y. Lai, X. Kong, S. A. Jenekhe and A. J. Bard, J. Am. Chem. Soc., 2003, 125, 12631–12639 CrossRef CAS PubMed.
- A. W. Czarnik, Acc. Chem. Res., 1994, 27, 302–308 CrossRef CAS.
- Y. Liang, X. Xue, W. Zhang, C. Fan, Y. Li, B. Zhang and Y. Feng, Dyes Pigm., 2015, 115, 7–16 CrossRef CAS.
- C. Fan, B. Zhang, Y. Li, Y. Liang, X. Xue and Y. Feng, Phys. Chem. Chem. Phys., 2015, 17, 30624–30631 RSC.
- F. Lu, L. Qian, J. Cao, Y. Feng, B. Du and L. Ding, Polym. Chem., 2015, 6, 7373–7376 RSC.
- F. Lu, J. Zhang, Y. Zhou, Y. Zhao, B. Zhang and Y. Feng, Dyes Pigm., 2016, 125, 116–123 CrossRef CAS.
- Y. Zhou, N. A. Lee, K. T. Ngo, X. Peng, Y. Feng and J. Rochford, RSC Adv., 2015, 5, 41193–41202 RSC.
- M. Bendikov, F. Wudl and D. F. Perepichka, Chem. Rev., 2004, 104, 4891–4946 CrossRef CAS PubMed.
- B. Esembeson, M. L. Scimeca, T. Michinobu, F. Diederich and I. Biaggio, Adv. Mater., 2008, 20, 4584–4587 CrossRef CAS.
- M. Kivala and F. Diederich, Acc. Chem. Res., 2009, 42, 235–248 CrossRef CAS PubMed.
- M. Kivala, C. Boudon, J. P. Gisselbrecht, B. Enko, P. Seiler, I. B. Muller, N. Langer, P. D. Jarowski, G. Gescheidt and F. Diederich, Chem.–Eur. J., 2009, 15, 4111–4123 CrossRef CAS PubMed.
- T. Michinobu, C. Boudon, J. P. Gisselbrecht, P. Seiler, B. Frank, N. N. Moonen, M. Gross and F. Diederich, Chem.–Eur. J., 2006, 12, 1889–1905 CrossRef CAS PubMed.
- M. Kivala, C. Boudon, J. P. Gisselbrecht, P. Seiler, M. Gross and F. Diederich, Angew. Chem., Int. Ed., 2007, 46, 6357–6360 CrossRef CAS PubMed.
- W. Zhou, J. Xu, H. Zheng, X. Yin, Z. Zuo, H. Liu and Y. Li, Adv. Funct. Mater., 2009, 19, 141–149 CrossRef CAS.
- J. Xu, L. Wen, W. Zhou, J. Lv, Y. Guo, M. Zhu, H. Liu, Y. Li and L. Jiang, J. Phys. Chem. C, 2009, 113, 5924–5932 CAS.
- J. Xu, H. Zheng, H. Liu, C. Zhou, Y. Zhao, Y. Li and Y. Li, J. Phys. Chem. C, 2010, 114, 2925–2931 CAS.
- Y. Li, T. Liu, H. Liu, M. Z. Tian and Y. Li, Acc. Chem. Res., 2014, 47, 1186–1198 CrossRef CAS PubMed.
- T. Shoji, S. Ito, K. Toyota, M. Yasunami and N. Morita, Chem.–Eur. J., 2008, 14, 8398–8408 CrossRef CAS PubMed.
- J. Xu, X. Liu, J. Lv, M. Zhu, C. Huang, W. Zhou, X. Yin, H. Liu, Y. Li and J. Ye, Langmuir, 2008, 24, 4231–4237 CrossRef CAS PubMed.
- T. Michinobu, J. Am. Chem. Soc., 2008, 130, 14074–14075 CrossRef CAS PubMed.
- K. Tahara, T. Fujita, M. Sonoda, M. Shiro and Y. Tobe, J. Am. Chem. Soc., 2008, 130, 14339–14345 CrossRef CAS PubMed.
- J. Xu, S. Semin, D. Niedzialek, P. H. Kouwer, E. Fron, E. Coutino, M. Savoini, Y. Li, J. Hofkens, H. Uji-I, D. Beljonne, T. Rasing and A. E. Rowan, Adv. Mater., 2013, 25, 2084–2089 CrossRef CAS PubMed.
- M. Torres, S. Semin, I. Razdolski, J. Xu, J. A. W. Elemans, T. Rasing, A. E. Rowan and R. J. M. Nolte, Chem. Commun., 2015, 51, 2855–2858 RSC.
- J. Xu, S. Semin, J. Cremers, L. Wang, M. Savoini, E. Fron, E. Coutino, T. Chervy, C. Wang, Y. Li, H. Liu, Y. Li, P. Tinnemans, P. H. J. Kouwer, T. W. Ebbesen, J. Hofkens, D. Beljonne, A. E. Rowan and T. Rasing, Adv. Opt. Mater., 2015, 3, 948–956 CrossRef CAS.
- J. Xu, S. Semin, T. Rasing and A. E. Rowan, Small, 2015, 11, 1113–1129 CrossRef CAS PubMed.
- Y. Duan, C. Ju, G. Yang, E. Fron, E. Coutino-Gonzalez, S. Semin, C. Fan, R. S. Balok, J. Cremers, P. Tinnemans, Y. Feng, Y. Li, J. Hofkens, A. E. Rowan, T. Rasing and J. Xu, Adv. Funct. Mater., 2016, 26, 8968–8977 CrossRef CAS.
- G. Boudebs and S. Cherukulappurath, Phys. Rev. A, 2004, 69, 053813 CrossRef.
- M. Sheik-Bahae, A. A. Sald, T. H. Wei, D. J. Hagan and E. W. V. Strylang, IEEE J. Quantum Electron., 1990, 26, 760–769 CrossRef CAS.
- C. B. de Araújo, A. S. L. Gomes and G. Boudebs, Rep. Prog. Phys., 2016, 79, 036401 CrossRef PubMed.
- Y. Li, K. Yang, X. Zhang, Q. Chang, Y. Wang and Y. Song, Opt. Commun., 2008, 281, 3913–3918 CrossRef CAS.
- Y. Li, Y. Song, Y. Wang, X. Zhang, J. Sun, J. Yang, G. Shi and Y. Wang, Sci. China, Ser. E: Technol. Sci., 2008, 51, 1483–1490 CrossRef CAS.
- Y. Li, K. Yang, X. Zhang, Q. Chang, Y. Wang and Y. Song, Opt. Commun., 2008, 281, 3913–3918 CrossRef CAS.
- G. Boudebs and C. B. de Araújo, Appl. Phys. Lett., 2004, 85, 3740–3742 CrossRef CAS.
- P. Suppan and N. Ghoneim, Solvatochromism, Royal Society of Chemistry Cambridge, Cambridge, 1997 Search PubMed.
- W. Y. Paul, W. Ayers and A. L. J. Bartolotti, in Chemical Reactivity Theory: A Density Functional View, ed. P. K. Chattaraj, CRC Press, 2009, vol. 18, pp. 255–267 Search PubMed.
- A. Y. Tolbin, A. V. Dzuban, V. I. Shestow, Y. I. Gudkova, V. K. Brel, L. G. Tomilova and N. S. Zefirov, RSC Adv., 2015, 5, 8239–8247 RSC.
- Y. Zhang, Y. Shi and Y. Li, J. Mater. Sci.: Mater. Electron., 2016, 27, 7132–7140 CrossRef CAS.
- Y. Li, D. Qi, P. Song and F. Ma, Mater, 2015, 8, 42–56 CrossRef.
- Y.-L. Song, J. Yang, Y. Li, J. Gu and Y. Wang, CN101308091, 2008, vol. 19.
- X. Liu and Y. Tomita, Phys. Res. Int., 2012, 2012, 161572 Search PubMed.
- X. Liu, Y. Adachi, J. Oshima, T. Nakashima and T. Kawai, Opt. Express, 2012, 20, 13457 CrossRef CAS PubMed.
- G. Boudebs, S. Cherukulappurath, H. Leblond, J. Troles, F. Smektala and F. Sanchez, Opt. Commun., 2003, 219, 427–433 CrossRef CAS.
- S. Cherukulappurath, M. Guignard, C. Marchand, F. Smektala and G. Boudebs, Opt. Commun., 2004, 242, 313–319 CrossRef CAS.
- G. Boudebs and S. Cherukulappurath, Opt. Commun., 2005, 250, 416–420 CrossRef CAS.
- Y. Li, Y. Song, T. Wei, C. He, X. Zhang, Y. Wang, K. Yang, M. Shen and J. Yang, Appl. Phys. B, 2008, 91, 119–122 CrossRef CAS.
Footnotes |
| † Electronic supplementary information (ESI) available: Detailed synthesis and characterization of (TCNQ)2OPV3 and NLO measurement of the solvent. See DOI: 10.1039/c6ra25408j |
| ‡ This new system is not propitious to measure films materials with surface inhomogeneities because the reference facula does not include the imperfect information of the materials.55 |
| This journal is © The Royal Society of Chemistry 2017 |


