 Open Access Article
Creative Commons Attribution 3.0 Unported Licence
Highly sensitive and selective complexation based voltammetric methods for the analysis of rabeprazole sodium in real samples†
Pakinaz Y. Khashabaab,
Hassan Refat H. Alia and
Mohamed M. El-Wekil *a
*a
aDepartment of Pharmaceutical Analytical Chemistry, Faculty of Pharmacy, Assiut University, Egypt. E-mail: mohamed.mohamoud@ymail.com
bDepartment of Pharmaceutical Analytical Chemistry, Faculty of Pharmacy, Deraya University, El-Minya, Egypt
First published on 13th January 2017
Abstract
The effect of adding transition metals to the electrolyte containing proton pump inhibitors, such as rabeprazole sodium (RAB sodium), on the voltammetric response of pencil graphite electrode was studied. Both square-wave adsorptive stripping voltammetry (SWAdSV) and cyclic voltammetry (CV) were utilized to elucidate and confirm the possible complexation reaction that could occur between RAB sodium and cobalt as a transition metal. The current signal due to the oxidation process was a function of the concentration of RAB sodium, pH of the medium, cobalt concentration, scan rate, frequency, and deposition time at the electrode surface. This phenomenon could be used for the determination of RAB sodium using CV and SWAdSV. The oxidation peak current linearly varied with the concentration over the range of 0.05–9 × 10⁻⁹ M and 0.2–8.5 × 10⁻⁷ M for SWAdSV and CV, respectively. The limits of detection were found to be 0.015 × 10⁻⁹ M and 0.06 × 10⁻⁷ M for SWAdSV and CV, respectively. The validity of using these methods for the determination of RAB sodium in its pharmaceutical formulation and human urine samples was evaluated.
1. Introduction
Rabeprazole sodium is a member of proton pump inhibitor antiulcer drugs. It is a benzimidazole derivative that is used in the treatment of peptic ulcers and reflux esophagitis.1 Its efficacy as an antiulcer and antisecretory agent has been well established. Previously, different analytical techniques, such as spectrophotometry,2–4 spectrofluorometry,5 thin layer chromatography,2 and high performance liquid chromatography,2,6–10 have been used to determine RAB sodium. These techniques usually require complicated sample pretreatment, which is laborious and time-consuming. To date, only two electrochemical methods4,11 have been reported for the determination of RAB sodium in the bulk powder and tablets using a hanging mercury electrode and glassy carbon electrode. The first electrode is unsafe and has toxic effects, whereas the second electrode usually requires several pretreatment procedures prior to use.Voltammetry has been widely used for the investigation of redox reactions and analysis of organic or inorganic substances using various available electrodes. Due to their low background current, wide potential window, chemical inertness, low-cost, and suitability for various sensing and detection applications, several forms of carbon electrodes are available for electroanalytical applications.12–14 Among these, pencil graphite electrode (PGE) is one of the key electrodes that has been applied to cathodic or anodic stripping voltammetry for the detection of trace metals,15 DNA,16,17 immunoassay,18 and certain pharmaceuticals.19 The utilization of pencil leads as electrodes is well documented.20–27 The pencil “lead” is actually a mixture of graphite, wax, and clay, the proportions of which impart different properties to the pencil with the increasing amounts of clay making the pencil harder, hence the designation ‘H’. Increasing levels of graphite make the pencil softer and their marks darker or black and so the designation ‘B’. For example, one of the darkest generally available pencils, the 6B, is 84% graphite, 10% clay, and 5% wax, compared to the common lighter HB or No. 2 pencil, which has a composition of 68% graphite, 26% clay, and 5% wax.28 Commonly, pencil has been directly used as the working electrode itself;20–27 however, only recently, the possibility of using pencils to draw electrodes onto a suitable substrate has been reported.29 This type of electrode offers high electrochemical reactivity, high electrical conductivity, good mechanical rigidity, low-cost, simple technology, ease of modification, renewable, low background current, and miniaturization. This type of electrode has a larger active surface area and is, therefore, able to detect low concentrations of the analyte.
The use of metal complexation was effective in increasing the hydrophobicity of the drug in the bulk solution and hence increasing the attraction to the electrode surface.30 Thus, the aim of the current study was to develop simple, sensitive, and reproducible complexation based methods to quantify the cited drug in its pharmaceutical formulation and spiked human urine for the first time.
2. Experimental
2.1. Pharmaceuticals
RAB sodium was supplied as a gift from Global Napi, 6th October city, Giza, Egypt. Rabicid® tablets (Sigma, Quesna, El-Menoufia, Egypt) were labeled to contain 40 mg RAB sodium. Domperidone was supplied as a gift from EIPICO, 10th Ramadan city, El-Sharquia, Egypt. Aceclofenac, tinidazole, and clarithromycin were obtained as gifts from NODCAR, El-Giza, Egypt. Doxycycline was supplied as a gift from CID, Assiut, Egypt.2.2. Reagents
Methanol was purchased from Fisher Scientific Limited, United Kingdom. Double distilled water was used throughout this work. Cobalt nitrate, ferric chloride, nickel sulphate, copper sulphate, and uric acid were purchased from Sigma-Aldrich co. Ltd., Steinheim, Germany. Glacial acetic acid, phosphoric acid, boric acid, and ascorbic acid were purchased from El Nasr Pharmaceutical Chemicals Co., Egypt.Britton–Robinson buffer (B.R.) was used as a supporting electrolyte (equal volumes of 0.04 M acetic acid, 0.04 M phosphoric acid, and 0.04 M acetic acid, adjusted to a desired pH by 2 N NaOH).
2.3. Instrumentation
A Princeton VersaSTAT MC (VersaSTAT 3, Model RE-1, Princeton Applied Research, AMETEK, USA) connected to a three-electrode cell was used for the electrochemical measurements. In all the measurements, the reference electrode was Ag/AgCl (3 M KCl), the auxiliary electrode was a platinum wire, and the working electrode was a PGE. A Pentel pencil, Model P205 (Japan), was used as a holder for the pencil lead. Electrical contact with the lead was achieved by soldering a metallic wire to the metallic part that holds the lead in place inside the pencil. Unless stated otherwise, the pencil was fixed such that about 3 mm of its length was immersed in the solution. Measurements were performed in a 10 mL glass cell containing 6 mL of the supporting electrolyte solution. Stirring was achieved with a magnetic stirring bar.The pH values of the solutions were measured using a Hanna pH meter (Hanna Instruments Brazil, São Paulo, Brazil) with a combined electrode. The solutions were sonicated using a Bransonic ultrasonic cleaner, Branson UL Transonics Corporation, Eagle Road, Danbury, CT 06813, USA. Shimadzu UV-vis Spectrophotometer, UV-1800 was used to assess the complexation between RAB sodium and cobalt.
2.4. Preparation of the standard solutions
The standard stock solution of RAB sodium (1 × 10⁻³ M) was prepared by dissolving an accurate amount of RAB sodium in double distilled water. The stock solution was stable when stored in a refrigerator at 4 °C for about 2 months.2.5. Sample preparation
The contents of ten tablets were accurately weighed, finely powdered, and thoroughly mixed in a mortar. Portions equivalent to about 1 × 10⁻³ M of RAB sodium were accurately weighed and dissolved in a 20 mL methanol. The contents were sonicated for 20 minutes to ensure complete solubility. The filtrate was transferred to a 100 mL calibrated flask and diluted to a final volume with double distilled water. Appropriate working solutions were prepared by taking suitable aliquots from these stock solutions and diluting them with the B.R. buffer solutions (pH = 7.0).Drug-free human urine samples were obtained from two healthy and non-smoking volunteers of different age and sex (after obtaining their written consent). The samples were stored in the refrigerator (−20 °C) and analyzed on the next day after collection without any further pretreatment. One milliliter of the corresponding urine sample was pipetted into a 25 mL calibrated flask and filled with the buffer solution to the mark. The experimental protocol was conducted according to the Egyptian regulations and approved by the Institutional Human Ethics Committee, Assiut University, Assiut, Egypt. Informed consents were obtained from the human participants for this study.
2.6. General procedure
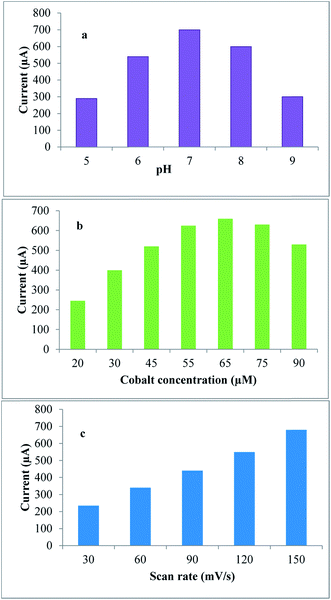
The PGE surface was polished and pretreated by applying a potential of +1.30 V for 30 s in the blank supporting electrolyte without stirring to increase the hydrophilic properties of the electrode surface via the introduction of oxygenated functionalities. Each measurement was performed using a new pencil surface in a glass cell containing 6 mL of B.R. buffer (pH = 7.0). The SWAdSV and CV were obtained after the addition of drug and 65 μM cobalt nitrate.The optimum conditions for CV were found to be the adsorption time = 300 seconds, adsorption potential = 0 V, and scan rate = 150 mV s−1, whereas those for SWAdSV were found to be the adsorption potential = −0.4 V, frequency = 300 Hz, step potential = 10 mV, and potential amplitude = 60 mV.
3. Results and discussions
3.1. Electrochemical characterization of the PGE using standard potassium ferricyanide system
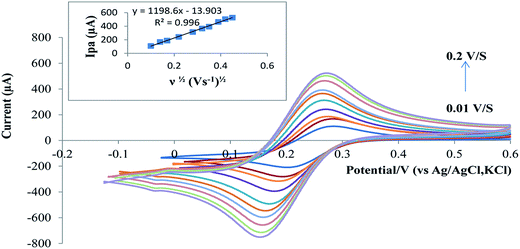
Prior to voltammetric analysis, the PGE was evaluated. The CV was obtained using PGE wetted with 0.5 M KCl, where no voltammetric peaks were obtained. Thus, no electroactive interfering species were appreciably released by all graphite sticks. Furthermore, the CV was obtained again after wetting PGE with a 10 mM potassium ferricyanide in a 0.5 M KCl, where a redox peak potential difference was obtained as 75 mV. This shows the electroactivity of the PGE.Randles–Sevcik equation for a reversible process31 was used to estimate the effective surface area of the PGE (Aeff mm2) immersed in a 10 mM potassium ferricyanide and a 0.5 M KCl.
| Ipa = (2.69 × 10⁵)n2/3AeffD1/2ν1/2C0 |
3.2. Investigation of the electrochemical behavior of RAB sodium using CV and SWAdSV
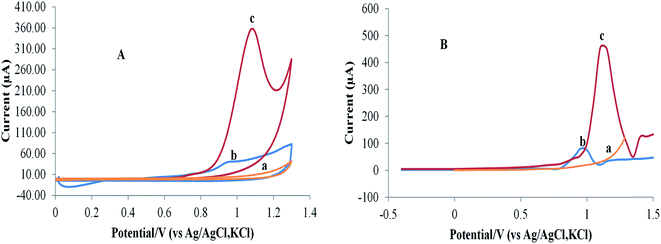
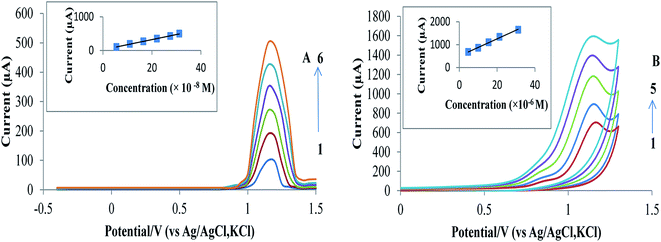
The electrochemical behavior of RAB–cobalt complex was investigated using three different types of carbon-based electrodes: bare glassy carbon electrode (GCE), carbon paste electrode (CPE), and pencil graphite electrode (PGE). The best results were obtained with PGE (Fig. 1S†).The CV and SWAdSV are presented in Fig. 2A and B, respectively. The CV of RAB sodium has displayed only a sole well irreversible anodic peak at +1.15 V, which suggests that the oxidation of RAB sodium is irreversible.
3.3. Parameters affecting the electrochemical oxidation process
where, Q is the peak area that could be obtained under a given scan rate, ν is the scan rate, and F, R and T are the constants. From the slope of Ip vs. ν, the electron-transfer number (n) that was involved in the electrode reaction of RAB sodium was calculated to be 2.
4. Method validation
4.1. Linearity, LOD, and LOQ
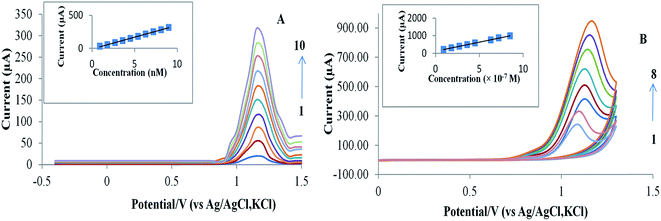
Fig. 4A and B for the proposed SWAdSV and CV methods, respectively, show linear calibration plots over the concentration range under the optimal conditions. Table 1 shows good values for the correlation coefficient (r) with a small intercept and a small value of the standard deviation and % relative standard deviation that indicate high accuracy and precision of the proposed methods. The limits of detection (LOD) and quantitation (LOQ) were calculated using the following equations:33 LOD = 3.3s/S, and LOQ = 10s/S, where “s” is the mean of standard deviation of the intercept and “S” is the mean of the slope of the calibration curve. The LOD and LOQ are presented in Table 1. Obviously, the values of LOD and LOQ indicate that the SWAdSV and CV are very sensitive for the RAB sodium analysis.| Parameters | CV | SWAdSV |
|---|---|---|
| a Average of five replicates.b Concentration in SWAdSV expressed as 10−9 M, whereas that in CV expressed as 10−7 M. | ||
| Measured potential (volts) | 1.15 | 1.15 |
| Linearityb | 0.9–8.5 | 0.9–9.0 |
| Correlation coefficient (r ± SDa) | 0.9995 ± 0.001 | 0.9994 ± 0.009 |
| Intercept (±SDa) | 125.4 ± 1.9 | −9.0 ± 0.2 |
| Slope (±SDa) | 102.6 ± 1.1 | 35.6 ± 0.6 |
| LODb | 0.061 | 0.015 |
| LOQb | 0.185 | 0.045 |
4.2. Accuracy and precision
The accuracy of the method was determined by standard addition method and calculating the recovery percentages. Moreover, the results of the inter-day and intra-day precision prove the precision of the proposed methods (Table 2).| Voltammetric method | Standard addition method | Precision | ||||
|---|---|---|---|---|---|---|
| Amount addeda | Found ± SDb | % recovery ± SDb | Amount takena | Inter-day | Intra-day | |
| a Concentration in SWAdSV expressed as 10−9 M, whereas that in CV expressed as 10−7 M.b Average of five replicates. | ||||||
| CV | 3 | 4.1 | 102.8 ± 1.0 | 2 | 98.7 ± 1.2 | 100.2 ± 1.9 |
| 4 | 4.8 | 97.6 ± 1.9 | 4 | 101.0 ± 1.3 | 102.9 ± 2.1 | |
| 5 | 6.0 | 101.5 ± 1.7 | 6 | 98.3 ± 1.1 | 100.9 ± 1.6 | |
| SWAdSV | 3 | 3.9 | 98.3 ± 1.4 | 2 | 100.2 ± 1.4 | 100.3 ± 1.0 |
| 4 | 5.1 | 101.6 ± 1.5 | 4 | 102.3 ± 1.1 | 101.2 ± 1.5 | |
| 5 | 5.8 | 97.2 ± 1.5 | 6 | 98.4 ± 0.5 | 100.3 ± 0.7 | |
4.3. Selectivity of the proposed method
The effects of common excipients, co-administered drugs, biologically active compounds, and divalent metals have been evaluated (Table 3). Clearly, a % signal change of 6.5 × 10⁻⁹ M RAB sodium upon the addition of these potential interfering substances does not appreciably change. This could indicate the selectivity of the method and hence its suitability for the determination of pharmaceuticals in the complex matrices.| Common excipients | Biological active substances | Co-administered drugs | Divalent metals | ||||
|---|---|---|---|---|---|---|---|
| Amount (1 mM) | % signal change | Amount (1 mM) | % signal change | Amount (20 μM) | % signal change | Amount (0.3 μM) | % signal change |
| Starch | 3.54 | Ascorbic acid | 3.45 | Domperidone | 6.34 | Manganese | 4.33 |
| Glucose | 3.02 | Uric acid | 4.21 | Aceclofenac | 2.34 | Nickel | 5.22 |
| Gum acacia | 4.34 | Dopamine | 2.06 | Metronidazole | 0.09 | Copper | 9.89 |
| Lactose | 4.98 | Clarithromycin | 1.34 | Cadmium | 6.55 | ||
| Citric acid | 3.22 | Doxycycline | 3.24 | Zinc | 8.19 | ||
| Chromium | 6.88 | ||||||
4.4. Application of the proposed methods to real samples
The proposed methods were applied for the determination of RAB sodium in the tablets using standard addition method (Table 2). The urine samples were collected from two healthy and non-smoking volunteers of different age and sex. The samples were analyzed by the proposed methods after simple dilution with B.R. buffer (pH = 7.0). The average results of the three measurements, expressed as a confidence interval for 95% probability for two volunteers, obtained by the proposed methods are summarized in Tables 1S and 2S.† As an illustrative example of the analysis of the model human urine sample, the obtained voltammograms for volunteer A are depicted in Fig. 5A and B.5. UV-visible study
Fig. 7S† shows the effect of cobalt nitrate on the spectrum of RAB sodium. The shift in the wavelength indicates the presence of possible complexation reaction between RAB sodium and cobalt.To increase the analytical performance of the proposed methods, a comparison with other reported methods was conducted (Table 4). Clearly, the proposed methods are simple with more sensitive results in terms of LOD and LOQ than those of the reported methods.
| Reported methods | Linear range (μg mL−1) | LOD (μg mL−1) | LOQ (μg mL−1) | Reference |
|---|---|---|---|---|
| Spectrophotometry | 10–30 | 0.019 | 0.058 | 2 |
| 5–40 | 0.19 | 0.57 | 3 | |
| 4.5–40 | — | — | 4 | |
| Spectrofluorometry | 10–85 | 2.99 | 9.07 | 5 |
| HPTLC | 0.5–2.5 | 0.1 | 0.31 | 2 |
| HPLC | 4–20 | 0.025 | 0.076 | 2 |
| 0.02–1.5 | — | 0.02 | 6 | |
| 0.00015–0.1 | — | — | 7 | |
| 0.00014–0.096 | — | — | 8 | |
| 0.02–1 | — | — | 9 | |
| 0.001–0.5 | — | — | 10 | |
| Polarography | 0.6–8 | — | — | 4 |
| SWV | 0.3–9 | — | — | |
| DPV | 1–20 | 0.4 | 1.0 | 11 |
| SWV | 0.9–9.0 × 10⁻⁹ M | 0.015 × 10⁻⁹ M | 0.045 × 10⁻⁹ M | The present work |
| CV | 0.9–8.5 × 10⁻⁷ M | 0.061 × 10⁻⁷ M | 0.185 × 10⁻⁷ M |
6. Reaction mechanism
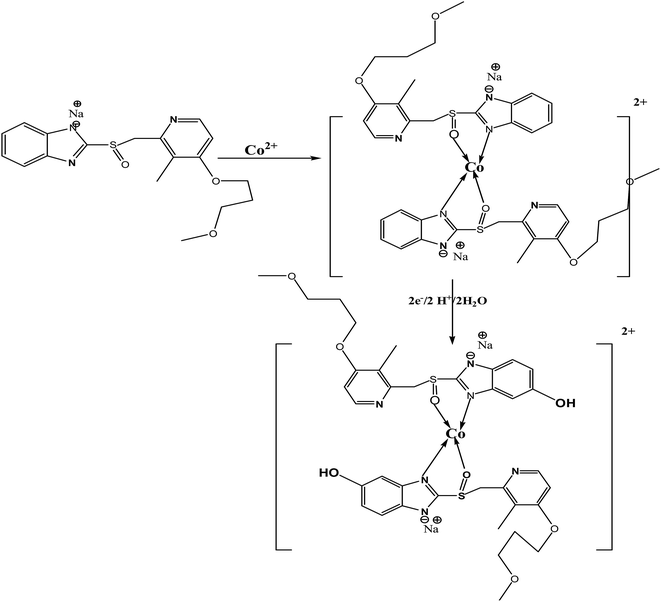
The suggested electrochemical oxidation of the studied RAB sodium by CV and SWAdSV is described in Scheme 1. This is based on the electrochemical data described and supported by the RAB sodium structure; first, a coordinate complex between RAB sodium and cobalt form, and then loss of an electron likely occurs on the aromatic ring, where the extent of conjugation is greater, making the removal of an electron easier. One electron is removed from one molecule, followed by deprotonation to produce a cation radical, which reacts with water and leads to the formation of the hydroxylated species.34,357. Conclusion
In this study, a pencil graphite electrode was applied for the first time as a sensitive electrochemical sensor for the direct determination of RAB sodium. Cyclic voltammetry and square-wave adsorptive voltammetry were used for the deeper investigation of the electrochemical behavior of RAB sodium and its quantification in the tablet dosage form and spiked human urine samples. Clearly, the proposed electroanalytical methods are considerably time saving, economical, and highly sensitive without any chemical modification of the electrode surface. The method is sufficiently selective because the common excipients and urine constituents did not interfere with the sensing capabilities under these conditions. This simple, rapid, and inexpensive procedure could be a good alternative to other analytical approaches for the pharmacokinetic and pharmacodynamic purposes and effective determination of RAB sodium in the biological samples. Considering the results obtained in this study, the PGE may find future applications as a sensitive electrochemical sensor in the drug analysis.Notes and references
- G. L. Patrick, An introduction to Medicinal Chemistry, Oxford, USA, 4th edn, 2009, vol. 25, pp. 653–680 Search PubMed.
- A. El-Gindy, F. El-Yazby and M. M. Maher, J. Pharm. Biomed. Anal., 2003, 31, 229–242 CrossRef CAS PubMed.
- M. E. El-Kommos, P. Y. Khashaba and M. M. El-Wekil, Asian J. Biomed. Pharm. Sci., 2013, 3, 31 CAS.
- M. A. S. Moneeb, Pak. J. Pharm. Sci., 2008, 21, 214–224 CAS.
- M. E. El-Kommos, P. Y. Khashaba and M. M. El-Wekil, Int. J. Pharm. Pharm. Sci., 2014, 6, 212 Search PubMed.
- M. Noubarani, F. Keyhanfar, M. Motevalian and M. Mahmoudian, J. Pharm. Pharmaceut. Sci., 2010, 13, 1–10 CAS.
- E. Simpemba, R. Liu, C. Sun, J. Engelbert and A. L. Ding, J. Sep. Sci., 2014, 37, 1951–1956 CrossRef CAS PubMed.
- C. Lua, Y. Jiaa, Y. Songa, X. Lia, Y. Suna, J. Zhaoa, S. Wanga, L. Shic, A. Wena and L. Dingb, J. Chromatogr. B: Anal. Technol. Biomed. Life Sci., 2015, 988, 75–80 CrossRef PubMed.
- N. V. S. Ramakrishna, K. N. Vishwottam, S. Wishu, M. Koteshwara and S. Suresh Kumar, J. Chromatogr. B: Anal. Technol. Biomed. Life Sci., 2005, 816, 209–214 CrossRef CAS PubMed.
- T. Uno, N. Y. Furukori, M. Shimizu, K. Sugawara and T. Tateishi, J. Chromatogr. B: Anal. Technol. Biomed. Life Sci., 2005, 824, 238–243 CrossRef CAS PubMed.
- A. Radi, N. Abd El-Ghany and T. Wahdan, Il Farmaco, 2004, 59, 515–518 CrossRef CAS PubMed.
- R. L. McCreery, Carbon electrodes: structural effects on electron transfer kinetics, in Electroanalytical Chemistry, ed. A. J. Bard, Marcel Dekker, New York, 1991, p. 18 Search PubMed.
- K. Kalcher, J. M. Kauffmann, J. Wang, I. Svancara, K. Vytrans, C. Neuhold and Z. Yang, Electroanalysis, 1995, 7, 5–22 CrossRef CAS.
- M. E. Rice, Z. Galus and R. N. Adams, J. Electroanal. Chem., 1983, 143, 89–102 CrossRef CAS.
- D. Blum, W. Leyffer and R. Holze, Electroanalysis, 1996, 8, 296–297 CrossRef CAS.
- H. Karademiz, B. Gulmez, F. Sadinci, A. Erdem, G. I. Kaya, N. Uncer, B. Kivcak and M. Ozsoz, J. Pharm. Biomed. Anal., 2003, 33, 295–301 CrossRef.
- J. Wang and A. N. Kawde, Anal. Chim. Acta, 2001, 431, 219–224 CrossRef CAS.
- L. Engel and W. Baumann, Fresenius' J. Anal. Chem., 1993, 346, 745–751 CrossRef CAS.
- P. Masawat, S. Liawruangrath, Y. Vaneesorn and B. Liawruangrath, Talanta, 2002, 58, 1221–1234 CrossRef CAS PubMed.
- A. M. Bond, P. J. Mahon, J. Schiewe and V. Vicente-Beckett, Anal. Chim. Acta, 1997, 345, 67–74 CrossRef CAS.
- D. King, J. Friend and J. Kariuki, J. Chem. Educ., 2010, 87, 507–509 CrossRef CAS.
- J. K. Kariuki, J. Electrochem. Soc., 2012, 159, 747–751 CrossRef.
- N. Chauhan, J. Narang and C. Pundir, Am. J. Anal. Chem., 2010, 2, 41–46 CrossRef.
- D. Demetriades, A. Economou and A. Voulgaropoulos, Anal. Chim. Acta, 2004, 519, 167–172 CrossRef CAS.
- K. Pokpas, S. Zbeda, N. Jahed, N. Mohamed, P. G. Baker and E. I. Iwuoha, Int. J. Electrochem. Sci., 2014, 9, 736–759 Search PubMed.
- M. Vestergaard, K. Kerman and E. Tamiya, Anal. Chim. Acta, 2005, 538, 273–281 CrossRef CAS.
- Y. W. Hartati, S. Topkaya, I. P. Maksum and M. Ozsoz, Advances in Analytical Chemistry, 2013, 3, 20–27 Search PubMed.
- M. Cousta Sousa and J. W. Buchanan, Comput. Graph. Forum, 2000, 19, 27–49 Search PubMed.
- N. Kurra and G. U. Kulkarni, Lab Chip, 2013, 13, 2866–2873 RSC.
- P. Y. Khashaba, H. R. H. Ali and M. M. El-Wekil, Electroanalysis, 2016 DOI:/10.1002/elan.201600639.
- A. J. Bard and L. R. Faulkner, Electrochemical Methods, Fundamentals and Applications, Wiley, New York, 1980 Search PubMed.
- E. Laviron, J. Electroanal. Chem., 1979, 10, 19–28 CrossRef.
- J. C. Miller and J. N. Miller, Statistics for analytical chemistry. Ellis Horwood Series, PTR Prentice Hall, New York, London, pp. 119–121 Search PubMed.
- F. Salama, N. El-Abasawy, S. A. Abdel Razeq, M. M. F. Ismail and M. M. Fouad, J. Pharm. Biomed. Anal., 2003, 33, 411–421 CrossRef CAS PubMed.
- S. M. A. Jorge, A. D. R. Pontinha and A. M. Oliveira-Bretta, Electroanalysis, 2010, 22, 625 CrossRef CAS.
Footnote |
| † Electronic supplementary information (ESI) available. See DOI: 10.1039/c6ra25565e |
| This journal is © The Royal Society of Chemistry 2017 |

