 Open Access Article
Enhanced thermal conductivity of nanofluid-based ethylene glycol containing Cu nanoparticles decorated on a Gr–MWCNT hybrid material†
Pham Van Trinh*a,
Nguyen Ngoc Anha,
Bui Hung Thanga,
Le Dinh Quanga,
Nguyen Tuan Hongb,
Nguyen Manh Hongc,
Phan Hong Khoib,
Phan Ngoc Minhabc and
Phan Ngoc Hong*ac
aInstitute of Materials Science, Vietnam Academy of Science and Technology, 18 Hoang Quoc Viet Str., Cau Giay Distr., Hanoi, Vietnam. E-mail: trinhpv@ims.vast.vn; hongpn@ims.vast.ac.vn; Tel: +84 94 3190301
bCenter for High Technology Development, Vietnam Academy of Science and Technology, 18 Hoang Quoc Viet Str., Cau Giay Distr., Hanoi, Vietnam
cGraduated University of Science and Technology, Vietnam Academy of Science and Technology, 18 Hoang Quoc Viet Str., Cau Giay Distr., Hanoi, Vietnam
First published on 23rd December 2016
Abstract
In this study, nanofluid based ethylene glycol (EG) containing Cu nanoparticles decorated on a Gr–MWCNT hybrid material (Gr–MWCNT/Cu) was synthesized successfully for the first time via a chemical reduction method. The SEM, HRTEM, FTIR and XRD studies revealed that Cu nanoparticles with an average diameter of 18 nm were well decorated on the surface of both MWCNTs and graphene sheets. The nanofluids containing Gr–MWCNT/Cu material showed good stability and a maximum thermal conductivity enhancement of 41% at 60 °C for the nanofluid containing 0.035 vol% material compared to EG alone. The enhancement is due to the combination of the high thermal conductivity of graphene, CNT and Cu nanoparticles as well as the higher surface area of the Gr–MWCNT/Cu hybrid structure. Experimental results of thermal conductivity were evaluated using different theoretical models, amongst which the Hamilton–Crosser model was found suitable for predicting the thermal conductivity of the nanofluid.
1. Introduction
Currently, modern electronic devices integrated in numerous nano-sized components normally generate a large amount of heat while operating, which leads to the deterioration of performance or even destruction of the structure of the device. Therefore, reducing the working temperature is a key step to improve the performance and help these devices to be operated at high power for a long time. Among the several proposed heat transfer solutions, heat transfer fluids have been receiving great attention from scientists, engineers and manufacturers, etc. due to both cost-effectiveness and fast heat exchange.1 Conventional fluids such as water, ethylene glycol (EG), oil, etc., are usually used as heat transfer fluids. However, they have not shown sufficient capability to be employed in devices working at high power due to their poor thermal performance. Several attempts have been made to improve the heat transfer ability of conventional fluids. By adding solid particles into fluid, the thermal transfer performance could be enhanced2,3 and, recently, a new class of fluids, called nanofluids (NFs), containing nano-sized particles, such as Ag, Cu, Ni Al2O3, Fe3O4, CuO, TiO2, have shown even shown better thermal transfer performance.4,5 Since the discovery of carbonaceous materials with very high thermal conductivity, such as carbon nanotubes (CNT), graphene, graphene oxide (GO),6 several hundred studies concerning carbonaceous materials-based NFs have been conducted and presented.7–12 These demonstrate that a significant thermal conductivity enhancement of NFs was obtained both in theoretical and in experimental studies. In addition, graphene decorated by metallic or ceramic particles for nanofluid application has also been presented. Baby and Sundara reported that using silver nanoparticles and copper oxide decorated on graphene sheets for EG based nanofluids can show a thermal conductivity enhancement of up to 14% and 23%, respectively, compared with EG-based fluid.13,14 Recently, graphene–CNT hybrid material has been successfully synthesized and is found to exhibit great promise for several applications.15–17 In the hybrid structure, CNTs not only act as pillars in between the graphene sheets and avoid the stacking of graphene sheets, but also increase the total surface area. The advantage of this structure is that it helps improve the properties, such as electrical conductivity, thermal conductivity and mechanical strength, of the hybrid material.14 Baby et al. reported that using the Gr–CNT hybrid material decorated with silver (Ag) nanoparticles could improve the thermal conductivity of the nanofluid.18 However, silver (Ag) is quite expensive, and hence it is difficult to prepare the nanofluid for the industrial applications cost-effectively. In this context, copper (Cu) could be a promising material for replacing Ag due to Cu being cheaper than Ag and having high thermal conductivity. To the best of our knowledge, there is no study yet reported on the enhanced thermal conductivity of nanofluid-based ethylene glycol using Cu nanoparticles decorated on Gr–CNT hybrid material (Gr–CNT/Cu) as a heat transfer solution.Thus, in this study, we present the synthesis of Cu nanoparticles decorated on a Gr–MWCNT hybrid material via a chemical reduction technique and application of this material in EG as a nanofluid. The thermal conductivity of the obtained nanofluids has been characterized via the thermal hot plate (THP) method and compared with theoretical models.
2. Experimental procedure
2.1. Materials
Graphite rods with 99.99% purity purchased from Sigma-Aldrich were used as electrodes to synthesize graphene sheets. Multi-walled carbon nanotubes (MWCNTs) with an average diameter of around 20 nm and 10 μm in length were produced by a chemical vapor deposition (CVD) process using Fe/CaCO3 as the catalytic material.19 Ethylene glycol (EG, 98%) supplied by Xilong Chemical Co., Ltd. (China) was used as the base fluid. Sulphuric acid (H2SO4, 98%) and nitric acid (HNO3, 68%) supplied by Xilong Chemical Co., Ltd. (China) were used for the functionalization process. Copper(II) sulfate pentahydrate salt (CuSO4·5H2O, 99.5%) purchased from Shanghai Aladdin Bio-Chem Technology Co., Ltd. (China) was used as a precursor for synthesizing copper nanoparticles. Sodium borohydride (NaBH4, 99%) and ascorbic acid (98%) purchased from Shanghai Aladdin Bio-Chem Technology Co., Ltd. (China) were used as reducing and antioxidant agent. Sodium hydroxide (NaOH, >98%, Xilong Chemical Co., Ltd. (China)) was used to control the pH. Tetrahydrofuran (THF) and ethanol purchased from Xilong Chemical Co., Ltd. (China) were used to clean the samples.2.2. Nanofluid preparation
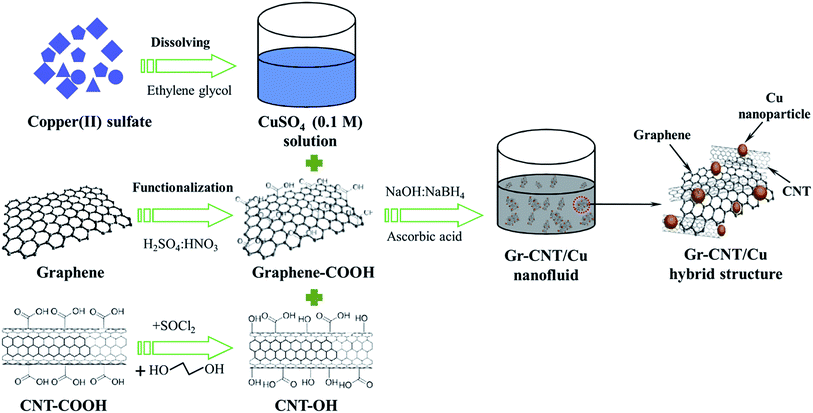
A schematic synthesis of the nanofluid is depicted in Fig. 1. First, graphene sheets synthesized by a plasma-assisted electrochemical exfoliation process20 were functionalized with carboxyl groups (–COOH) via treatment in the mixture of acids (HNO3![[thin space (1/6-em)]](https://www.rsc.org/images/entities/char_2009.gif) :
:![[thin space (1/6-em)]](https://www.rsc.org/images/entities/char_2009.gif) H2SO4, 1
H2SO4, 1![[thin space (1/6-em)]](https://www.rsc.org/images/entities/char_2009.gif) :
:![[thin space (1/6-em)]](https://www.rsc.org/images/entities/char_2009.gif) 3) at 70 °C for 5 h under continuous magnetic stirring, cleaned by distilled water and dispersed in EG by ultrasonication for 30 min to make Gr–COOH solution with concentration of 0.3 g L−1. A typical process for MWCNT–OH preparation was presented in an earlier report.21 MWCNTs were functionalized with carboxyl groups (–COOH) by treatment in the mixture of acids (HNO3
3) at 70 °C for 5 h under continuous magnetic stirring, cleaned by distilled water and dispersed in EG by ultrasonication for 30 min to make Gr–COOH solution with concentration of 0.3 g L−1. A typical process for MWCNT–OH preparation was presented in an earlier report.21 MWCNTs were functionalized with carboxyl groups (–COOH) by treatment in the mixture of acids (HNO3![[thin space (1/6-em)]](https://www.rsc.org/images/entities/char_2009.gif) :
:![[thin space (1/6-em)]](https://www.rsc.org/images/entities/char_2009.gif) H2SO4, 1
H2SO4, 1![[thin space (1/6-em)]](https://www.rsc.org/images/entities/char_2009.gif) :
:![[thin space (1/6-em)]](https://www.rsc.org/images/entities/char_2009.gif) 3) at 70 °C for 5 h, then cleaned by distilled water and dried in a vacuum for 24 h. Dried MWCNTs–COOH were suspended in SOCl2 solution and stirred for 6 h at 60 °C to obtain MWCNTs–COCl. The solution was filtered, washed with THF and distilled water. The MWCNT–COCl powder obtained after the cleaning process was mixed with EG and stirred for 8 h at 120 °C. After treatment with EG, the solution was cleaned using THF and distilled water. The obtained powder was dispersed in EG via ultrasonication for 30 min to prepare MWCNT–OH solution with a concentration of 0.3 g L−1. The Gr–MWCNT hybrid material solution with 1
3) at 70 °C for 5 h, then cleaned by distilled water and dried in a vacuum for 24 h. Dried MWCNTs–COOH were suspended in SOCl2 solution and stirred for 6 h at 60 °C to obtain MWCNTs–COCl. The solution was filtered, washed with THF and distilled water. The MWCNT–COCl powder obtained after the cleaning process was mixed with EG and stirred for 8 h at 120 °C. After treatment with EG, the solution was cleaned using THF and distilled water. The obtained powder was dispersed in EG via ultrasonication for 30 min to prepare MWCNT–OH solution with a concentration of 0.3 g L−1. The Gr–MWCNT hybrid material solution with 1![[thin space (1/6-em)]](https://www.rsc.org/images/entities/char_2009.gif) :
:![[thin space (1/6-em)]](https://www.rsc.org/images/entities/char_2009.gif) 1 volume fraction ratio of Gr and MWCNT was prepared by mixing the Gr–COOH and MWCNT–OH solutions.
1 volume fraction ratio of Gr and MWCNT was prepared by mixing the Gr–COOH and MWCNT–OH solutions.
To prepare Gr–MWCNT/Cu hybrid material, a desired amount of CuSO4 (0.1 M) solution was added into the Gr–MWCNT hybrid solution under continuous stirring to get 4 vol% Cu loading. After 30 min, a solution of ascorbic acid (0.1 M) was added into a solution of Gr–MWCNT/Cu2+ under strong stirring for 30 min. After that, a reducing solution containing a mixture of NaBH4 and NaOH was added to the previous solution. After completion of the reduction process, the solution was filtered and washed with distilled water. Calculated amounts of Gr–MWCNT/Cu were dispersed in ethylene glycol by ultrasonication for 45 min under ice water to obtain nanofluids with different concentration of 0.005, 0.015, 0.025 and 0.035 vol%. The samples were denoted NF1, NF2, NF3 and NF4 corresponding to nanofluids containing 0.005, 0.015, 0.025 and 0.035 vol% of Gr–MWCNT/Cu hybrid material concentration, respectively.
2.3. Characterization
The morphology of the samples was characterized by field emission scanning electron microscopy (FESEM, Hitachi S4800) and high resolution transmission electron microscopy (HRTEM, Jeol JEM 2100). XRD patterns were recorded on a XRD Bruker D8 Endeavor equipped with Cu-Kα radiation in a 2θ range from 10° to 90° with a step size of 0.01°. The FTIR spectra of samples were measured in the range from 500 to 4000 cm−1 using a Shimadzu IR Prestige21 spectrometer. The stability of the nanofluid was investigated using a Malvern ZS Nano S analyzer (London, UK). The thermal conductivity (K) of the nanofluids was measured using an HTL-04 thermal conductivity meter (Eternal Engineering Equipment Ltd., India) in the range from 30 °C to 60 °C according to the principal of the guarded hot plate (GHP) method. According to the supplier, the HTL-04 apparatus has a maximum uncertainty of ±2%. To validate the measurement technique, the thermal conductivity of ethylene glycol was measured at a temperature of 30 °C and compared with the reference value of 0.253 W m−1 K−1.22 The measured thermal conductivity of 0.249 W m−1 K−1 is in good agreement with the reference value within ±2%. The experimental thermal conductivity values of nanofluids were the average of 15 measurements for each nanofluid. The measurements were conducted under the same environmental conditions, such as temperature, humidity, etc.3. Results and discussion
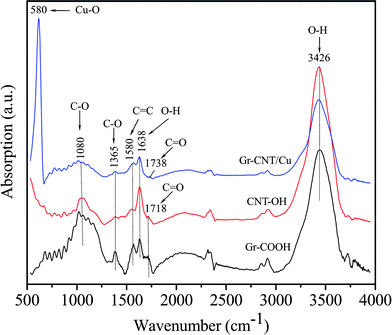
Fig. 2 presents a typical FTIR spectrum of Gr–COOH, MWCNT–OH and Gr–MWCNT/Cu hybrid material. For Gr–COOH, some typical bands are shown such as νOH = 3426 cm−1, νC![[double bond, length as m-dash]](https://www.rsc.org/images/entities/char_e001.gif) O = 1718 cm−1, νHbonded(C
O = 1718 cm−1, νHbonded(C![[double bond, length as m-dash]](https://www.rsc.org/images/entities/char_e001.gif) O) = 1638 cm−1, νC
O) = 1638 cm−1, νC![[double bond, length as m-dash]](https://www.rsc.org/images/entities/char_e001.gif) C = 1580 cm−1, and νC–O = 1080 and 1365 cm−1.23,24 The existence of the band for C
C = 1580 cm−1, and νC–O = 1080 and 1365 cm−1.23,24 The existence of the band for C![[double bond, length as m-dash]](https://www.rsc.org/images/entities/char_e001.gif) O bonding vibration in the carboxyl group located at 1718 cm−1 confirmed that Gr–COOH were successfully prepared due to oxidation resulting from nitric and sulfuric acid treatment.25 For the MWCNT–OH spectrum, bands similar to Gr–COOH were also detected, but the typical bands for the O–H stretching vibration mode show higher intensity than those of the Gr–COOH. Normally, after the hydroxyl treatment process with EG, the νC
O bonding vibration in the carboxyl group located at 1718 cm−1 confirmed that Gr–COOH were successfully prepared due to oxidation resulting from nitric and sulfuric acid treatment.25 For the MWCNT–OH spectrum, bands similar to Gr–COOH were also detected, but the typical bands for the O–H stretching vibration mode show higher intensity than those of the Gr–COOH. Normally, after the hydroxyl treatment process with EG, the νC![[double bond, length as m-dash]](https://www.rsc.org/images/entities/char_e001.gif) O at 1718 cm−1 will disappear due to the displacement reaction.25 The existence of the C
O at 1718 cm−1 will disappear due to the displacement reaction.25 The existence of the C![[double bond, length as m-dash]](https://www.rsc.org/images/entities/char_e001.gif) O stretching vibration mode with very small intensity in the MWCNT–OH spectrum indicated that a part of the carboxyl functional group still remained together with the hydroxyl group in CNT–OH. This could be due to the reaction time for hydroxyl treatment being shorter than that in the usual report.21 However, this could be of benefit in attaching the Cu nanoparticles on the sidewalls of the MWCNTs. In the FTIR spectrum of the Gr–MWCNT/Cu hybrid material, in addition to the typical bands of νOH = 3426 cm−1, νHbonded(C
O stretching vibration mode with very small intensity in the MWCNT–OH spectrum indicated that a part of the carboxyl functional group still remained together with the hydroxyl group in CNT–OH. This could be due to the reaction time for hydroxyl treatment being shorter than that in the usual report.21 However, this could be of benefit in attaching the Cu nanoparticles on the sidewalls of the MWCNTs. In the FTIR spectrum of the Gr–MWCNT/Cu hybrid material, in addition to the typical bands of νOH = 3426 cm−1, νHbonded(C![[double bond, length as m-dash]](https://www.rsc.org/images/entities/char_e001.gif) O) = 1638 cm−1, νC
O) = 1638 cm−1, νC![[double bond, length as m-dash]](https://www.rsc.org/images/entities/char_e001.gif) C = 1580 cm−1, and νC–O = 1080 and 1365 cm−1, a peak at 1738 cm−1 ascribed to C
C = 1580 cm−1, and νC–O = 1080 and 1365 cm−1, a peak at 1738 cm−1 ascribed to C![[double bond, length as m-dash]](https://www.rsc.org/images/entities/char_e001.gif) O stretching vibrations of the ester carbonyl group could result from the reaction between hydroxyl functional groups of MWCNT–OH and carboxyl functional groups of Gr–COOH.26 In comparison with the carboxyl functional group, the peak for C
O stretching vibrations of the ester carbonyl group could result from the reaction between hydroxyl functional groups of MWCNT–OH and carboxyl functional groups of Gr–COOH.26 In comparison with the carboxyl functional group, the peak for C![[double bond, length as m-dash]](https://www.rsc.org/images/entities/char_e001.gif) O stretching of the ester is shifted to higher wavenumber and located in the range from 1735 to 1750 cm−1.27 In addition, the absorption band observed at 580 cm−1 is associated with the Cu–O stretching vibrations related to the presence of Cu nanoparticles.28 In comparison with Gr–COOH and MWCNT–OH, the FTIR spectrum of Gr–MWCNT/Cu shows the disappearance of the C
O stretching of the ester is shifted to higher wavenumber and located in the range from 1735 to 1750 cm−1.27 In addition, the absorption band observed at 580 cm−1 is associated with the Cu–O stretching vibrations related to the presence of Cu nanoparticles.28 In comparison with Gr–COOH and MWCNT–OH, the FTIR spectrum of Gr–MWCNT/Cu shows the disappearance of the C![[double bond, length as m-dash]](https://www.rsc.org/images/entities/char_e001.gif) O vibration of the carboxyl group and the appearance of other absorption bands at lower wavenumber. This could be due to symmetric and asymmetric stretching of O–C–O, revealing the conjugation of nanoparticles to the Gr and MWCNT via bridging interactions.29,30
O vibration of the carboxyl group and the appearance of other absorption bands at lower wavenumber. This could be due to symmetric and asymmetric stretching of O–C–O, revealing the conjugation of nanoparticles to the Gr and MWCNT via bridging interactions.29,30
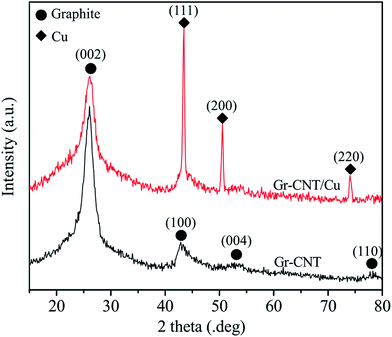
Fig. 3 shows the XRD patterns of Gr–MWCNT and Gr–MWCNT/Cu materials. The XRD pattern of Gr–MWCNT hybrid material shows some typical peaks of graphite at 26.18°, 43.04°, 54.38° and 77.48° corresponding to (002), (100), (004) and (110) planes, respectively. For the XRD pattern of Gr–MWCNT/Cu material, in addition to the typical peak of graphite at 2θ = 26.3° corresponding to the reflection on the (002) planes, some peaks of Cu were detected at ∼43.192°, 50.300° and 73.888° corresponding to (111), (200), and (220) planes, respectively. In addition, there are no representative peaks of CuO phases detected, indicating that no oxidation phases were formed in the sample during the chemical reduction process. Therefore, the use of the ascorbic acid solution as reducing and antioxidant agent could restrict the formation of oxidation phases; this is also in agreement with other reports.31,32 Moreover, using Scherrer's formula for the typical peaks, an average crystallite size for the Cu nanoparticles was estimated as 16.5 nm. From both FTIR and XRD studies, it was demonstrated that Cu nanoparticles were successfully decorated on Gr–CNT hybrid material by the chemical reduction technique.
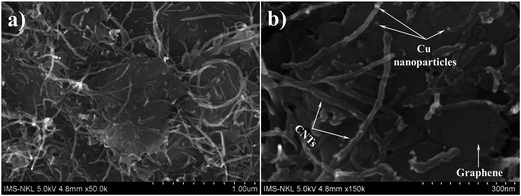
Fig. 4 shows the FESEM images of Gr–MWCNT/Cu material; the images show that MWCNTs were connected or intercalated between graphene sheets. These intercalations are of benefit in reducing the stacking of graphene sheets and increase both the effective surface area and the effective thermal conductivity of the material. Moreover, the Cu nanoparticles with uniform size are well decorated on the surface of graphene sheets and MWCNTs. According to Baby et al. the existence of functional groups on the surface helped to promote good interaction of these nanoparticles with graphene sheets and MWCNTs, in which they act as nucleation sites for Cu nanoparticles.18 The formation of Cu nanoparticles is described by the following reaction.
| Cu(NO3)2 + 2NaBH4 = Cu + 2NaNO3 + H2 + 2BH3 | (1) |
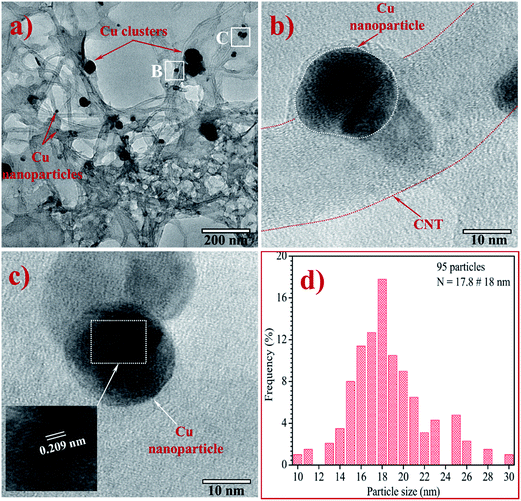
Fig. 5a is an HRTEM image at low magnification of Gr–MWCNT/Cu material to investigate the morphology and size distribution. This image shows that Cu nanoparticles are well decorated on the surface of both MWCNTs and graphene sheets. However, at certain positions, Cu nanoparticles are not only in individual form but also in aggregated forms. Fig. 5b and c are the HRTEM images at high magnification of Gr–MWCNT/Cu material obtained after the ultrasonication process to disperse in EG solution. The results showed that Cu nanoparticles still appeared on the surface of the MWCNTs or graphene sheets. Combining these results with the FTIR result (existence of Cu–O stretching vibrations at 580 cm−1) allows us to conclude that Cu nanoparticles were grown and chemically bonded on the MWCNTs and Gr surfaces through the functionalized groups. In addition, the measurement of the lattice constant of the nanoparticles indicated that the d spacing was about 0.209 nm, which is in good agreement with the (111) lattice spacing of Cu metal.33 The histogram of Cu particle size calculated from HRTEM data is shown in Fig. 5d. The average particle size was about 18 nm, slightly larger than that of the crystallite size (16.5 nm) calculated from the XRD using the Scherrer equation. This is also in agreement with the reports about the comparison of nanosize determination by different methods, wherein it was demonstrated that the good agreement only applied to small nanocrystals in the size range below 10 nm.34,35
To validate stability, the prepared nanofluids were characterized by a zeta potential analyser. The stability of dispersion can be estimated using the value of the zeta potential. The nanofluid is physically stable with a zeta potential more negative than −30 mV or more positive than +30 mV, while poor stability shows a value below 20 mV.36,37 In this study, the average potential values for nanofluids were measured to be −52.9, −47.5, −47.2 and −42.7 mV corresponding to NF1, NF2, NF3 and NF4, respectively. From the results, it is clearly confirmed that the nanofluids have good stability. It is well known that the stability of nanofluids could be improved using some chemical techniques, such as surfactant addition, surface treatment, and pH changing. In this case, the functional groups (–COOH, –OH) attached on the surfaces of both graphene and MWCNTs via chemical treatments improved the dispersion as well as the stability of the nanofluids.
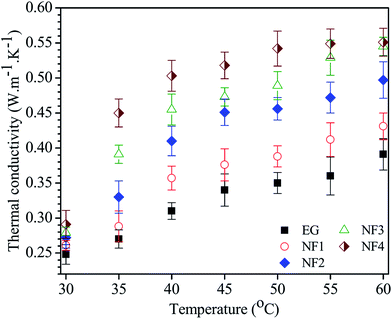
The thermal conductivity of the obtained nanofluids with different concentrations as a function of different temperatures is shown in Fig. 6. The results show that the thermal conductivity of the nanofluid depends on the concentration of Gr–MWCNT/Cu material and the measured temperature. For each measured temperature from 30 °C to 60 °C, the nanofluid containing a higher concentration of Gr–MWCNT/Cu material has higher thermal conductivity and the thermal conductivity increases as the temperature increases for each nanofluid. The increase of thermal conductivity is nonlinear both with temperature and with volume fraction and is consistent with other literature reports.13,38 According to Baby et al., the linearity/nonlinearity of thermal conductivity strongly depends on the nature of the nanoparticle as well as the base fluid.13 When volume fraction increases or the distance or mean free path of nanoparticles decreases due to the percolation effect, increasing the frequency of lattice vibration, it leads to enhanced thermal conductivity of the nanofluid.13 The enhancement in thermal conductivity with increasing temperature could be explained according to the report by Li and coworkers.39 Li et al. reported that the change of nano additives agglomeration and viscosity with temperature along with Brownian motion are important factors to describe the temperature dependence of the thermal conductivity of nanofluids.39 According to Li, a temperature increase would lead to the following effects: (i) decrease in the agglomeration of nano additives in the nanofluid by the reduction of the nano additive surface energy, (ii) improvement in the Brownian motion by the reduction of viscosity.39 It is well known that the Brownian motion provides a key mechanism for thermal conductivity enhancement of nanofluids.40 Therefore, the thermal conductivity of nanofluids increases with increasing temperature.
The enhancement percentage of the thermal conductivity is calculated using the following eqn (2):
 | (2) |
Thermal conductivity enhancement increases as the Gr–MWCNT/Cu concentration in the nanofluid increases. For example, at a fixed temperature of 30 °C, nanofluid NF4 has about 17% enhancement compared to that of nanofluid NF1 at only 4%. The enhancement of thermal conductivity at different temperatures was also considered. Nanofluid NF1, containing 0.005 vol% Gr–MWCNT/Cu concentration, shows only 4% enhancement at 30 °C and 10% at 60 °C, whereas, NF4 with 0.035 vol% Gr–MWCNT/Cu concentration shows an enhancement of 17% at 30 °C and about 41% at 60 °C. In comparison, the thermal conductivity enhancement of nanofluid containing Gr–MWCNT/Cu material is higher than most results reported earlier using the same level of concentration (Table 1). For graphene-based EG nanofluid, Baby et al.,42 Selvam et al.36 and Lee et al.45 reported enhancements of 7%, 21% and 32% at volume fractions of 0.05, 0.5 and 4 vol% Gr loading, respectively. A much higher enhancement up to 86% was also reported by Yu et al., in which the nanofluid contained a very high concentration of 5 wt% graphene oxide.41 Baby and Sundara recently developed Ag and CuO decorated graphene-based nanofluids and reported enhancements up to 14% and 23%, respectively, at a very low concentration.13,14 Several reports on using CNT for nanofluids have been developed and reported.49–53 For example, Harish et al. reported an enhancement up to 14.8% for SWNT/EG nanofluids at 0.2 vol%.49 Chen et al. reported an enhancement up to 17.5% for treated MWNT/EG nanofluids at 1 vol% concentration. A significant thermal conductivity enhancement of up to 40% at a very low concentration (0.03 vol%) of functionalized CNT has been reported by Aravind.52 The enhancement was attributed to the better dispersion and stability of CNT using chemical treatment.52 Several studies on using Gr–CNT hybrid material for nanofluids have been carried out and reported.18,43,46 The results showed the promise of the hybrid material for enhancing the thermal conductivity at much lower concentrations. Shende et al.46 reported an enhancement of 15.1% at 0.03 vol% for nitrogen-doped graphene–MWCNT/EG-based nanofluids. Aravind and Ramaprabhu also reported an enhancement up to 24% for a nanofluid containing a low concentration of 0.04 vol% Gr–CNT hybrid material.43 From the above discussion, it is clearly confirmed that our material is very efficient for enhancing the thermal conductivity of nanofluid compared to pure graphene or CNT nanofluids. This is attributed to the synergistic effect of high thermally conducting individual components, such as graphene sheets, CNTs and Cu nanoparticles. The incorporation of both graphene and MWNT into a hybrid material can effectively make use of the excellent thermal properties of both species, as presented by Aravind and Ramaprabhu.43 In addition, according to Baby et al. the addition of Cu nanoparticles and CNTs will not only help to prevent the stacking of graphene sheets, but also increase the overall surface area in the nanofluid and subsequently the thermal conductivity of the nanofluids will be enhanced.18
| Ref. | Material type | Base fluid | Material concentration | Measurement technique | Temperature | Enhancement |
|---|---|---|---|---|---|---|
| This work | Gr–CNT/Cu hybrid materials | EG | 0.005–0.035 vol% | GHP method | 30–60 °C | 10–41% |
| 18 | Ag decorated MWNT–HEG hybrid | EG | 0.005–0.04 vol% | THW method | 25–50 °C | 1–20% |
| 14 | Silver nanoparticles decorated graphene | EG | 0.005–0.05 wt% | THW method | 25–70 °C | 3–14% |
| 42 | Exfoliated graphene based nanofluids | EG | 0.005–0.056 wt% | THW method | 25–50 °C | 4–7% |
| 43 | Graphene–CNT hybrid | EG | 0.011–0.04 vol% | THW method | 25–50 °C | 13.7–24% |
| 13 | Copper oxide decorated graphene (CuO/HEG) | EG | 0.01–0.007 wt% | THW method | 20–50 °C | 17–23% |
| 36 | Graphene nanoplatelets | EG | 0.5 vol% | THW method | 30 °C | 21% |
| 41 | Graphene oxide nanofluid | EG | 2–5 wt% | THW method | 10–60 °C | Up to 86% |
| 44 | Alkaline graphite oxide | EG | 0.008–0.138 vol% | THW method | 25 °C | 2.4–6.5% |
| 45 | Graphene nanoplatelets | EG | 0.5–4 vol% | LAMBDA system | 10–90 °C | Up to 32% |
| 46 | Nitrogen doped graphene–MWCNT | EG | 0.005–0.03 vol% | Hot disk thermal | 25–50 °C | Up to 15.1% |
| 47 | Al2O3 nanoparticles | EG | 0.5–3 vol% | THW method | 20–50 °C | 14–32% |
| CuO nanoparticles | EG | 0.5–3 vol% | THW method | 20–50 °C | 9–25% | |
| Cu nanoparticles | EG | 0.1–3 vol% | THW method | 20–50 °C | 8–36% | |
| Al nanoparticles | EG | 0.1–3 vol% | THW method | 20–50 °C | 4–27% | |
| 48 | Nanodiamond–nickel | EG | 3.01 wt% | THW method | 20–60 °C | Up to 13% |
| 49 | SWCNT | EG | 0.2 vol% | THW method | 20–60 °C | Up to 14.8% |
| 50 | Treated MWCNTs | EG | 1 vol% | THW method | 5–65 °C | Up to 17.5% |
| 51 | SWCNT | EG | 2.5 vol% | THW method | 25–50 °C | Up to 20% |
| 52 | Functionalized MWCNT | EG | 0.03 vol% | THW method | 30–70 °C | Up to 40% |
| 53 | Ag decorated MWNT | EG | 0.03 vol% | THW method | 30–50 °C | Up to 11.3% |
| Au decorated MWNT | EG | 0.03 vol% | THW method | 30–50 °C | Up to 10% |
To evaluate the thermal conductivity of nanofluids, several theoretical models could be applied to predict and compare with the experimental results. The classical models such as Maxwell and Hamilton–Crosser are well known to predict the thermal conductivity of well-dispersed fluids containing solid particles.54 Maxwell's model was used to predict the thermal conductivity of fluids containing nano-/micro-sized particles at low volume fractions,55 whereas for the Hamilton–Crosser model, a modification of Maxwell's model, the empirical shape factor n = 3/ψ for spherical and cylindrical medium shapes was taken into account.56 The models depend on the thermal conductivity of the particles, base fluid and the volume fraction of the particles. In addition to the classical models, some modern theoretical models that depend mainly on the particle concentration have been proposed such as Pak and Cho's model, Bhattacharya's model, etc. Pak and Cho's model was proposed as a thermal conductivity model under the assumptions that the enhancement effect is mainly the effect of the dispersion of nanoparticles in base fluids.57 Bhattacharya's model is a dynamic model based on combining the thermal conductivities of base fluids and nanoparticles by replacing with effective contribution of the particles.58
In our study, the Maxwell model, Pak and Cho's model, Bhattacharya's model and the Hamilton–Crosser model were employed to predict the thermal conductivity ratio between nanofluid and base fluid (Knf/Kbf). The abovementioned theoretical models are formulated as follows:
Maxwell's model55
 | (3) |
Pak and Cho's model57
 | (4) |
Bhattacharya's model58
 | (5) |
Hamilton–Crosser model56
 | (6) |
| Khm = ϕGrKGr + ϕCNTKCNT + ϕCuKCu | (7) |
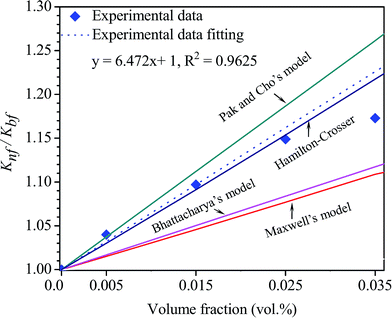 | ||
| Fig. 7 Experimental and calculated thermal conductivity ratio as a function of volume concentrations at 30 °C according to several theoretical thermal conductivity models. | ||
The results estimated from Maxwell's model, Pak and Cho's model and Bhattacharya's model do not match with our experimental results. This is because the abovementioned models do not take into account the effect of the thermal interface resistance between the hybrid material and base fluid and are only applied for spherical particles.54 Only the Hamilton–Crosser model is probably suitable for predicting the thermal conductivity ratio of our nanofluid due to the fact that Hamilton–Crosser's model could be applied not only for spherical particles but also for other shapes. In our case, by the assumption that Cu nanoparticles and MWCNTs were decorated completely on the graphene sheets Gr–MWCNT/Cu material could be only considered as flake shapes with the empirical shape factor of 6 for calculation. The obtained results from Hamilton–Crosser's model nearly match with the experimental results. In fact, the decoration of MWCNTs and Cu particles on the surface of each graphene sheet was confirmed via SEM and HRTEM studies and discussed in the above sections.
4. Conclusion
In conclusion, the nanofluid-based ethylene glycol containing Cu nanoparticles decorated on Gr–MWCNT hybrid material is synthesized successfully via a chemical reduction method. Cu nanoparticles with an average diameter of 18 nm were well bonded on the surface of both MWCNTs and graphene sheets. Nanofluids show good stability due to the functional groups attached on surfaces of both graphene sheets and MWCNTs. The enhancement is obtained in all nanofluids and maximum enhancement of 41% was observed at 60 °C for nanofluid containing 0.035 vol% Gr–MWCNT/Cu hybrid material. The enhancement is due to the synergistic effect of high thermally conducting graphene sheets, CNTs and Cu nanoparticles as well as the high surface area of the Gr–MWCNT/Cu structure. Experimental results of the thermal conductivity were evaluated using theoretical models and the Hamilton–Crosser model is the most suitable for predicting the thermal conductivity of our nanofluid using the empirical shape factor of flakes.Acknowledgements
The study was financially supported by The National Foundation for Science and Technology Development (NAFOSTED) under a project 103.99.2014.71.References
- Y. Xuan and Q. Li, Int. J. Heat Fluid Flow, 2000, 21, 58–64 CrossRef CAS.
- E. V. Timofeeva, W. Yu, D. M. France, D. Singh and J. L Routbort, Nanoscale Res. Lett., 2011, 6, 182 CrossRef PubMed.
- J. Philip and P. D. Shima, Adv. Colloid Interface Sci., 2012, 183–184, 30–45 CrossRef CAS PubMed.
- H. E. Patel, T. Sundararajan and S. K. Das, J. Nanopart. Res., 2010, 12, 1015–1031 CrossRef CAS.
- V. Sridhara and L. N. Satapathy, Nanoscale Res. Lett., 2011, 6, 456 CrossRef PubMed.
- A. A. Balandin, Nat. Mater., 2011, 10, 569–581 CrossRef CAS PubMed.
- H. Xie and L. Chen, J. Chem. Eng. Data, 2011, 56, 1030–1041 CrossRef CAS.
- E. Sadeghinezhad, M. Mehrali, R. Saidurc, M. Mehrali, S. T. Latibari, A. R. Akhiani and H. S. C. Metselaar, Energy Convers. Manage., 2016, 111, 466–487 CrossRef CAS.
- A. K. Rasheed, M. Khalid, W. Rashmi, T. C. S. M. Gupta and A. Chan, Renewable Sustainable Energy Rev., 2016, 63, 346–362 CrossRef CAS.
- M. N. M. Zubir, A. Badarudin, S. N. Kazi, N. M. Huang, M. Misran and E. Sadeghinezhad, et al., Exp. Therm. Fluid Sci., 2015, 66, 290–303 CrossRef CAS.
- N. M. Phan, H. T. Bui, M. H. Nguyen and H. K. Phan, Adv. Nat. Sci.: Nanosci. Nanotechnol., 2014, 5, 015014 CrossRef.
- B. H. Thang, P. H. Khoi and P. N. Minh, Phys. Fluids, 2015, 27, 032002 CrossRef.
- T. T. Baby and R. Sundara, J. Phys. Chem. C, 2011, 115, 8527–8533 CAS.
- T. T. Baby and R. Sundara, J. Mater. Chem., 2011, 21, 9702–9709 RSC.
- L. Sun, W. Kong, Y. Jiang, H. Wu, K. Jiang, J. Wang and S. Fan, J. Mater. Chem. A, 2015, 3, 5305–5312 CAS.
- V. T. Dang, D. D. Nguyen, T. T. Cao, P. H. Le, D. L. Tran, N. M. Phan and V. C. Nguyen, Adv. Nat. Sci.: Nanosci. Nanotechnol., 2016, 7, 033002 CrossRef.
- Y. Zhu, L. Li, C. Zhang, G. Casillas, Z. Sun and Z. Yan, Nat. Commun., 2012, 3, 1225 CrossRef PubMed.
- T. T. Baby and R. Sundara, AIP Adv., 2013, 3, 012111 CrossRef.
- N. D. Dung, N. V. Chuc, N. T. T. Tam, N. H. Quang, P. H. Khoi and P. N. Minh, J. Korean Phys. Soc., 2008, 52, 1372–1377 CrossRef CAS.
- D. V. Thanh, L. J. Li, C. W. Chu, P. J. Yen and K. H. Wei, RSC Adv., 2014, 4, 6946–6949 RSC.
- H. Kong, C. Gao and D. Yan, Macromolecules, 2004, 37, 4022–4030 CrossRef CAS.
- R. Di Guilio and A. S. Teja, J. Chem. Eng. Data, 1990, 35, 117–121 CrossRef CAS.
- J. Jang, J. Bae and S. Yoon, J. Mater. Chem., 2003, 13, 676–681 RSC.
- J. Zhang, H. Zou, Q. Qing, Y. Yang, Q. Li, Z. Liu, X. Guo and Z. Du, J. Phys. Chem. B, 2003, 107, 3712–3718 CrossRef CAS.
- B. H. Thang, P. V. Trinh, N. T. Huong, P. H. Khoi and P. N. Minh, J. Korean Phys. Soc., 2014, 65, 312–316 CrossRef CAS.
- M. A. Kabbani, C. S. Tiwary, P. A. S. Autreto, G. Brunetto and A. Som, et al., Nat. Commun., 2015, 6, 7291 CrossRef CAS PubMed.
- R. N. Jones and B. S. Gallagher, J. Am. Chem. Soc., 1959, 81, 5242–5251 CrossRef CAS.
- R. L. Frost, W. N. Martens, L. Rintoul, E. Mahmutagic and J. T. Kloprogge, J. Raman Spectrosc., 2002, 33, 252–259 CrossRef CAS.
- A. Baykal, M. Senel, B. Unal, E. Karaoglu, H. Sozeri and M. S. Toprak, J. Inorg. Organomet. Polym., 2013, 23, 726–735 CrossRef CAS.
- H. Yuan, Y. Xu, H. Jia and Sh. Zhou, RSC Adv., 2016, 6, 67218–67225 RSC.
- T. M. D. Dang, T. T. T. Le, E. Fribourg-Blanc and M. C. Dang, Adv. Nat. Sci.: Nanosci. Nanotechnol., 2011, 2, 025004 CrossRef.
- J. Xiong, Y. Wang, Q. Xue and X. Wu, Green Chem., 2011, 13, 900–904 RSC.
- M. Cao, C. Hu, Y. Wang and Y. Guo, et al., Chem. Commun., 2003, 15, 1884–1885 RSC.
- Y. Zhong, D. Ping, X. Song and F. Yin, J. Alloys Compd., 2009, 476, 113–117 CrossRef CAS.
- H. B. Elena, V. Shevchenko, A. Robert and I. Mekis, et al., Langmuir, 2005, 21, 1931–1936 CrossRef PubMed.
- C. Selvam, D. Mohan Lal and S. Harish, Thermochim. Acta, 2016, 642, 32–38 CrossRef CAS.
- S. Park and R. S. Ruoff, Nat. Nanotechnol., 2009, 4, 217–224 CrossRef CAS PubMed.
- S. K. Das, N. Putra, P. Thiesen and W. J. Roetzel, J. Heat Transfer, 2003, 125, 567–574 CrossRef CAS.
- Y. H. Li, W. Qu and J. C. Feng, Chin. Phys. Lett., 2008, 25, 3319 CrossRef CAS.
- C. H. Chon, K. D. Kihm, S. P. Lee and S. U. S. Choi, Appl. Phys. Lett., 2005, 87, 153107 CrossRef.
- W. Yu, H. Xie, X. Wang and X. Wang, Phys. Lett. A, 2011, 375, 1323–1328 CrossRef CAS.
- T. T. Baby and S. Ramaprabhu, J. Appl. Phys., 2010, 108, 124308 CrossRef.
- S. J. Aravind and S. J. Ramaprabhu, RSC Adv., 2013, 3, 4199 RSC.
- S. J. Aravind and S. J. Ramaprabhu, Appl. Phys., 2011, 110, 124326 Search PubMed.
- G. J. Lee and C. Rhee, J. Mater. Sci., 2014, 49, 1506–1511 CrossRef CAS.
- R. Shende and R. Sundara, Sol. Energy Mater. Sol. Cells, 2015, 140, 9–16 CrossRef CAS.
- H. E. Patel, T. Sundararajan and K. Das, J. Nanopart. Res., 2010, 12, 1015–1031 CrossRef CAS.
- L. S. Sundar, M. K. Singh, E. V. Ramana, B. Singh, J. Gracio and A. C. M. Sousa, Sci. Rep., 2014, 4, 4039 Search PubMed.
- S. Harish, K. Ishikawa, E. Einarsson, S. Aikawa, S. Chiashi, J. Shiomi and S. Maruyama, Int. J. Heat Mass Transfer, 2012, 55, 3885–3890 CrossRef CAS.
- L. Chen, H. Xie, Y. Li and W. Yu, Thermochim. Acta, 2008, 477, 21–24 CrossRef CAS.
- A. Amrollahi, A. A. Hamidi and A. M. Rashidi, Nanotechnology, 2008, 19, 315701 CrossRef CAS PubMed.
- S. S. J. Aravind, P. Baskar, T. T. Baby, R. K. Sabareesh, S. Das and S. Ramaprabhu, J. Phys. Chem. C, 2011, 115, 16737–16744 CAS.
- N. Jha and S. Ramaprabhu, J. Appl. Phys., 2009, 106, 084317 CrossRef.
- P. M. Kumar, J. Kumar, R. Tamilarasan, S. Sendhilnathan and S. Suresh, Eng. J., 2015, 19, 67–83 CrossRef.
- J. C. Maxwell, A Treatise on Electricity And Magnetism, Clarendon, UK, 1973 Search PubMed.
- R. L. Hamilton and O. K. Crosser, Ind. Eng. Chem. Fundamen., 1962, 1, 187–191 CAS.
- B. C. Pak and Y. I. Cho, Exp. Heat Transfer, 1998, 11, 151–170 CrossRef CAS.
- P. Bhattacharya, S. K. Saha, A. Yadav, P. E. Phelan and R. S. Prashar, J. Appl. Phys., 2004, 95, 6492–6494 CrossRef CAS.
- D. R. Askeland, P. P. Fulay and W. J. Wright, The Science and Engineering of Materials, 6th edn, 2010-06-21 Search PubMed.
Footnote |
| † Electronic supplementary information (ESI) available. See DOI: 10.1039/c6ra25625b |
| This journal is © The Royal Society of Chemistry 2017 |

