 Open Access Article
Creative Commons Attribution 3.0 Unported Licence
Thiol–ene chemistry of vegetable oils and their derivatives under UV and air: a model study by using infrared spectroscopy and mass spectrometry†
Yu Hui Zhaoa,
Sébastien Hupinb,
Laurence Lecamp *a,
Daniela Vulugaa,
Carlos Afonso
 b,
Fabrice Burela and
Corinne Loutelier-Bourhisb
aNormandie Univ, UNIROUEN, INSA Rouen, CNRS, PBS, 76000 Rouen, France. E-mail: laurence.lecamp@insa-rouen.fr
bNormandie Univ, UNIROUEN, INSA Rouen, CNRS, COBRA, 76000 Rouen, France
First published on 13th January 2017
Abstract
Herein, a model study of the photoinitiated thiol–ene reaction was carried out on unsaturated fatty methyl esters at room temperature and without photoinitiator. Reaction kinetics were monitored by FTIR spectroscopy and reaction products were identified by high resolution mass spectrometry coupled to ion mobility spectrometry. This set of analytical tools enabled us to highlight the concomitance of fatty double bond oxidation and thiol–ene addition when such a formulation was exposed to UV radiation. Indeed, thiol–ene adducts were identified on fatty moieties oxidized or not, without prevalence of one reaction over the other: photoinitiated thiol–ene addition could occur on preoxidized products, and photooxidation could occur on thiol–ene adducts. However, the presence of oxidized fatty products such as peroxides and zwitterionic species was proved to be favourable to the photocrosslinking of fatty coatings by thiol–ene addition.
Introduction
Photoinitiated thiol–ene reaction has been extensively studied in recent years and is mainly used to functionalize fatty molecules. However, because of the weak reactivity of fatty double bonds, particular conditions are necessary to achieve a good reaction conversion: low temperature, high thiol/ene ratios (>4), long reaction time (several hours to days), and use of photoinitiator.1,2 Until today, only a few materials have been prepared directly from native oil.3 In a previous work, we have shown that crosslinked fatty coatings could be obtained from linseed oil using the photoinitiated thiol–ene reaction (Fig. 1).4The low thickness of these coatings has enabled to reach an optimal conversion of double bonds (higher than 80%) after 20 min irradiation under air in the presence of only 0.5 equivalent of thiol and without photoinitiator. Furthermore, crosslinking was observed even when a monothiol was used. All these unusual results have led us to assume the existence of concomitant intermolecular reactions during the irradiation step, taking place together with the classical thiol–ene addition. The participation of oxygen during the photoinitiated thiol/ene addition has been especially highlighted.
Several works have already mentioned the role of oxygen in the thiol–ene addition and detected numerous unclear side products.5–7 One of the key advantages of the thiol–ene addition is its high ability to overcome the oxygen inhibition. Indeed, formation of peroxyl radicals does not inhibit the hydrogen abstraction from thiol groups to form thiyl radicals. Besides, several works have also noticed the oligomerization of triglycerides during the thiol–ene addition under UV.6,8 Until now, these results have been explained by a possible propagation of the radical reaction to fatty double bonds. Indeed, such a reaction has been highlighted for 1,4-polybutadiene which exhibited quite similar double bond structures compared to fatty acids.9
This work aims to investigate the nature of these concomitant reactions and to explain how triglycerides molecules could be crosslinked with a monothiol in large default in respect to the fatty double bond amount. Due to the complexity of the linseed oil composition (fatty moieties with various unsaturation degrees),10 the study was performed on monounsaturated fatty monoesters as model molecules. This study first focused in studying the photo-oxidation of methyl esters. In a second part, the photoinitiated thiol–ene reaction under air was investigated. The structural analyses of the different reaction products was carried out using electrospray ionization-ion mobility spectrometry-tandem mass spectrometry (ESI-IMS-MS/MS) and gas chromatography-mass spectrometry (GC-MS).
Experimental
Materials
Oleic acid (OA, 90%), elaidic acid (EA, 99%) and methyl stearate (MeS, 99%) obtained from Sigma Aldrich were used as fatty model molecules. Dodecanethiol (DT, 98%) obtained from Merck-Schuchardt was used as monothiol monomer. Deuterated chloroform and sulfuric acid (98%) were purchased from VWR. All materials were used as received. Any deoxygenation procedure was carried out on samples before irradiation.Preparation of fatty methyl esters
Into a 50 mL round bottom flask fitted with a magnetic stirrer and a reflux condenser, were introduced oleic or elaidic acid (5 g, 17 mmol) and methanol (30 mL). H2SO4 (about 0.3 mmol) was then added drop by drop. The mixture was heated to boiling point and reflux for 24 h. After phase separation, the alcoholic phase was washed with diethyl ether (2 × 30 mL). All the lipophilic phases were then collected, washed with water and dried with MgSO4. The solvent was evaporated under vacuum affording a colorless liquid. Another derivation method was tested using BF3/CH3OH, as previously described.11Thiol–ene formulation
2 mol of methyl oleate or elaidate was mixed with 1 mol of dodecanethiol (“thiol” to “ene” ratio of 0.5). No solvent was added. Reagents were stirred for 2 min before irradiation.Analytical techniques
1H NMR analyses were carried out on a Bruker 300 MHz spectrometer at room temperature. The chemical shifts are given in ppm relative to trimethylsilane (TMS) used as external reference. Samples were prepared as follows: 10 mg of product in 0.4 mL of CDCl3.Fourier Transform Infra-Red (FTIR) spectra were performed on a Vertex 70 Bruker spectrometer equipped with an ATR accessory (ATR MK II Golden Gate Specac, Eurolabo). A drop of the sample was applied to the horizontal ATR crystal and then covered or not by a polyethylene film. The presence of the polyethylene film (laminated conditions) allows avoiding the contact of the sample with air. Samples were exposed to an UV light coming from a polychromatic Hg–Xe lamp (Hamamatsu LC8 – I0 = 120 mW cm−2 at 365 nm) for 20 min at 30 °C. IR spectra were simultaneously recorded versus irradiation time. Double bond consumption was determined by following the absorption peak at 3010 cm−1 for the cis configuration alkene. Carbonyl group at 1640 cm−1 was used as peak reference. The absorbance measured for each functional group was determined by the area (A) of the corresponding absorption peak. The double bond conversion was then calculated using the ratios of the double bonds absorbance (A3010) to the reference absorbance (A1640) during irradiation, as follows:12
ESI-IMS-MS(/MS) experiments were performed using a Waters Synapt G2 hybrid quadrupole/time of flight HDMS instrument equipped with an ESI LockSpray™ source and a travelling-wave ion mobility spectrometry (TWIMS) cell consisting of three travelling wave-enabled stacked ring ion guides, as previously described.13,14 MassLynx 4.1 and DriftScope 2.2 softwares (Waters, Manchester, UK) were used for the spectra acquisition and treatment. The sample solutions were infused into the source with a syringe pump (Cole-Palmer, Vernon Hills, Illinois, USA) set at a flow-rate of 3 μL min−1. The ESI source parameters were set as followed: capillary voltage; 3 kV, sample cone voltage; 40 V, extraction cone voltage; 5 V, source temperature; 90 °C, desolvation temperature, 250 °C; desolvation gas flow (N2), 500 L h−1. MS and MS/MS experiments were acquired over a range of 50 to 2000 m/z (1 s scan time and 0.02 s interscan delay) in either ‘V’ resolution mode (resolution 20![[thin space (1/6-em)]](https://www.rsc.org/images/entities/char_2009.gif) 000 FWHM) or ‘W’ resolution mode (resolution 40
000 FWHM) or ‘W’ resolution mode (resolution 40![[thin space (1/6-em)]](https://www.rsc.org/images/entities/char_2009.gif) 000 FWHM) (when necessary for accurate mass measurements). Calibration was performed with sodium formate cluster ions. Leucine enkephalin (2 ng μL−1) was used as the lock mass and infused (3 μL min−1) using an independent reference spray via the LockSpray™ interface which was operated at a reference scan frequency, lock spray capillary and collision energy of 10 s, 3 kV and 4 eV, respectively. 1 μL of a 0.1 mol L−1 LiI solution was added into 500 μL sample solution to force the formation of [M + Li]+ ions and to avoid any ambiguity between [M + Na]+, [M + K]+ and oxidized species.
000 FWHM) (when necessary for accurate mass measurements). Calibration was performed with sodium formate cluster ions. Leucine enkephalin (2 ng μL−1) was used as the lock mass and infused (3 μL min−1) using an independent reference spray via the LockSpray™ interface which was operated at a reference scan frequency, lock spray capillary and collision energy of 10 s, 3 kV and 4 eV, respectively. 1 μL of a 0.1 mol L−1 LiI solution was added into 500 μL sample solution to force the formation of [M + Li]+ ions and to avoid any ambiguity between [M + Na]+, [M + K]+ and oxidized species.
For MS/MS experiments, the [M + Li]+ precursor ion was selected by the quadrupole mass analyzer within a 1 m/z unit window and then dissociated in the transfer collision cell (30 eV) using Ar as the collision gas.
Elemental compositions (MS and MS/MS modes) were proposed from the accurate mass measurements and taking into account the isotope predictive filtering value (i-FITTM) given for each possible elemental composition.
For IMS-MS/MS, N2 was used as IMS gas flow (90 mL min−1) whereas helium was used as cell gas flow (180 mL min−1). The wave height was 40 V, the wave velocity 650 m s−1 and the IMS wave delay 450 μs. The precursor ions were mass-selected using the quadrupole (1 m/z unit window), then separated in the mobility cell and finally dissociated into product ions that were analysed using the TOF mass spectrometer. Such analysis is helpful to investigate the relationship between product and precursor ions.
GC-MS analyses were recorded using a time-of-flight mass spectrometer JEOL GC-AccuTOF (Tokyo, Japan) equipped with an Agilent 7890A gas chromatograph. Separations were carried out using a Zebron Z5-MSi capillary column (0.25 mm i.d. × 30 m, 0.25 μm film thickness; Phenomenex). The carrier gas was helium and the flow rate was 0.8 mL min−1 (constant flow mode). The column temperature programming started at 60 °C (1 min holding time) ramped to 350 °C at 10 °C min−1, then the temperature was held at 350 °C for 20 min. The inlet and line temperatures were 290 °C and 280 °C, respectively. Injections of 1 μL were carried out in either split (1![[thin space (1/6-em)]](https://www.rsc.org/images/entities/char_2009.gif) :
:![[thin space (1/6-em)]](https://www.rsc.org/images/entities/char_2009.gif) 10) or splitless mode. Electron ionization (EI) mass spectra were recorded using an ionizing voltage of 70 eV, ionizing current of 300 μA, emission current of 355 μA. The source temperature was 260 °C. The detector voltage was 2200 V and the instrument mass resolution was 8000 (FWHM). The mass spectra were recorded over a range of 35 to 800 m/z.
10) or splitless mode. Electron ionization (EI) mass spectra were recorded using an ionizing voltage of 70 eV, ionizing current of 300 μA, emission current of 355 μA. The source temperature was 260 °C. The detector voltage was 2200 V and the instrument mass resolution was 8000 (FWHM). The mass spectra were recorded over a range of 35 to 800 m/z.
Results and discussion
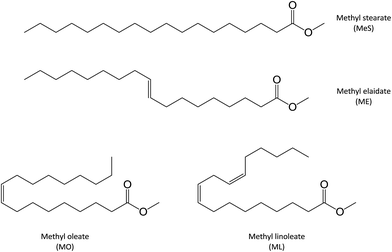
Two monounsaturated fatty esters were studied. Methyl oleate (MO) and methyl elaidate (ME) were prepared by methylation of the corresponding fatty acids, as described in the Experimental section. FTIR and 1H NMR analyses of the obtained products revealed that oleic acid-based ester was actually composed of 90 mol% of methyloctadec-9(Z)-enoate (or cis-methyl oleate (MO)) and 10 mol% of methyloctadecadi-9(Z),12(Z)-enoate (or 9-cis,12-cis-methyl linoleate (ML)) while only a monounsaturated ester was detected in the methyl elaidate (ME) sample with fatty double bond in trans configuration (Fig. 2). ESI-MS analyses of these products, after adding LiI (0.1 mol L−1) in the sample solution to promote lithium adduct formation, show the expected [M + Li]+ ion (with M = ME or MO) at m/z 303.2874 (Fig. SI.1a†). However, additional lithiated ions were also detected. The most abundant of them were the m/z 351.3084 and m/z 379.3038 ions. According to their accurate mass measurements (HRMS), these ions could correspond to the C20H40LiO4 and C21H40LiO5 elemental compositions, i.e. [M + O + CH3OH + Li]+ and [M − 2H + O + 2CH3O + Li]+ (with M = ME or MO), respectively. Note that m/z 379.3038, more abundant for MO, can also correspond to [ML + O + 2CH3OH + Li]+. These species are oxidation and methoxidation products formed during the esterification process (see Fig. SI.1b in ESI† and Table 1).15,16 It could be noticed that these side products were formed whatever the derivation method used (e.g. MeOH/H2SO4 or BF3/MeOH) and did not seem to have influence on the studied photochemical reactions. Indeed, these reactions were carried out on a sample of pure commercial MO and led to mass spectra similar to those presented in this study (data not shown). Besides, additional low abundant m/z 319.2824 ion was also detected which could correspond to lithiated mono-oxidized fatty ester [M + O + Li]+ (with M = ME or MO) (Table 1). These oxidation products are usually encountered for unsaturated fatty esters.18–32 The other low-abundant ions detected on the mass spectra were either non covalent aggregates of fatty esters or contaminants presents in the solvent. The last ones were also observed when solvent was solely infused.| Ion (m/z) | Experimental (m/z) | Calculated (m/z) | ΔM (ppm) | Elemental composition | Identification |
|---|---|---|---|---|---|
| 301 | 301.2719 | 301.2713 | −2.0 | C19H34LiO2 | [ML + Li]+ |
| 303 | 303.2874 | 303.2870 | −1.3 | C19H36LiO2 | [ME + Li]+/[MO + Li]+ |
| 317 | 317.2669 | 317.2662 | −2.2 | C19H34LiO3 | [ML + O + Li]+ |
| 319 | 319.2824 | 319.2819 | −1.6 | C19H36LiO3 | [ME + O + Li]+/[MO + O + Li]+ |
| 333 | 333.2618 | 333.2612 | −1.8 | C19H34LiO4 | [ML + 2O + Li]+ |
| 335 | 335.2771 | 335.2768 | −0.9 | C19H36LiO4 | [ME + 2O + Li]+/[MO + 2O + Li]+ |
| 351 | 351.2717 | 351.2717 | 0.0 | C19H36LiO5 | [ME + 3O + Li]+/[MO + 3O + Li]+ |
| 351 | 351.3084 | 351.3081 | −0.9 | C20H40LiO4 | [ME + O + CH3OH + Li]+/[MO + O + CH3OH + Li]+ |
| 379 | 379.3038 | 379.3030 | −2.1 | C21H40LiO5 | [ML + O + 2CH3O + Li]+ |
| 503 | 503.3926 | 503.3918 | −1.6 | C29H52LiO6 | [ML + D + Li]+ |
| 505 | 505.4084 | 505.4075 | −1.8 | C29H54LiO6 | [ME + D + Li]+/[MO + D + Li]+ |
| 505 | 505.4266 | 505.4261 | −1.0 | C30H58LiO3S | [LA + O + DT + Li]+ |
| 505 | 505.4623 | 505.4625 | 0.4 | C31H62LiO2S | [ME + DT + Li]+/[MO + DT + Li]+ |
| 507 | 507.4421 | 507.4418 | −0.6 | C30H60LiO3S | [EA + O + DT + Li]+/[OA + O + DT + Li]+ |
| 519 | 519.4423 | 519.4418 | −1.0 | C31H60LiO3S | [ML + O + DT + Li]+ |
| 521 | 521.4583 | 521.4574 | −1.7 | C31H62LiO3S | [ME + O + DT + Li]+/[MO + O + DT + Li]+ |
| 535 | 535.4373 | 535.4367 | −1.1 | C31H60LiO4S | [ML + 2O + DT + Li]+ |
| 537 | 537.4521 | 537.4523 | −0.6 | C31H62LiO4S | [ME + 2O + DT + Li]+/[MO + 2O + DT + Li]+ |
Once the fatty esters have been characterized, the study of their behavior under UV irradiation was carried out in a first step. The reaction of each fatty ester with dodecanethiol was investigated in a second step.
Photo-oxidation of fatty esters
Fatty esters were separately irradiated at 30 °C under air or laminated conditions. The reaction was monitored in real time by infrared spectroscopy. The photo-oxidation kinetic study of methyl oleate is reported in Fig. 3.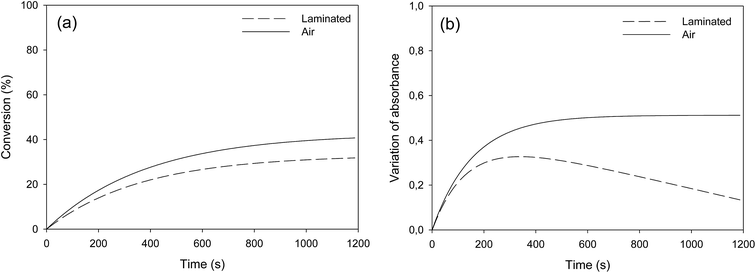 | ||
| Fig. 3 Photo-oxidation kinetic study of methyl oleate: evolution of (a) double bond conversion and (b) OH absorbance variation – T = 30 °C, polychromatic light (I0 = 120 mW cm−2 at 365 nm). | ||
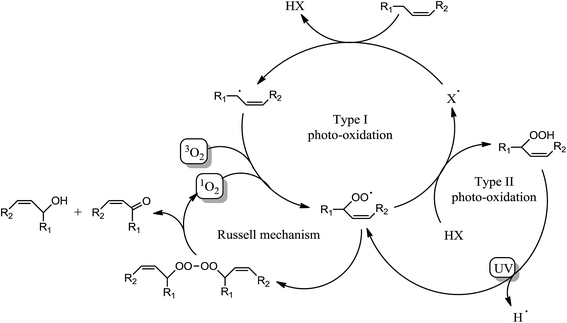
Surprisingly, Fig. 3a shows a slow but regular fatty double bond consumption that reached 40% after 20 min of irradiation in aerated conditions and 30% when samples were covered by a PE film (laminated conditions). At the same time, an absorption band at 3500 cm−1 appeared from the beginning of the irradiation (Fig. 3b), which could be attributed to hydroxyl and/or hydroperoxide groups. According to literature,17–21 even in fresh solutions, oxidized products of fatty moieties are present. These products could result from reaction between fatty radicals and 3O2 biradical species present in the air. When exposed to UV-A and UV-B radiations (between 280 to 400 nm), those oxidized molecules could decompose into radicals and react with surrounding fatty molecules (HX) to form new fatty radicals and fatty hydroperoxides (Fig. 4 – type I photo-oxidation). However, the absorbance curve variations were different depending on the experimental irradiation conditions (Fig. 3b). Indeed, after similar increasing kinetics during the first 100 s irradiation, the reaction rate slowed down and then decreased for fatty ester in laminated film, while a plateau was reached after 500 s irradiation for sample in the presence of air. Regensburger has recently proved that the decomposition of hydroperoxides under UV-A and UV-B radiations could generate 1O2 according to the so-called Russell mechanism.20,21 The singlet oxygen could then induce a type II photo-oxidation of fatty double bonds (Fig. 4). Hence, under UV radiation, the higher the 1O2 generation, the higher the hydroperoxide formation and vice versa. But, in laminated conditions, the lack of 3O2 and the end of 1O2 stock resulting from the photodecomposition of hydroperoxides could explain the disappearance of OH groups in the fatty sample over time. In aerated conditions, a competition between the photolysis and the formation of hydroperoxides could be the cause of the plateau observed after 500 s irradiation.
Identical oxidation processes were observed for methyl elaidate. However, the reaction rate was slower compared to MO (see Fig. SI.2 in ESI†). These results could be explained by the presence of methyl linoleate in MO sample, which could accelerate the (hydro)peroxide formation rate as described by other scientists.20,22
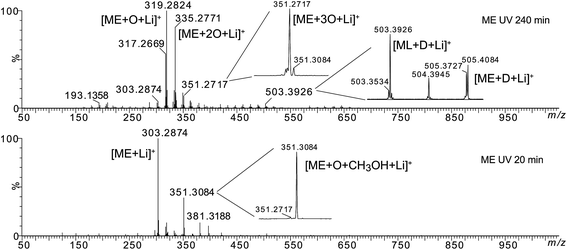
Then, high resolution mass spectrometry analysis of the irradiated fatty esters solubilized into a LiI solution was carried out in order to confirm or determine the structure of the different oxidized products. Fig. 5 presents the mass spectra of ME after different irradiation times under air (see Fig. SI.3 in ESI† for MO). Table 1 lists the main products identified by ESI-MS experiments and Fig. 6 depicts some of possible chemical structures.
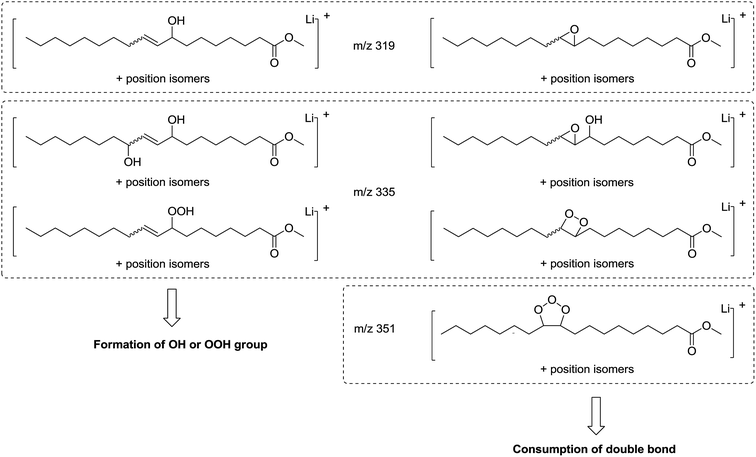 | ||
| Fig. 6 Possible chemical structures of molecular ions at m/z 319, 335 and 351 resulting from methyl oleate oxidation. | ||
Some oxidation products of MO and ME were detected at m/z 319.2824, m/z 335.2771, m/z 351.2717 and labeled as [M + O + Li]+ (with M = MO or ME), [M + 2O + Li]+, and [M + 3O + Li]+, respectively, according to West et al.23 The abundance of these ions increased as a function of irradiation time. The m/z 319.2824 corresponds to the lithium adduct of mono-oxidized ester while m/z 335.2771 could correspond to hydroperoxide24–26 and m/z 351.2717 to trioxidized ester, either in monozonide or trioxolan form (Fig. 6). Trioxidized species could result from ozonolysis of the unsaturated fatty esters. Indeed, the singlet oxygen 1O2 resulting from the photodecomposition of hydroperoxides can react under UV with the triplet oxygen 3O2 to produce O3.27–33 Note that the high resolving power of the time of flight instrument operating in the W reflectron mode permitted to separate the m/z 351.2717 ion which is a low-abundant species and the lithium adduct of the side product at m/z 351.3084 previously described. Bishydroxyperoxide ions were too low-abundant species to be discussed.
The MS/MS spectrum of m/z 335.2771 shows product ions at m/z 317.2669 and m/z 299.2568 resulting from the loss of one or two H2O molecules, respectively, but also product ion at m/z 303.2874 which results from the loss of an O2 molecule (Fig. SI.4 in ESI†). More interestingly, the product ions m/z 207.1504, m/z 193.1358 and m/z 179.1205 correspond to C11H20LiO3, C10H18LiO3 and C9H16LiO3, i.e. to lithium adducts of methyl 10-oxodecanoate, methyl 9-oxononanoate and methyl 8-oxooctanoate, respectively. Such results indicate that m/z 335.2771 was a mixture of isomers of either diol or hydroperoxide structures (Fig. SI.4b in ESI†) and that oxidation more probably occurred on the C10, C9 and C8 atoms of the fatty chain.
The MS/MS spectrum of m/z 351 (which is a relatively low-abundance ion) shows abundant product ions at m/z 319.2824 and m/z 301.2719 resulting from the successive losses of CH3OH and H2O molecules (data not shown). Note that this MS/MS spectrum presents the product ions of both precursors m/z 351.2717 [M + 3O + Li]+ and m/z 351.3084 [M + O + CH3OH + Li]+. Indeed, these isobaric species cannot be separated by quadrupole selection. The loss of H2O can arise from either the trioxidized ester and/or of the side-product. On the other hand, the loss of methanol is more probable from the side product.
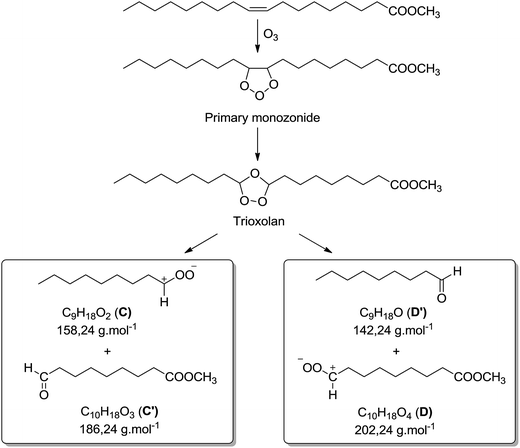
Besides the series of m/z 319.2824, m/z 335.2771 and m/z 351.2717, other photo-oxidized fatty esters corresponding to lithium adducts of oxidized linoleate were detected at m/z 317.2669 and m/z 333.2618 (Fig. 5). Then, low-abundance ions appeared in the m/z 450 to 650 range of the mass spectra (Fig. 5). Most of them could be attributed to aggregates generated in the ESI source. Indeed, these dimers gave the corresponding monomer lithium adducts when LC-MS/MS analyses were performed (data not shown). However, few of them were confidently attributed to covalent structures between methyl ester (MO/ME (m/z 505.4084) or ML (m/z 503.3926)) and zwitterion D as confirmed by MS/MS analyses (see Fig. SI.5 in ESI† for m/z 505). Indeed, trioxolan species can decompose into several zwitterions and aldehydes (depicted in Fig. 7). It can also be noticed on the 1H NMR spectra a singlet at 9 ppm that could be attributed to aldehyde proton.
Comparing ME and MO sample reactivity (Fig. 5 and SI.3†), we note that more products were formed and that reaction rate was higher in the case of MO for the reason previously mentioned (presence of methyl linoleate).
Thus, both techniques permitted to observe photo-oxidation products of unsaturated fatty esters under UV and air, in accordance with literature:23–26 hydroperoxides (m/z 335.2771 and m/z 333.2618), mono-oxidized esters (m/z 319.2824 and m/z 317.2669) which could be hydroxylated or epoxidized ME/MO and ML, well known as side oxidation products resulting from the hydroperoxide decomposition, and trioxidized esters (m/z 351.2717).33 The formation of covalent bond between unsaturated fatty ester and zwitterionic species constitutes an important point. Indeed, it is possible to envisage such intermolecular covalent coupling when photo-oxidation is transposed to triglyceride molecules. Moreover, the increase of the unsaturation degree could enhance the probability of oxidative crosslinking.
Photoinitiated thiol–ene reaction of fatty esters under air
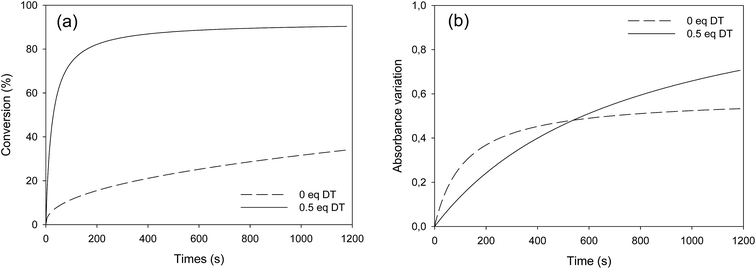
Reaction media containing methyl stearate and dodecanethiol were first submitted to UV irradiation. As expected, no product of thiol addition was detected using either IR, ESI-MS or GC-MS, meaning that saturated methyl ester did not react with dodecanethiol (DT). Then, MS and IR investigations were performed on methyl fatty esters (MO or ME) irradiated in the presence of 0.5 equivalent DT (conditions for reaching fatty double bond conversion higher than 80%).4 Although an absorption band corresponding to the S–H bond at 2550 cm−1 can be observed on the IR spectra, its low intensity did not allow accurately calculating the thiol conversion. Nonetheless, its entire consumption was observed in the whole following experiments after 5 min of irradiation. Hence, only the double bond conversion kinetics and the OH absorbance variation were presented here. Besides, as similar kinetics was observed in aerated and laminated conditions, only experiments carried out under air are presented Fig. 8.As expected, double bond consumption was faster in the presence of dodecanethiol, compared to our previous results obtained on the sole unsaturated fatty esters (Fig. 8a). Nonetheless, the comparison of the OH absorbance variation curves obtained with and without dodecanethiol shows a competition between the oxidation and the thiol–ene addition (Fig. 8b). This competition seems in favor to the oxidation addition at the beginning of the reaction. After 10 min irradiation, the thiol–ene prevailed. For ME, the same competition could be observed even though less pronounced (see Fig. SI.6 in ESI†).
GC-MS analyses of irradiated reaction media (MO or ME with DT) show, depending on reaction time, the presence of unreacted methyl esters (m/z 296.2787, tR 17.8 min), unreacted DT (RSH, m/z 202.1757, tR 11.9 min), oxidized DT (RS-SR m/z 402.3375, tR 27.3 min) and the expected thiol–ene adduct (m/z 498.4426, tR 27.3 min) (see Fig. SI.7a in ESI† for ME). These identifications were verified by accurate mass measurements. The EI mass spectra shows that the thiol–ene adduct was a mixture of two regioisomers with the sulfur atom linked to either the 9 or the 10 carbon of the fatty chain (see Fig. SI.7b in ESI†). Characteristic fragment ions of the 1st regioisomer (m/z 341 and m/z 371 for C9 branching) and of the 2nd regioisomer (m/z 327 and m/z 385 for C10 branching) correspond to α-cleavages from M+˙ when charge (and odd electron) is localized on sulfur atom, in accordance with previous data.34 Note that in our chromatographic conditions, the two regioisomers were only partially separated as shown in the extracted ion chromatograms in Fig. SI.7a.†
ESI-MS analyses of the irradiated thiol/ene formulation solubilized in the LiI solution were carried out in order to characterize this competition. Fig. 9 presents ESI-MS spectra of the reaction medium containing ME with dodecanethiol after different irradiation times (see Fig. SI.8 in ESI† for methyl oleate).
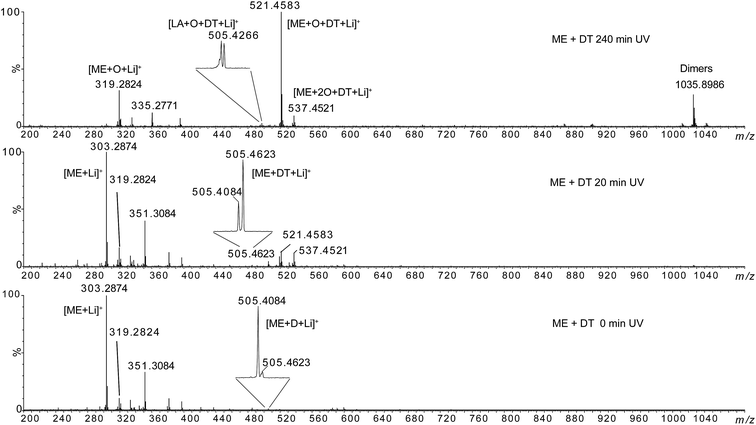 | ||
| Fig. 9 HRMS spectra of methyl elaidate + 0.5 eq. dodecanethiol at 0 min, 20 min and 240 min UV irradiation. | ||
The lithium adducts of the mono- and di-oxidized (m/z 319.2824 and m/z 335.2771) or non oxidized (m/z 303.2874) fatty esters were observed. The abundance of m/z 303.2874 decreased when irradiation time increased while the abundance of oxidized forms increased. Then, we can note the emergence of ions at m/z 505.4623, m/z 521.4583 and m/z 537.4521 after 20 min irradiation, the m/z 521.4583 becoming the most abundant species at 60 min irradiation. The elemental composition of these ions was consistent with thiol–ene adducts (Table 1): m/z 505.4623 could correspond to the expected adduct [ME + DT + Li]+ while m/z 521.4583 and m/z 537.4521 were consistent with photoadducts of mono- ([ME + O + DT + Li]+) and di-oxidized esters ([ME + 2O + DT + Li]+). Note that besides m/z 505.4623, two other ions of low-abundance could be detected at m/z 505.4084 and m/z 505.4266 (insets of Fig. 9 and Table 1). These ones could correspond to the covalent adduct of methyl ester and zwitterion D [ME + D + Li]+ (m/z 505.4084) (C29H54LiO6) (Fig. SI.5b†), and to the thiol–ene adduct of residual oxidized linoleic acid and dodecanethiol [LA + O + DT + Li]+ (m/z 505.4266) (C30H58LiO3S), respectively. The thiol–ene adduct between residual oxidized oleic acid and dodecanethiol [OA + O + DT + Li]+ (C30H60LiO3S) was also detected at m/z 507.4421, confirming that thiol–ene addition can occur on oxidized fatty acids. Note that the relative abundance of these ions varied with irradiation time (insets of Fig. 9). Thus, m/z 505.4623 became the most abundant ion at 20 min irradiation for ME. In addition, oxidation of thiol–ene adduct can explain the decrease of m/z 505.4623 relatively to m/z 505.4266. Thiol–ene adducts of oxidized linoleate were very low-abundant species that were detected at m/z 519.4423 and m/z 535.4373 (Table 1). Lastly, note that ions of high m/z values (such as m/z 1035.8986) corresponded to non-covalent dimer species formed during the ESI process as verified by LC-ESI-MS experiments (for example, the extracted ion chromatograms of m/z 1035.8986 and m/z 521.4583 were superimposed (data not shown)).
Then, MS/MS analyses of m/z 505.4623, m/z 521.4583 and m/z 537.4521 were carried out (see Fig. SI.9 in ESI†). In the case of the m/z 505.4, ion mobility separation before the collision activation was required to achieve specific MS/MS analysis. Indeed, isobaric m/z 505.4266 and m/z 505.4623 ions cannot be separated by the quadrupole mass analyser used for ion selection (see Experimental section for details). The MS/MS spectrum of m/z 505.4623 shows exclusively product ion at m/z 303.2874 corresponding to C12H26S loss while MS/MS spectra of m/z 521.4583 and m/z 537.4521 shows 218 u (C12H26SO) and 168 u (C12H24) losses.
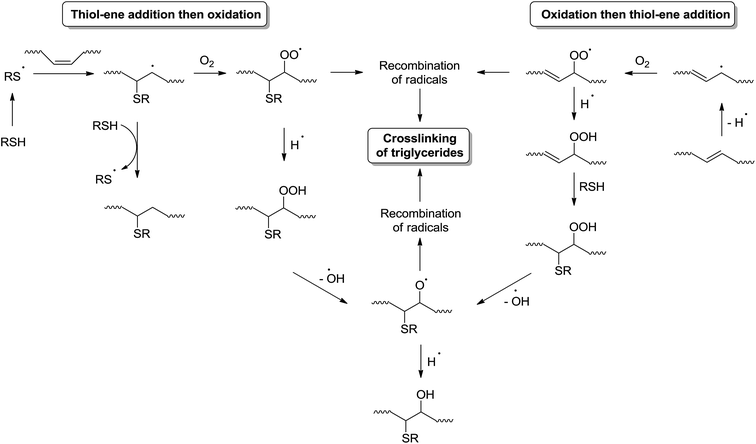
All these dissociation patterns confirm the thiol–ene addition onto non oxidized and also oxidized fatty ester. So thiol–ene addition and oxidation could well concomitantly exist, as summarized in Fig. 10.
Conclusions
Photo-oxidation and photoinitiated thiol–ene addition applied to fatty unsaturated esters were investigated. Complementary infrared spectroscopy and mass spectrometry analyses show that numerous possible reactions involving fatty esters, thiol molecule and oxygen could occur. Besides the expected classical thiol–ene addition, oxidation of the fatty moieties could occur during the photochemical step. Thus, peroxydation could take place directly on unsaturated fatty molecules as well as on thiol–ene adducts, whereas thiol–ene addition could also occur directly on unsaturated fatty acid or on oxidized fatty moieties. In addition, the recombination of peroxyl radicals as well as the reaction between intermediate zwitterionic species (coming from fatty double bond ozonolysis) and fatty moieties could explain the formation of intermolecular covalent bonds between fatty esters. It could be noticed that no propagation of the radical thiol–ene addition to fatty double bonds was highlighted. Nonetheless, extending all these results to vegetable oils, the identified reactions could be responsible of the triglycerides crosslinking during the photoinitiated thiol–ene process, even in the presence of a monothiol. Finally, the pre-oxidation of triglycerides could be beneficial to prepare coatings by the thiol–ene process.Acknowledgements
We thank the Labex SynOrg (ANR-11-LABX-0029), the European Regional Development Fund (ERDF 31708) and the French Government (MESR fellowship) for financial support.Notes and references
- S. Caillol, M. Desroches, S. Carlotti, R. Auvergne and B. Boutevin, Green Mater., 2013, 1, 16 CrossRef CAS.
- P. Alagi, Y. J. Choi, J. Seog and S. C. Hong, Ind. Crops Prod., 2016, 87, 78 CrossRef CAS.
- U. Bexell, M. Olsson, M. Johansson and P. Sundell, Surf. Coat. Technol., 2003, 166, 141 CrossRef CAS.
- Y. H. Zhao, D. Vuluga, L. Lecamp and F. Burel, Prog. Org. Coat., 2016, 101, 216 CrossRef CAS.
- M. Desroches, S. Caillol, V. Lapinte, R. Auvergne and B. Boutevin, Macromolecules, 2011, 44, 2489 CrossRef CAS.
- M. Desroches, S. Caillol, R. Auvergne and B. Boutevin, Eur. J. Lipid Sci. Technol., 2012, 114, 84 CrossRef CAS.
- M. Ionescu, D. Radojcic, X. Wan, Z. S. Petrovic and T. A. Upshaw, Eur. Polym. J., 2015, 67, 439 CrossRef CAS.
- G. B. Bantchev, J. A. Kenar, G. Biresaw and M. G. Han, J. Agric. Food Chem., 2009, 57, 1282 CrossRef CAS PubMed.
- J. Justynska, Z. Hordyjewicz and H. Schlaad, Polymer, 2005, 46, 12057 CrossRef CAS.
- O. Zovi, L. Lecamp, C. Loutelier-Bourhis, C. M. Lange and C. Bunel, Eur. J. Lipid Sci. Technol., 2011, 113, 616 CrossRef CAS.
- D. Oursel, C. Loutelier-Bourhis, N. Orange, S. Chevalier, V. Norris and C. M. Lange, Rapid Commun. Mass Spectrom., 2007, 21, 1 CrossRef PubMed.
- O. Zovi, L. Lecamp, C. Loutelier-Bourhis, C. M. Lange and C. Bunel, Green Chem., 2011, 13, 1014 RSC.
- K. Giles, S. D. Pringle, K. R. Worthington, D. Little, J. L. Wildgoose and R. H. Bateman, Rapid Commun. Mass Spectrom., 2004, 18, 2401 CrossRef CAS PubMed.
- S. E. Slade, K. Thalassinos, R. H. Bateman, M. T. Bowers and J. H. Scrivens, Int. J. Mass Spectrom., 2007, 261, 1 CrossRef.
- K. Peter, C. Vollhardt and N. E. Schore, Traité de chimie organique, De Boeck, 4th edn, 1990, p. 639 Search PubMed.
- J. H. Gross, Mass Spectrometry – A Textbook, Springer, 2nd edn, 2011, p. 198 Search PubMed.
- A. Greer, Acc. Chem. Res., 2006, 39, 797 CrossRef CAS PubMed.
- F. Bosca, M. A. Miranda, I. M. Morera and A. Samadi, J. Photochem. Photobiol., B, 2000, 58, 1 CrossRef CAS.
- A. W. Girotti, Photochem. Photobiol., 1990, 51, 497 CrossRef CAS PubMed.
- J. Regensburger, T. Maisch, A. Knak, A. Gollmer, A. Felgenträger, K. Lehner and W. Bäumler, Phys. Chem. Chem. Phys., 2013, 15, 17672 RSC.
- J. Regensburger, A. Knak, T. Maisch, L. Landthaler and W. Bäumler, Exp. Dermatol., 2011, 21, 135 CrossRef PubMed.
- D. A. Pratt, K. A. Tallman and N. A. Porter, Acc. Chem. Res., 2011, 44, 458 CrossRef CAS PubMed.
- R. E. West, R. K. Marvin, K. Hensley and D. Isailovic, Int. J. Mass Spectrom., 2014, 372, 29 CrossRef CAS.
- D. B. Min T. H. Smouse, Flavor chemistry of fats and oils, Am. Oil Chem. Soc., Champaign, IL, 1985, p. 1 Search PubMed.
- A. M. Wilcox and L. J. Marnett, Chem. Res. Toxicol., 1993, 6, 413 CrossRef CAS PubMed.
- G. G. Pereira, R. M. Alberici, G. D. Fernandes, I. B. S. Cunha, M. N. Eberlin, M. C. Dobarganes, R. J. Daroda and D. Barrera-Arellano, Eur. J. Lipid Sci. Technol., 2014, 116, 952 CrossRef CAS.
- W. W. Christie, Lipid Analysis, The Oil Press, Bridgewater, UK, 3rd edn, 2003 Search PubMed.
- E. N. Frankel, R. F. Garwood, B. P. S. Khambay, G. P. Moss and B. C. L. Weedon, J. Chem. Soc., Perkin Trans. 1, 1984, 1, 2233 RSC.
- L. Rebrovic, J. Am. Oil Chem. Soc., 1992, 69, 160 CrossRef.
- O. Vesna, S. Sjogren, E. Weingartner, V. Samburova, M. Kalberer, H. W. Gäggeler and M. Amman, Atmos. Chem. Phys., 2008, 8, 4683 CrossRef CAS.
- S. Warwell and M. R. Klaas, Lipid Technol., 1997, 9, 10 Search PubMed.
- S. T. Bairai and D. H. Stedman, J. Geophys. Res.: Atmos., 1992, 97, 109 Search PubMed.
- S. H. J. Brown, T. W. Mitchell and S. J. Blanksby, Biochim. Biophys. Acta, 2011, 1811, 807 CrossRef CAS PubMed.
- A. Sammaiah, K. V. Padmaja and R. B. N. Prasad, Eur. J. Lipid Sci. Technol., 2016, 118, 495 CrossRef CAS.
Footnote |
| † Electronic supplementary information (ESI) available. See DOI: 10.1039/c6ra25633c |
| This journal is © The Royal Society of Chemistry 2017 |


