 Open Access Article
Effect of uniaxial pre-stretching on the microstructure and mechanical properties of poly[(ethylene oxide)-block-(amide-12)]-toughened poly(lactic acid) blend†
Yunjing Chenab,
Lijing Han*a,
Zonglin Liac,
Junjun Kongac,
Dandan Wuac,
Zengwen Caoab and
Lisong Dong*a
aKey Laboratory of Polymer Ecomaterials, Changchun Institute of Applied Chemistry, Changchun 130022, China. E-mail: ljhan@ciac.ac.cn; dongls@ciac.ac.cn
bUniversity of Science and Technology of China, Hefei, Anhui 230026, China
cUniversity of Chinese Academy of Sciences, Beijing 10080, China
First published on 3rd January 2017
Abstract
Highly oriented poly(lactic acid) (PLA)/20 wt% poly[(ethylene oxide)-block-(amide-12)] (PEBA) blends were prepared via uniaxial pre-stretching technology at 60 °C and 25 °C to improve the mechanical properties of PLA. For the pre-stretching process at 60 °C, the tensile strength and modulus of the pre-stretched PLA/PEBA blend dramatically increased with the increasing pre-stretching ratio (PSR), whereas the elongation at break for all the pre-stretched specimens was much higher than that of the neat PLA, suggesting that PEBA had an excellent toughening effect for PLA under uniaxial pre-stretching. The integrated morphological and structural analyses based on scanning electron microscopy (SEM) and wide-angle X-ray diffraction (WAXD) indicated that the amorphous PLA phase started to develop orientation, mesophase, and even defective α crystal as parts of the key structure from the strengthening and stiffening effect by pre-stretching. Compared to the pre-stretching process at 60 °C, the strengthening and stiffening effect was abated for the blend pre-stretched at 25 °C. Moreover, the elongation at break significantly decreased with the increasing PSR, indicating that the pre-stretched blend in the hot pre-stretching process (60 °C) had more outstanding toughness than that in the cold pre-stretching process (25 °C). The possible reason for this is that the crack and pore defects formed during the pre-stretching process at 25 °C severely restricted the improvement of the mechanical properties of the blend. The thermal behavior of the pre-stretched blend tested by differential scanning calorimetry (DSC) showed that on increasing the PSR, glass transition temperature increased, cold-crystallization temperature decreased, and the degree of crystallinity increased, which further demonstrated the formation of the orientation or crystallization by pre-stretching.
Introduction
Poly(lactic acid) or polylactide (PLA) is a thermoplastic aliphatic polyester derived from 100% renewable resources, such as corns and sugar beets.1 In the emerging bioplastics market, PLA has long been attractive due to its renowned merits of excellent biocompatibility and biodegradability, coupled with a high strength and modulus, and good processability.2,3 For these reasons, it offers great promise in a wide range of commodity applications, such as in biomedical materials4 and packaging applications.5,6In spite of its favorable properties, the inherent brittleness of PLA, in essence, the relatively short chains, and rigid chain backbone, limits most common plasticity mechanisms, therefore, prevents it from achieving a large ductile behavior,7 which greatly blocks its range of applications. In this context, the toughening of PLA has been studied for a long time and several approaches, including copolymerization, plasticization, and blending with flexible polymers, have been developed to modify PLA to introduce adequate ductility. In general, blending with elastomers is a more practical and economic way among these common methods. It has been reported that PLA was blended with various materials, such as rubbers,8 poly(butylene succinate) (PBS),9 poly(ε-caprolactone) (PCL),10 poly(butylene adipate-co-terephthalate) (PBAT),11 and PEBA.12 However, most of the added polymers are derived from the non-renewable resources and do not exhibit biocompatibility, which clearly limits the environmental and biomedical applications of these blends. Moreover, the toughened PLA blends were found to have only a limited promotion of ductility, but with greatly reduced strength and stiffness. Hence, there is an imperative demand for the ideal combination of strength, stiffness, and ductility.
It is known that the mechanical properties of the polymers can be significantly enhanced through the stretching processes.13–17 For PLA, Maspoch et al.18 and Wu et al.19 previously reported that the mechanical properties of drawn PLA films, including the modulus, tensile strength, and elongation at break, were simultaneously improved compared with the undrawn films. More recently, Jariyasakoolroj et al.20 clarified that the isotropically small crystalline lamellae formed in the biaxial stretching process was the key microstructure to obtain PLA with excellent performance (180 MPa tensile strength and 80% elongation at break). Moreover, Feng et al.21 and Zhao et al.22 found that the tensile strength and modulus of the highly oriented poly(lactic acid) (PLA)/thermoplastic polyurethane (TPU) blend obtained by a solid hot stretching process were significantly improved, providing an effective method to strengthen the ductile PLA blend.
Naturally, this stimulated us to apply the stretching process for the improvement of strength and stiffness of a toughened PLA blend. In our previous study, PEBA, a biocompatible thermoplastic elastomer, which can be derived from renewable resources, including castor oil, and can be used as a toughening agent for brittle thermoplastic polymers due to its high impact resistance,23 was used as a toughening agent for PLA, and we successfully prepared a PLA blend with high toughness.12 In the present study, the PLA/PEBA blend, containing 20 wt% PEBA, was pre-stretched at the rubbery state (pre-stretching temperature Tps = 60 °C) as well as the glassy state (Tps = 25 °C) for the purpose of further improving the mechanical properties of the blend. Moreover, the microstructure, crystallization behavior, and thermal properties were determined to establish a relationship between the microstructure and the mechanical properties. These new insights helped us to understand the microstructure of the drawn PLA/PEBA blend and its consequent mechanical properties, which enabled us to obtain a PLA/PEBA blend with the desired mechanical properties by simply controlling the processing conditions, thereby allowing us to extend the application of the PLA/PEBA blend.
Experimental
Materials
The PLA used in the present study was the 4032D grade material from Natureworks LLC (USA) consisting of 98% L-lactic acid and 2% D-lactic acid. It exhibited a weight-average molecular weight of 207![[thin space (1/6-em)]](https://www.rsc.org/images/entities/char_2009.gif) 000 g mol−1 and a dispersity of 1.74 (gel permeation chromatography analysis, Waters 410 Gel permeation chromatograph with THF as the fluent (flow rate: 1 mL min−1 at 35 °C) and polystyrene standards as the reference for the molecular weight calculations). The PEBA (Pebax 1074) with poly(ethylene oxide) (PEO) and polyamide-12 (PA12) blocks, available in granular form, was kindly supplied by Elf Atochem (France). It contained 55 wt% PEO blocks and 45 wt% PA12 blocks.24
000 g mol−1 and a dispersity of 1.74 (gel permeation chromatography analysis, Waters 410 Gel permeation chromatograph with THF as the fluent (flow rate: 1 mL min−1 at 35 °C) and polystyrene standards as the reference for the molecular weight calculations). The PEBA (Pebax 1074) with poly(ethylene oxide) (PEO) and polyamide-12 (PA12) blocks, available in granular form, was kindly supplied by Elf Atochem (France). It contained 55 wt% PEO blocks and 45 wt% PA12 blocks.24
Preparation of the pre-stretched PLA/PEBA blend
Characterization
| ρ (g cm−3) = ρw (g cm−3) × [m/(m − mw)] | (1) |
Results
Mechanical properties of the ps-PLA/PEBA blend
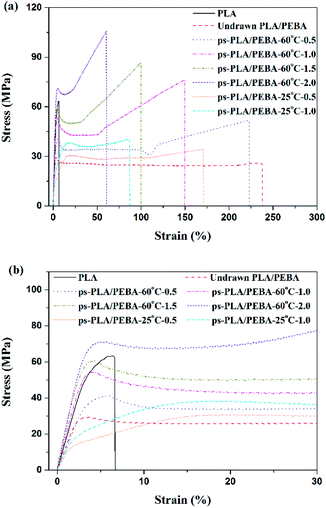
Fig. 1 shows the tensile stress–strain curves of neat PLA, the undrawn PLA/PEBA blend, and the ps-PLA/PEBA blend obtained at 60 °C and 25 °C. The corresponding data for the mechanical properties are listed in Table 1. Generally, neat PLA was rigid and brittle with a strength at break ∼65 MPa, a Young's modulus ∼1.7 GPa, and ∼5% elongation at break. In addition, no distinct yield point appeared before failure upon the tensile load. However, the undrawn PLA/PEBA blend exhibited a long, cold draw plateau with an obvious yield and neck formation. More importantly, the addition of 20 wt% PEBA significantly improved the toughness of PLA but weakened the strength and stiffness, which could be attributed to the toughening effect of PEBA on PLA. When the PLA/PEBA blends were pre-stretched at 60 °C with various PSRs, their tensile stress–strain curves showed a typical deformation behavior of the polymers, including yielding, neck growth, and strain hardening. Moreover, the neck growth behavior became much weaker with the increasing PSR, and it was then too faint to be observed when the PSR reached 2.0. As expected, the strength and stiffness of the ps-PLA/PEBA blend were obviously enhanced and the toughness still remained at a high level, as shown in Fig. 1 and Table 1. In detail, the strength at yielding and break, as well as the modulus increased from 34.4 MPa, 28.4 MPa, and 1279 MPa for the undrawn blend to 68.8 MPa, 100 MPa, and 2370 MPa for the pre-stretched blend when the PSR was up to 2.0, which increased by 100%, 252%, and 85%, respectively. However, the elongation at break decreased from the maximum 229–60%, which was still greater than that of neat PLA. These results revealed that for the flexible PLA/PEBA blend, the larger the PSR, the more distinct the strengthening and stiffening effect. In addition, the toughness was still maintained at a high level, even for the super-reinforced ps-PLA/PEBA blend.| Sample | PSR | Strength at yielding (MPa) | Strength at break (MPa) | Modulus (MPa) | Elongation at break (%) | Total elongation (%) |
|---|---|---|---|---|---|---|
| Undrawn PLA/PEBA | — | 31.8 ± 0.9 | 26.8 ± 1.2 | 1279 ± 34 | 229 ± 20 | 229 ± 20 |
| Ps-PLA/PEBA-60 °C | 0.5 | 41.8 ± 1.0 | 53.6 ± 1.1 | 1196 ± 154 | 225 ± 5 | 388 ± 5 |
| 1.0 | 53.4 ± 0.9 | 76.7 ± 0.8 | 1878 ± 61 | 148 ± 2 | 396 ± 2 | |
| 1.5 | 57.5 ± 1.4 | 83.8 ± 2.5 | 2135 ± 170 | 95 ± 6 | 388 ± 6 | |
| 2.0 | 68.8 ± 2.2 | 100.0 ± 2.0 | 2370 ± 145 | 60 ± 1 | 380 ± 1 | |
| Ps-PLA/PEBA-25 °C | 0.5 | 31.3 ± 0.8 | 31.2 ± 3.0 | 766 ± 192 | 123 ± 47 | 234 ± 47 |
| 1.0 | 37.8 ± 0.4 | 37.3 ± 3.0 | 1075 ± 5 | 62 ± 26 | 224 ± 26 |
The pre-stretching process was also performed at 25 °C to further explore the influence of Tps on the mechanical properties of the PLA/PEBA blend. It can be observed that the modulus and the strength at yielding and at break of the ps-PLA/PEBA blend pre-stretched at 25 °C increased with the increasing PSR, however, the increasing range was smaller than that of the samples pre-stretched at 60 °C, as depicted in Table 1. Note that the elongation at break of the ps-PLA/PEBA blend dramatically decreased to 62% when the PSR was only 1.0, which was close to that of the samples pre-stretched at 60 °C with PSR = 2.0, indicating that the ps-PLA/PEBA blend in the hot pre-stretching process (Tps = 60 °C) had more outstanding toughness than that from the cold pre-stretching process (Tps = 25 °C). The total elongation (εt) of the pre-stretched blends, combining the elongation results both of the pre-stretching process and the tensile test, is listed in Table 1, such that we can give a comprehensive assessment of the toughness of the materials. Furthermore, it is defined as follows:
| εt = [(1 + PSR)(1 + εb/100) − 1] × 100 | (2) |
| εb = (100 + εt)/(1 + PSR) − 100 | (3) |
Fig. 2 shows the variation of the elongation at break with the PSR and the fitting data for them at 60 °C and 25 °C. This shows that the elongation at break is proportional to 1/(1 + PSR) for all the samples, and the whole toughness of the materials pre-stretched at different temperatures could be determined from the slope of the linear relationship, for example, (514–100%), i.e., 414% for 60 °C and (330–100%), i.e., 330% for 25 °C, which is approximate to the total elongation listed in Table 1. Therefore, this linearity might be helpful to prepare a desire PLA/PEBA blend with high strength and stiffness, as well as good toughness. In summary, hot pre-stretching at 60 °C is an effective method to improve the mechanical properties of the PLA/PEBA blend.
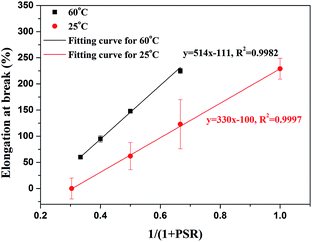 | ||
| Fig. 2 Elongation at break of the ps-PLA/PEBA blend pre-stretched at different temperatures as a function of 1/(1 + PSR). | ||
Morphology of the ps-PLA/PEBA blend
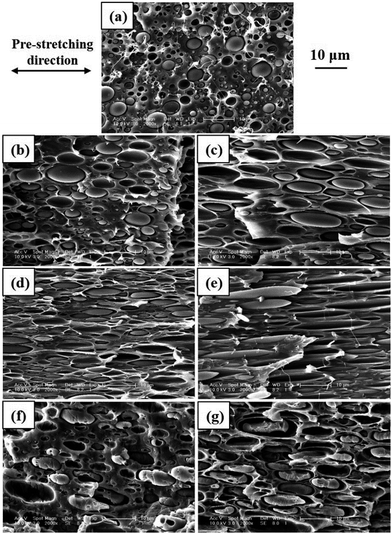
The cross-sectional morphology of the PLA/PEBA blend pre-stretched with varying PSRs at 60 °C and 25 °C are shown in Fig. 3. It can be seen that all the PLA/PEBA blends showed a clear, phase-separated morphology, which indicated that the blends were immiscible. The immiscibility of the PLA/PEBA blend could also be demonstrated by two distinct glass transitions in the tan![[thin space (1/6-em)]](https://www.rsc.org/images/entities/char_2009.gif) δ curves, one for PEBA at approximately −45 °C and the other for PLA at approximately 68 °C, which was the same as that for the neat sample (see Fig. S2 in ESI†). However, the sub-micron and micron dispersion of the PEBA minor phase in the PLA matrix revealed the good compatibility of the PLA/PEBA immiscible system, which may be responsible for the significant increase in the toughness of PLA.12,25 From Fig. 3(a), the undrawn PLA/PEBA blend did not show any specific orientation. However, when the blends were pre-stretched at 60 °C, the longitudinal fracture surfaces of them exhibited uniform orientation structures parallel to the pre-stretching direction, including the oriented PLA matrix and elongated PEBA minor phase. On increasing the PSR, the orientation structures were more evident. As already reported, it is the high degree of orientation that contributes to the significantly improved tensile strength and modulus of the blends.18,19,21,22 For the blends pre-stretched at 25 °C, the orientation structures also gradually developed with the increasing PSR. However, a debonding process took place at the same time, leading to an obvious phase-separation, which was faint at Tps = 60 °C. Note that that the crack and pore defects were discovered in the PLA matrix and PEBA phase resulting from the weak deformation ability of PLA and PEBA in the glassy state, as shown in Fig. 3(f) and (g). This phenomenon will be further confirmed by the density analysis in the following section. Just because of the obvious phase-separation and the crack and pore defects, the blends pre-stretched at 25 °C showed a decreased tensile strength, modulus, and elongation at break compared to those of the blends pre-stretched at 60 °C with the same PSR.
δ curves, one for PEBA at approximately −45 °C and the other for PLA at approximately 68 °C, which was the same as that for the neat sample (see Fig. S2 in ESI†). However, the sub-micron and micron dispersion of the PEBA minor phase in the PLA matrix revealed the good compatibility of the PLA/PEBA immiscible system, which may be responsible for the significant increase in the toughness of PLA.12,25 From Fig. 3(a), the undrawn PLA/PEBA blend did not show any specific orientation. However, when the blends were pre-stretched at 60 °C, the longitudinal fracture surfaces of them exhibited uniform orientation structures parallel to the pre-stretching direction, including the oriented PLA matrix and elongated PEBA minor phase. On increasing the PSR, the orientation structures were more evident. As already reported, it is the high degree of orientation that contributes to the significantly improved tensile strength and modulus of the blends.18,19,21,22 For the blends pre-stretched at 25 °C, the orientation structures also gradually developed with the increasing PSR. However, a debonding process took place at the same time, leading to an obvious phase-separation, which was faint at Tps = 60 °C. Note that that the crack and pore defects were discovered in the PLA matrix and PEBA phase resulting from the weak deformation ability of PLA and PEBA in the glassy state, as shown in Fig. 3(f) and (g). This phenomenon will be further confirmed by the density analysis in the following section. Just because of the obvious phase-separation and the crack and pore defects, the blends pre-stretched at 25 °C showed a decreased tensile strength, modulus, and elongation at break compared to those of the blends pre-stretched at 60 °C with the same PSR.
WAXD of the ps-PLA/PEBA blend
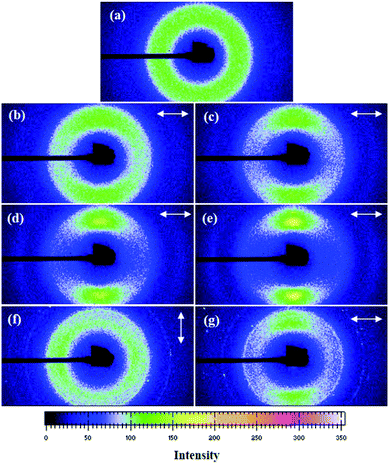
To understand the structure evolution with the dramatic property changes of the PLA/PEBA blend, WAXD measurements were performed on these pre-stretched PLA/PEBA blends. Fig. 4 displays the 2D-WAXD patterns of the undrawn PLA/PEBA blend and the ps-PLA/PEBA blend pre-stretched with various PSRs, whereas the corresponding WAXD intensity profiles are shown in Fig. 5. It can be seen from Fig. 4(a) that the diffuse halo of the 2D-WAXD pattern is isotropic, indicating that the undrawn PLA/PEBA blend was nearly amorphous and there was no oriented structure in it.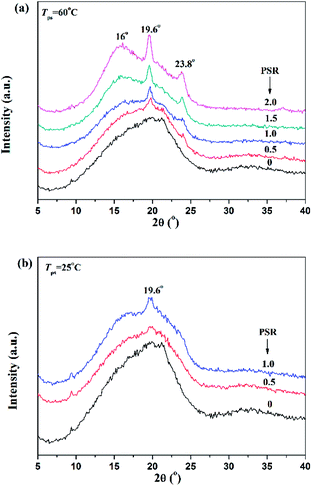 | ||
| Fig. 5 WAXD intensity profiles of the PLA/PEBA blend before and after the pre-stretching process with various PSRs at (a) 60 °C and (b) 25 °C. | ||
When the blends were pre-stretched at 60 °C, an obvious intensity increase of the inner broad diffraction on the meridian and a concomitant intensity decrease on the equator gradually developed with the increasing PSR, suggesting that the amorphous phase was oriented step by step during the pre-stretching process. Note that the diffraction halo of the amorphous phase gradually developed into a pair of broad diffraction arcs on the meridional position at a PSR of around 1.0, which was the sign of the appearance of the mesophase with an intermediate ordering state between the crystalline state and the amorphous state, as already reported by Stoclet et al.26 and Wang et al.27 On further increasing the PSR, a pair of broad arcs were steadily concentrated in the meridional direction and no Debye–Scherrer rings for the crystals were observed. However, a pair of weak diffraction spots appeared among the diffraction arcs of the mesophase in the meridional direction at PSR = 1.5, which suggested that the diffraction due to the oriented incomplete crystals of α-form were buried or hidden in the broad diffraction. When the PSR was up to 2.0, the diffraction of the spots was more intense and a pair of short and narrow arcs appeared outside the spots, indicating that the degree of crystallinity increased with the increasing PSR.
Detailed information about the crystals could be obtained from the intensity profiles of the WAXD plots presented in Fig. 5(a). It can be seen that the undrawn PLA/PEBA blend showed a broad diffraction pattern, which was assigned to the amorphous phase, with two weak diffraction peaks at around 19.6° and 21.3°, which are characteristic of the defective α-form crystal (α′-form crystal) in PLA and the crystalline PA phases in PEBA, respectively.28,29 In addition, the weak diffraction peak at 21.3° was negligible after the pre-stretching process. For the ps-PLA/PEBA blend, a broad amorphous phase with two sharp diffraction peaks at 19.6° and 23.8° was observed. These peaks are ascribed to the incomplete crystal of the α-form of PLA.28,30 With an increase in PSR, the intensity of the diffraction peaks for the defective α-form crystal was enhanced, whereas the amorphous phase was decreased stepwise. Furthermore, a slight and broad diffraction peak at 16°, belonging to the mesophase, appeared when the PSR was around 1.0, which could be further confirmed by the occurrence of the scattering contribution at 2θ = 16.2° obtained from fitting the data (Jade 6.0 peak fitting software), following the example of Stoclet et al. (see Fig. S3 in the ESI†). However, for the same PSR, a higher orientation in the amorphous phase was achieved at a lower Tps (25 °C) due to the slower chain relaxation.30 Therefore, the strain-induced crystals were more easy to form, which could be evidenced by the more concentrated broad arcs of the amorphous phase and the weak Debye–Scherrer ring in Fig. 4(g). In summary, these results suggested that the ordered domain grew with the increasing PSR and the orientation structures gradually developed into a mesophase and even defective α-form crystal, which were the key factors for the improved strength and stiffness of the ps-PLA/PEBA blend.20,31,32
Thermal behavior of the ps-PLA/PEBA blend
The pre-stretching process led to remarkable changes in the mechanical properties and microstructure of the PLA/PEBA blend, which were directly reflected in the thermal behavior. DSC measurements were performed to evaluate the influence of the pre-stretching process on the thermal behavior of the PLA/PEBA blend. The DSC thermograms of the undrawn and the ps-PLA/PEBA blend drawn at 60 °C and 25 °C are shown in Fig. 6, and the corresponding data are summarized in Table 2. The undrawn blend exhibited a glass transition at around 57.4 °C for the PLA matrix. Subsequently, a broad exothermic peak of cold crystallization within the temperature range from 85 °C to 140 °C appeared. Afterwards, double melting peaks were found while heating, which were caused by a melting–recrystallization process of the defective crystals grown as a result of cold-crystallization.33 Furthermore, the crystallinity (χc) of the undrawn sample was as small as 2.4%, indicating that the precursor was nearly amorphous.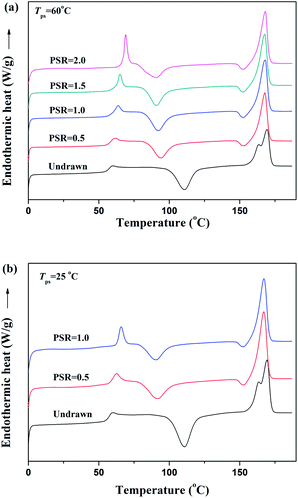 | ||
| Fig. 6 The first heating traces of the DSC thermograms for the PLA/PEBA blend before and after the pre-stretching process at (a) 60 °C and (b) 25 °C with various PSRs. | ||
| Sample | PSR | Tg (°C) | Tcca (°C) | ΔHcca (J g−1) | Tm1 (°C) | Tm2 (°C) | ΔHm (J g−1) | χcb (%) |
|---|---|---|---|---|---|---|---|---|
a Cold crystallization at a heating rate of 10 °C min−1 (first heating).b Degree of crystallinity,  , where ΔHcc and ΔHm are not corrected for the content of PLA in the blend, and , where ΔHcc and ΔHm are not corrected for the content of PLA in the blend, and  . . |
||||||||
| Undrawn PLA/PEBA | — | 57.4 | 109.2 | 26.6 | 162.9 | 169.2 | 28.4 | 2.4 |
| Ps-PLA/PEBA-60 °C | 0.5 | 58.8 | 94.4 | 26.3 | — | 167.8 | 32.2 | 7.9 |
| 1.0 | 62.3 | 92.4 | 28.3 | — | 167.9 | 36.0 | 10.3 | |
| 1.5 | 64.2 | 91.0 | 26.2 | — | 167.7 | 34.8 | 11.6 | |
| 2.0 | 68.1 | 91.2 | 24.8 | — | 168.2 | 34.7 | 13.3 | |
| Ps-PLA/PEBA-25 °C | 0.5 | 60.5 | 92.3 | 24.6 | — | 167.0 | 33.6 | 12.1 |
| 1.0 | 64.4 | 91.0 | 18.6 | — | 167.1 | 31.4 | 17.2 | |
Fig. 6(a) shows the DSC thermograms of the blend pre-stretched at 60 °C. On increasing the PSR, the glass transition temperature (Tg) of the ps-PLA/PEBA blend moved to a higher temperature as a consequence of an increase in the chain segment orientation. Note that a sharp endotherm just above the glass transition was observed at PSR = 1.0, and this became more intense and appeared at higher temperatures on increasing the PSR. This post-Tg endothermic peak has been ascribed to the melting of the mesophase with certain molecular ordering and thus its peak temperature represents the thermal stability of the mesophase.26 This is also a hint of the appearance of the mesophase at PSR = 1.0, which is in agreement with the conclusions obtained from the WAXD measurements in the preceding section. The cold-crystallization temperature (Tcc) moved to a lower temperature and its peak area became smaller after the pre-stretching process. This underlined the crystallization kinetics improvement due to the increase in the chain orientation. The double melting peak shifted to a single melting peak with the remaining Tm2 being at ∼168 °C, accompanied by a small exothermic peak for the transition of α′ to α crystal just before the melting peak.26,34,35 The DSC thermograms of PLA pre-stretched at 25 °C showed a similar evolution from the increased Tg and decreased Tcc, however, the amplitude of the variations were more obvious, indicating that the molecular chains were more ordered at lower Tps with the same PSR. Hence, the strain-induced crystals were more easily formed, as proven by the higher χc compared to that at 60 °C. However, it has already been clarified that a mesomorphic ordering of the chains gradually builds up on increasing the strain only when Tps < 75 °C.28 Herein, the formation of the strain-induced crystals may result from the nucleation of the toughening agent (PEBA) for PLA.36
Discussion
Previous results declared that the orientation or strain-induced crystals resulting from the drawing process are the key structures for enhancing the mechanical properties, such as tensile strength and modulus of the polymers.18–22,31,32 Herein, the pre-stretching process performed at different temperatures resulted in distinct mechanical changes of the PLA/PEBA blend. When the pre-stretching process was performed at 60 °C, the ps-PLA/PEBA blend exhibited an oriented PLA matrix and an elongated PEBA phase. On increasing the PSR, the orientation of an amorphous phase gradually developed, and then the mesophase and the strain-induced crystals were fabricated, as confirmed by the more and more concentrated diffraction arcs in the 2D-WAXD patterns and from the intense diffraction peak in the WAXD profiles. This consequence could also be deduced from the DSC thermograms by the increased Tg, intensified post-Tg endothermic peak, decreased Tcc, and the weakened cold-crystallization peak. It is speculated that the orientation in the amorphous phase and the strain-induced mesophase as well as the crystals are the critical factors for strengthening and stiffening the toughened-PLA. In detail, the molecular chains orient in the drawing direction after the pre-stretching process and the strength of the covalent bond in the molecular chain is far higher than that of the van der Waals forces; thus, it would need more tensile strength to snap the materials. Moreover, the well-organized molecular chains could also hinder the further extension of the cracks, resulting in an increase in the strength at the yielding and break point as well as the tensile modulus of the PLA/PEBA blend. However, at 25 °C, the orientation and strain-induced crystals were also formed during the pre-stretching process, but these occurred alongside a pronounced phase-separation as well as the formation of crack and pore defects in both the PLA and PEBA phases, which were almost invisible at 60 °C. Moreover, this result can be further confirmed by the apparent density analysis, as presented in Fig. 7. It turns out that the apparent density of the ps-PLA/PEBA blend pre-stretched at 25 °C sharply decreased on increasing the PSR, whereas the apparent density of the corresponding samples at Tps = 60 °C showed no distinct change and were thus independent of the PSR. Consequently, the phase-separation as well as the crack and pore defects formed in the cold-drawn sample hindered the improvement of the tensile strength and the modulus. Accordingly, a higher tensile strength and modulus as well as elongation at break for the pre-stretched blend were obtained at Tps = 60 °C compared to those at Tps = 25 °C.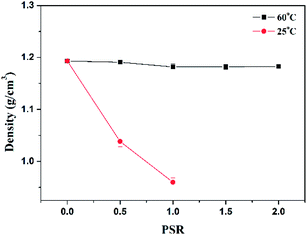 | ||
| Fig. 7 The effects of PSR on the density of the PLA/PEBA blend before and after a uniaxial pre-stretching process at different temperatures. | ||
Conclusions
With the addition of PEBA to the PLA matrix, the toughness of the undrawn PLA/PEBA blend showed a significant improvement, but alongside with a sacrifice in the tensile strength and modulus. Highly oriented PLA/PEBA blends were prepared by a uniaxial pre-stretching process at 60 °C and 25 °C. When the PLA/PEBA blend was pre-stretched at 60 °C, the strength at yielding and break, as well as the modulus of the drawn blend, were significantly improved on increasing the PSR, with their maximum values amounting to 68.8 MPa, 100 MPa, and 2370 MPa, respectively, whereas the elongation at break still maintained a high value (60%), suggesting that the PEBA still had an excellent toughening effect for PLA under the uniaxial pre-stretching process. The SEM and WAXD analyses revealed that the orientation developed and the strain-induced crystallization proceeded after the pre-stretching process at both 60 °C and 25 °C. However, the phase-separation as well as some cracks and pores appeared in both the PEBA and PLA phases at Tps = 25 °C, which impeded the improvement of the tensile strength and modulus for PLA. With the increase in PSR, the glass transition shifted to higher temperature, whereas the cold-crystallization peak moved to a lower temperature and its peak area became smaller; thus, the crystallinity of the drawn blend increased. These results indicate that the orientation and strain-induced crystallization grew while pre-stretching, which suggests that these were the key aspects to strengthen and stiffen the PLA matrix. Consequently, pre-stretching the toughened PLA blend can be useful for fabricating the appropriate materials of specific applications, such as films for the preservation of agricultural products and woven bags.Acknowledgements
This work was funded by the National Natural Science Foundation of China (51503204, 51273201).Notes and references
- R. E. Drumright, P. R. Gruber and D. E. Henton, Adv. Mater., 2000, 12, 1841–1846 CrossRef CAS.
- K. J. Zhu, X. Z. Lin and S. L. Yang, J. Appl. Polym. Sci., 1990, 39, 1–9 CrossRef CAS.
- L. Fambri, A. Pegoretti, R. Fenner, S. D. Incardona and C. Migliaresi, Polymer, 1997, 38, 79–85 CrossRef CAS.
- S. Van Vlierberghe, P. Dubruel and E. Schacht, Biomacromolecules, 2011, 12, 1387–1408 CrossRef CAS PubMed.
- R. Auras, B. Harte and S. Selke, Macromol. Biosci., 2004, 4, 835–864 CrossRef CAS PubMed.
- R. G. Sinclair, J. Macromol. Sci., Part A: Pure Appl.Chem., 1996, 33, 585–597 CrossRef.
- L. Xie, H. Xu, B. Niu, X. Ji, J. Chen, Z. M. Li, B. S. Hsiao and G. J. Zhong, Biomacromolecules, 2014, 15, 4054–4064 CrossRef CAS PubMed.
- S. Ishida, R. Nagasaki, K. Chino, T. Dong and Y. Inoue, J. Appl. Polym. Sci., 2009, 113, 558–566 CrossRef CAS.
- M. Harada, T. Ohya, K. Iida, H. Hayashi, K. Hirano and H. Fukuda, J. Appl. Polym. Sci., 2007, 106, 1813–1820 CrossRef CAS.
- T. Takayama and M. Todo, J. Mater. Sci., 2006, 41, 4989–4992 CrossRef CAS.
- L. Jiang, M. P. Wolcott and J. W. Zhang, Biomacromolecules, 2006, 7, 199–207 CrossRef CAS PubMed.
- L. J. Han, C. Y. Han and L. S. Dong, Polym. Compos., 2013, 34, 122–130 CrossRef CAS.
- A. Suzuki and A. Endo, Polymer, 1997, 38, 3085–3089 CrossRef CAS.
- X. X. Hou, X. P. Yang, F. Zhang, S. Z. Wu and E. Waclawik, Int. J. Mod. Phys. B, 2008, 22, 5913–5918 CrossRef CAS.
- A. Suzuki and T. Kohno, J. Appl. Polym. Sci., 2000, 75, 1569–1576 CrossRef CAS.
- S. Z. Wu, F. Zhang, Y. H. Yu, P. Li, X. P. Yang, J. G. Lu and S. Ryu, Compos. Interfaces, 2008, 15, 671–677 CrossRef CAS.
- Z. Y. Song, X. X. Hou, L. Q. Zhang and S. Z. Wu, Materials, 2011, 4, 621–632 CrossRef CAS.
- J. C. Velazquez-Infante, J. Gamez-Perez, E. A. Franco-Urquiza, O. O. Santana, F. Carrasco and M. L. Maspoch, J. Appl. Polym. Sci., 2013, 127, 2661–2669 CrossRef CAS.
- J.-H. Wu, M.-S. Yen, C.-P. Wu, C.-H. Li and M. C. Kuo, J. Polym. Environ., 2012, 21, 303–311 CrossRef.
- P. Jariyasakoolroj, K. Tashiro, H. Wang, H. Yamamoto, W. Chinsirikul, N. Kerddonfag and S. Chirachanchai, Polymer, 2015, 68, 234–245 CrossRef CAS.
- F. Feng, X. Zhao and L. Ye, J. Macromol. Sci., Part B: Phys., 2011, 50, 1500–1507 CrossRef CAS.
- X. Zhao, L. Ye, P. Coates, F. Caton-Rose and M. Martyn, Polym. Adv. Technol., 2013, 24, 853–860 CrossRef CAS.
- J. P. Sheth, J. N. Xu and G. L. Wilkes, Polymer, 2003, 44, 743–756 CrossRef CAS.
- V. Barbi, S. S. Funari, R. Gehrke, N. Scharnagl and N. Stribeck, Macromolecules, 2003, 36, 749–758 CrossRef CAS.
- L. J. Han, C. Y. Han and L. S. Dong, Polym. Int., 2013, 62, 295–303 CrossRef CAS.
- G. Stoclet, R. Seguela, J. M. Lefebvre and C. Rochas, Macromolecules, 2010, 43, 7228–7237 CrossRef CAS.
- Y. Wang, M. Li, K. Wang, C. Shao, Q. Li and C. Shen, Soft Matter, 2014, 10, 1512–1518 RSC.
- G. Stoclet, R. Seguela, J. M. Lefebvre, S. Elkoun and C. Vanmansart, Macromolecules, 2010, 43, 1488–1498 CrossRef CAS.
- Y. G. Galen, R. Hatfield, W. E. Killinger, R. A. Andrejak and P. M. Roubicek, Macromolecures, 1993, 26, 6350–6353 CrossRef.
- Y. Wang, H. Zhang, M. Li, W. Cao, C. Liu and C. Shen, Polym. Test., 2015, 41, 163–171 CrossRef.
- H. P. Zhang, J. Niemczura, G. Dennis, K. Ravi-Chandar and M. Marder, Phys. Rev. Lett., 2009, 102, 245503 CrossRef CAS PubMed.
- L. Yu, H. Liu, F. Xie, L. Chen and X. Li, Polym. Eng. Sci., 2008, 48, 634–641 CAS.
- J. R. Sarasua, R. E. Prud'homme, M. Wisniewski, A. L. Borgne and N. Spassky, Macromolecules, 1998, 31, 3895–3905 CrossRef CAS.
- S. Huang, H. Li, S. Jiang, X. Chen and L. An, Polymer, 2011, 52, 3478–3487 CrossRef CAS.
- T. Kawai, N. Rahman, G. Matsuba, K. Nishida, T. Kanaya, M. Nakano, O. H. J. Kawada, A. Usuki, N. Honma, K. Nakajima and M. Matsuda, Macromolecules, 2007, 40, 9463–9469 CrossRef CAS.
- Y. Yin, X. Zhang, Y. Song, S. de Vos, R. Wang, C. A. P. Joziasse, G. Liu and D. Wang, Polymer, 2015, 65, 223–232 CrossRef CAS.
Footnote |
| † Electronic supplementary information (ESI) available. See DOI: 10.1039/c6ra25729a |
| This journal is © The Royal Society of Chemistry 2017 |

