 Open Access Article
Insight into a high temperature selective oxidation of HP40 alloy under a H2–H2O environment†
Binbin Bao,
Jinglei Liu *,
Hong Xu,
Bo Liu,
Kai Zhang and
Zhaorong Jin
State-Key Laboratory of Chemical Engineering, School of Mechanical and Power Engineering, East China University of Science and Technology, Shanghai, 200237, China. E-mail: ljlei@ecust.edu.cn; Fax: +86 021 64253810; Tel: +86 021 64251315
First published on 26th January 2017
Abstract
In the present work, a selective oxidation process of HP40 alloy at 1050 °C under a H2–H2O environment were studied in detail by means of SEM, EDS, GD-OES, XRD, Raman spectra and XPS. The results revealed that selective oxidation of Mn and Cr elements was realized, and the oxide scale preferentially grew via grain boundary rather than via grain lattice. The oxide scales were composed of a majority of MnCr2O4 spinel and a spot of Cr2O3 throughout the oxidation process. Mn existed in the form of Mn2+ ions on the surface, while Cr existed in various species. Metal hydroxides appeared on the surface approved by spectra of the O 1s region, and the relative amount of them decreased with oxidation time.
1. Introduction
Ethylene is the building block of chemical industry, and it is mainly produced by thermal cracking of hydrocarbons. The thermal cracking process is usually conducted at higher temperatures in cracking coils constructed of Fe–Cr–Ni alloy (e.g. HP40, HK40).1–4 The inner surface of coils is gradually covered by coke, and the thickness of the coke layer increases with the cracking time. The coke layer deposited on the inner surface will greatly increase the pressure drop in coils and reduce heat transfer from coils to cracking gas.3,4 Moreover, coke adhered on the surface will react with coil alloy and further lead to serious carburization. In practice, the cracking coils have to be shut down to remove coke when the maximum skin temperature of coils is reached. Carburizing, and decoking operation will significantly shorten the lifetime of coils and reduce ethylene yield. Therefore, inhibiting coking is meaningful work in terms of achieving high yield of ethylene and long-term running of cracking coils.Many studies have demonstrated that catalytic coking, caused by the catalysis of Fe and Ni elements or their oxides, is one of the main mechanisms for coke formation.1–5 And catalytic coking is also responsible for serious carburization on the surface layer of coils. Fabrication of inert coatings or layers on the coils to protect Fe and Ni elements from cracking gas is an effective method to inhibit coking and carburizing.4,6–8 It has been recently reported that selective oxidation of Mn and Cr elements on the surface can be realized at high temperature under low oxygen partial pressure, since the oxygen affinities of Cr and Mn are higher than that of Fe and Ni.3,9,10 Fe and Ni elements are absent in the formed oxide scale, thereby catalytic coking and carburizing can be significantly inhibited. And the low oxygen partial pressure environment can be easily obtained by a gas mixture of H2–H2O.3,10 Together with facile fabrication and low cost, pre-oxidation of cracking coils under H2–H2O environment becomes a promising technique to inhibit catalytic coking as well as carburizing.
Researchers3,9 have oxidized Fe–Cr–Ni alloys at different temperature under H2–H2O environment and studied the composition of oxide scales and their effect on coke formation. The results revealed that the formed oxide scales mainly composed of MnCr2O4 spinel and Cr2O3, and could effectively inhibit catalytic coke formation. According to some reports, the stabilities of MnCr2O4 spinel and Cr2O3 are different in both high temperature oxidative environment and high temperature carbonaceous environment,11,12 and MnCr2O4 spinel is much more stable than Cr2O3.11 The chemical state of elements also had remarkable influence on the stability of oxides under high temperature carbonaceous environment.13
Even though oxidation behaviors of Fe–Cr–Ni alloys at different temperatures under low oxygen partial pressure have been investigated, most of them focused on the composition, morphology and anti-coking effect of oxide scales. The oxidation process of alloys under low oxygen partial pressure and the corresponding change of the oxides composition were seldom studied. Moreover, few attentions were paid to investigate the chemical state of elements on the oxide scales. These meaningful studies may provide guidance for people to optimize oxidation parameters. In the present work, oxidation experiments of HP40 alloys were carried out for different times at 1050 °C under H2–H2O environment. The corresponding changes of distribution and chemical state of elements in oxide scales were also characterized.
2. Experimental
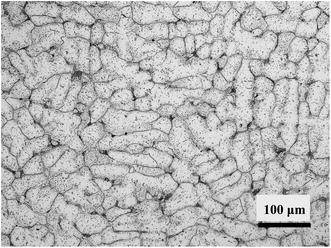
Alloy samples in a size of 10 mm × 10 mm × 3 mm were cut from a HP40 alloy tube by wire cutting, and the chemical composition and microstructure of as received alloy are shown in Table 1 and Fig. 1, respectively. Before oxidation, the samples were ground with 200, 400, and 800 grits SiC abrasive papers successively and further cleaned with acetone in an ultrasonic bath. Fig. 2 shows the schematic diagram of oxidation device, and the oxidation environment (H2–H2O gas mixture) was generated via bubbling H2 through deionized water at 20 °C. The calculated oxygen partial pressure of this H2–H2O gas mixture at 1050 °C is about 8.9 × 10⁻¹⁸ atm.11 Oxidation of samples was performed in the center of a quartz reaction chamber. The reaction chamber was firstly purified by nitrogen purging, and then gas mixture of H2–H2O was introduced into reaction chamber to carry out oxidation experiments. The experiments followed these conditions: flow rate of gas mixture was 100 ml min−1, isothermal oxidation temperature was 1050 °C, oxidation time varied from 0.2 h to 20 h, and both heating and cooling rate were 5 °C min−1.| Ni | Cr | Mn | Si | C | Nb | S | P | Fe |
|---|---|---|---|---|---|---|---|---|
| 34.82 | 24.98 | 1.11 | 1.56 | 0.471 | 0.955 | 0.010 | 0.022 | 35.67 |
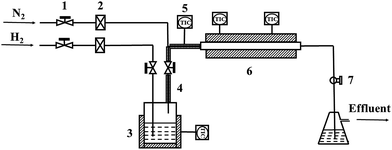 | ||
| Fig. 2 Schematic diagram of oxidation device: (1) needle valve; (2) gas flowmeter; (3) heating jacket; (4) heating band; (5) temperature controller; (6) reaction chamber; (7) ball valve. | ||
After cooling, the characters of oxide scales formed after different oxidation time were detailedly studied. The morphology and elemental distribution of the scales were examined by scanning electron microscope (SEM), energy dispersive spectrometer (EDS), glow discharge optical emission spectrometry (GD-OES), respectively. The phase composition of the scales was detected by X-ray diffraction (XRD) and Raman spectra. The measurements of Raman spectra utilized 514.5 nm line of an Ar ion laser at room temperature and recorded in the range of 120–1000 cm−1. And the chemical state of elements on the oxide scales was characterized by X-ray photoelectron spectroscopy (XPS).
3. Results and discussion
3.1 Morphology and elemental distribution of oxide scales
Fig. 3(a) shows the morphology and elemental distribution of the oxide scales formed under H2–H2O environment after 0.2 h isothermal oxidation. A small amount of crystals appears at grain boundaries on the alloy surface, and which displays granular structures with some blade-like structures scattered over. According to EDS maps, the crystals at grain boundaries obviously consist of Mn, Cr and O elements, while the concentrations of Cr, Mn and O elements in the regions between the boundaries are much lower. According to previous reports,3,10,11 oxidation of Fe and Ni elements is inhibited under proper low oxygen partial pressure (H2–H2O environment in this work) due to their lower affinities. During oxidation process, Cr is initially oxidized to form chromia on alloy surface since its higher thermodynamic activity, then Cr and Mn elements diffuse outward across chromia scale and form oxides continuously. The lattice-diffusion rate of Mn element in chromia is two orders of magnitude higher than that of Cr,10,11 therefore the formed oxides contains remarkable Mn-oxides although the bulk content of Mn is only about 1% in the base alloy. After 0.2 h oxidation, a small amount of Mn–Cr composite oxides preferentially form along the grain boundaries, while very thin chromia scales exist in spare regions. It has been reported that oxide-forming elements prefer to diffuse outward across grain boundaries rather than across crystal lattice under low oxygen partial pressure.14–16 Therefore, chromia initially formed at grain boundaries is much more than that formed between grain boundaries. Subsequently, Mn element rapidly diffuses outward across chromia to form Mn oxide due to the much higher diffusion rate of Mn. Finally, the formed Mn oxide would react with Cr2O3 to form Mn–Cr composite oxides. Mn–Cr composite oxides preferentially form along the grain boundaries due to the enrichment of chromia at grain boundaries. The appearance of blade-like structures can be explained by the following process: the blade-like structures initially formed at dislocations of the oxides, and then cations quickly diffuse into the blades due to the presence of hollow cores, finally the blade-like structures grow over the oxides.3,17,18 When the oxidation time is prolonged to 2 h, the oxide scales along the grain boundaries are obviously thicker and wider than that oxidized for 0.2 h, and more blade-like structures are present on oxide scales, which are shown in Fig. 3(b). And EDS maps also reveal that more oxides forms both at and between grain boundaries. However, EDS maps also reveal that oxides at and between grain boundaries mainly consist of Mn–Cr composite oxides and Cr-oxides, respectively. Besides, considerable amount of Si element between grain boundaries is detected by EDS, which can be attributed to the accumulation of Si element under the chromia scale and the penetration of X-ray through the thin chromia scale.10,11 After 10 h oxidation, most of alloy surface is covered by thick Mn–Cr oxide scales with blade-like structures scattered over. However, partial regions of alloy surface are still covered by thinner scales containing a much lower concentration of Mn element, and the small thickness of scales leads to the presence of Fe, Ni and Si elements in EDS maps. When thick scales form at grain boundaries, the outward growth rate is slowed, and the oxide scales grow along the alloy surface, resulting in the gradual coverage of the scales on alloy surface. Fig. 3(d) shows the morphology and elemental distribution of the oxide scales formed under H2–H2O environment after 20 h isothermal oxidation. The morphology analysis exhibits that, alloy surface is fully covered by granular crystals as well as scattered blade-like structures. Furthermore, Fe, Ni and Si elements are not detected by EDS analysis, indicating considerable thickness of oxide scales. The morphology and a uniform distribution of Mn, Cr and O elements demonstrate that uniform scales composed of Mn–Cr composite oxides formed on alloy surface after 20 h oxidation.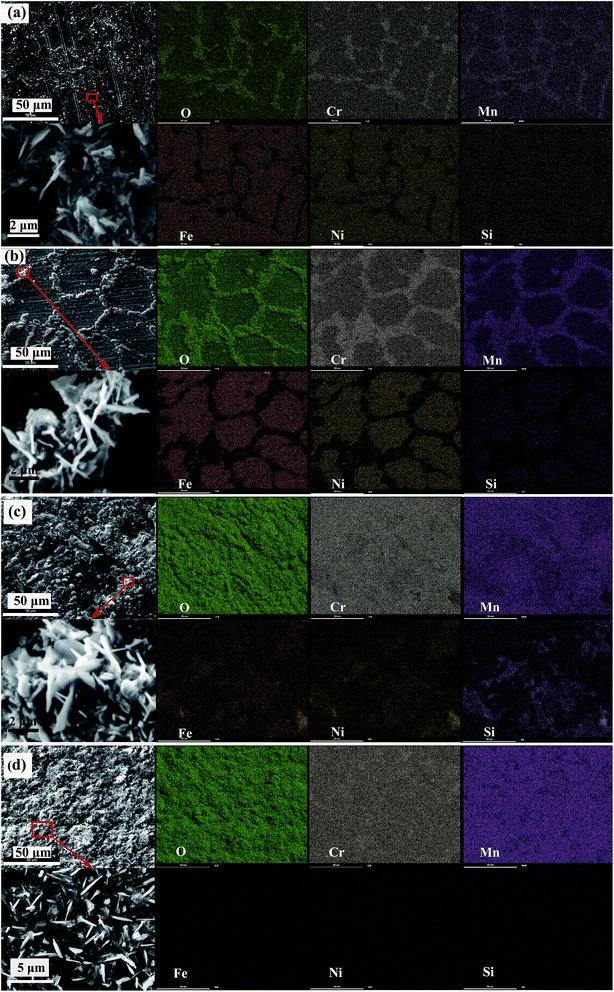 | ||
| Fig. 3 Morphology and elemental distribution of oxide scales formed under H2–H2O environment after various isothermal oxidation times: (a) 0.2 h; (b) 2 h; (c) 10 h; (d) 20 h. | ||
3.2 Cross-section morphology and elemental distribution of oxide scales
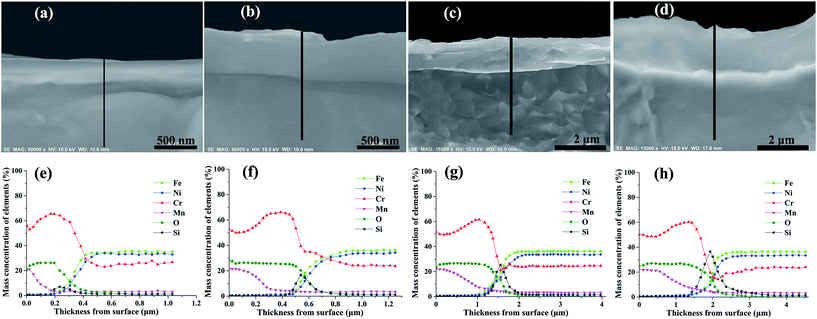
Fig. 4 shows the morphology and elemental distribution of the cross-section of oxide scales formed under H2–H2O environment after various isothermal oxidation times. Dense scales without any cracks and voids are observed on the surfaces, and the thickness increased from about 200 nm to 2 μm with increasing oxidation time. The results of EDS line scan analyses show that Mn–Cr–O and chromia duplex oxide scales are displayed on alloy surfaces after various oxidation times, and Si-rich oxides can be found at the interfaces of oxide scale and base alloy. After 0.2 h oxidation, oxide scale with a thickness of about 200 nm formed on the surface, and the oxide scale mainly composed of chromia, the concentration of Mn in the scale rapidly decreased along the thickness. After 2 h, 10 h and 20 h, the thicknesses of oxide scales increase to 500 nm, 1.5 μm and 2 μm, respectively. Moreover, the thickness of Mn–Cr–O oxide and the content of Si-rich oxides increase with oxidation time. After 20 h oxidation, Mn–Cr–O oxide layer with nearly 1 μm thickness formed on alloy surface, and an obvious Si-rich oxide transition layer formed at the interface of oxide scale and base alloy. According to previous reports,19–21 Si-rich oxide could develop at scale/substrate interface when H-series heat-resistance alloy was oxidized at atmospheric environment or CO–CO2 gas mixtures, and the formed Si-rich oxide layer was discrete and scattered near the interface. However, Si-rich oxide layer distributed uniformly along the scale/substrate interface when the alloy was oxidized under H2–H2O environment.It has been reported that hydrogen can dissolve into chromia scales formed in water-containing environment.22–25 In order to see hydrogen distribution in oxide scales, GD-OES measurements were carried out for alloy samples oxidized for 0.2–20 h. GD-OES depth profiles of oxide scales formed under H2–H2O environment after various isothermal oxidation times are displayed in Fig. 5. According to the profiles, the elemental distributions of Fe, Ni, Cr, Mn, O and Si elements are in accordance with EDS analyses above. GD-OES analyses indicate small amount of hydrogen existed throughout oxide scales, and enriched at the surfaces and oxide/substrate interfaces. And the content of hydrogen at oxide/substrate interface decreased with oxidation time. The existence of hydrogen at the surfaces probably caused by water adsorption and the reaction of water and oxides.23,26 It was reported that the oxide structure formed on alloy surface was a poor barrier to H-species penetration, and H-species probably originated from H2O for chromia scale growing at low oxygen partial pressure environment created by H2–H2O.24,25 When Cr cations cross metal/oxide interface to facilitate oxide scale growth, H-species would support Rahmel–Tobolski mechanism in pores at metal/oxide interface and subsequently close pores at the interface.23–25 Similar enrichments of hydrogen at metal/oxide interface of alloy were also found in other researches involving H2O-containing atmosphere.23,24
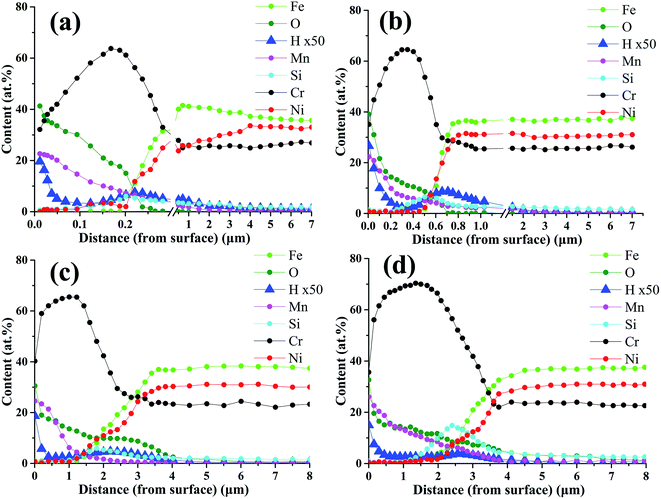 | ||
| Fig. 5 GD-OES profile of oxide scales formed under H2–H2O environment after various isothermal oxidation times: (a) 0.2 h; (b) 2 h; (c) 10 h; (d) 20 h. | ||
3.3 Phase composition of oxide scales
Fig. 6 shows the XRD patterns of alloy samples oxidized at 1050 °C under H2–H2O environment after various isothermal oxidation times. It can be observed that the oxide scales formed after various oxidation times are mainly composed of MnCr2O4 spinel phase and Cr2O3 phase, demonstrating selective oxidation of Cr and Mn elements are realized under experimental environment. Although peaks in all patterns can be assigned to base alloy, MnCr2O4 spinel and Cr2O3, significant difference appears in terms of relative intensities. The insert figure in Fig. 6 exhibits the relative peak intensities of base alloy, MnCr2O4 spinel and Cr2O3. The results show that the relative intensity of oxides (MnCr2O4 spinel and Cr2O3) significantly increases with oxidation time, indicating remarkable increase in thickness of oxide scales. After 20 h oxidation at 1050 °C under H2–H2O environment, alloy surface is fully covered by dense and uniform oxide scale. It was reported that MnCr2O4 spinel was much more stable than Cr2O3 in high temperature thermal cracking environment.11–13 Therefore, alloy oxidized under this condition is considered to have favorable performance in thermal cracking environment.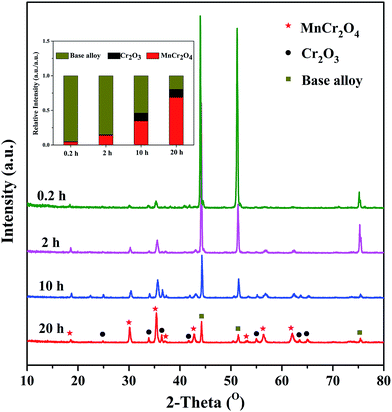 | ||
| Fig. 6 XRD patterns of alloy samples oxidized at 1050 °C under H2–H2O environment after various isothermal oxidation times. | ||
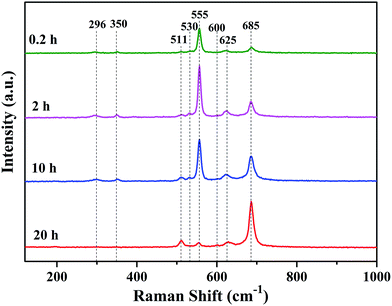
Raman spectrum is sensitive to crystal structures and has small penetration depth, therefore it can well characterize the phase structure on the surface of oxide scales.27–32 Fig. 7 shows Raman spectra of the oxide scales formed under H2–H2O environment after various oxidation times. Three peaks assigned to Cr2O3 (centered at 530 cm−1, 555 cm−1 and 625 cm−1),28–30 three peaks assigned to MnCr2O4 (centered at 511 cm−1, 600 cm−1 and 685 cm−1)10,31 and two peaks assigned to Si-oxides (centered at 296 cm−1 and 350 cm−1)32 can be found in Raman spectra. Raman spectra of the oxide scales exhibit remarkable difference, especially in the relative amount of phases. The results indicate that the relative amount of Cr2O3 is much larger than that of MnCr2O4 on the surface of oxide scale after 0.2 h oxidation. With the extension of oxidation time, the relative amount of Cr2O3 decreases rapidly while the relative amount of MnCr2O4 quickly increases. After 20 h oxidation, the surface of oxide scale consists a majority of MnCr2O4 and just a spot of Cr2O3. Moreover, Si-oxide phase can only be found in Raman spectra of alloy surfaces oxidized for 0.2 h, 2 h and 10 h, which can be explained by the penetration of laser. It can be noticed that, even though the content of Cr2O3 in the whole oxide scale is very low, Cr2O3 appears as the main phase on the surface of oxide scale when oxidation time is 0.2 h, 2 h or 10 h.
3.4 Chemical state of elements on the oxide scales
Since the surface of oxide scale directly contacts with thermal cracking gas, surface state of the oxide scale significantly influences its anti-coking and anti-carburizing properties. The chemical state of elements on oxide scales were characterized by XPS spectra, and all spectra were energy calibrated with C 1s standard energy value of 284.8 eV. XPS spectra only show peaks corresponding to O, C, Mn and Cr elements (shown in Fig. S1†). Among them, peaks assigned to C originate from adventitious hydrocarbons in the XPS instrument, while peaks assigned to C, Mn and Cr elements are from oxide scales. The XPS result for elemental composition is in line with previous EDS, XRD and Raman analyses. Therefore, the chemical states of O, Cr and Mn elements are finely studied by high resolution XPS spectra. Fig. 8 shows XPS spectra and corresponding fitting lines of O 1s regions for oxide scales after 0.2–20 h oxidation. In all spectra, two peaks centered at binding energies (BE) 530.2 eV and 531.8 eV were fitted, and the fitting lines showed good agreement with observed spectra. According to numerous reports, the peaks centered at BE 530.2 eV and 531.8 eV are assigned to O2− ions in metal oxides and hydroxides,33,34 respectively, and the presence of hydroxides can be attributed to the reaction of water vapor in oxidation environment and metal elements.15,26,35 It can be found that the relative intensity of peak centered at BE 531.8 eV decreased rapidly with increasing oxidation time. Relative intensities of these two species on oxide scales are calculated based on peak area, revealing that the content of species containing metal hydroxides decreases from 53.7% to 16.9% when oxidation time is extended from 0.2 h to 20 h (Fig. S2†). With the extension of oxidation time, more MnCr2O4 spinel form and gradually cover the surface, so that high stability of MnCr2O4 spinel leads to the reduction of metal hydroxides.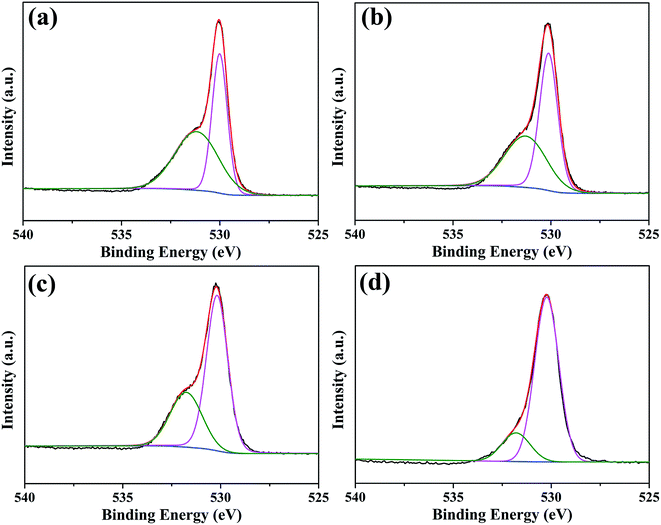 | ||
| Fig. 8 XPS spectra and corresponding fitting lines of O 1s regions for oxide scales formed after various oxidation times: (a) 0.2 h; (b) 2 h; (c) 10 h; (d) 20 h. | ||
Fig. 9 shows XPS spectra and corresponding fitting lines of Cr 2p3/2 and Cr 2p1/2 regions for oxide scales after 0.2–20 h oxidation. Cr 2p3/2 and Cr 2p1/2 regions of all spectra display wide and complex shapes, indicating the existence of various peaks. After refined fitting, Cr 2p3/2 region of each spectrum has been deconvoluted into four peaks centered at BE 575.6 eV, 576.6 eV, 577.4 eV and 578.1 eV, and Cr 2p1/2 region of each spectrum has been deconvoluted into two peaks centered at BE 585.3 eV and 586.3 eV. The peaks centered at BE 575.6 eV, 576.6 eV, 585.3 eV and 586.3 eV are attributed to Cr3+ ions,36–38 the peak centered at BE 577.4 eV is ascribed to Chromium hydroxide and the peak centered at BE 578.1 eV corresponds to Cr6+ ions.38,39 Among these species, Cr3+ ions exist in Cr-containing composite oxides (Cr2O3 and MnCr2O4), Cr6+ and chromium hydroxide probably exists in the intermediate responsible for chromium evaporation.15,35 The relative amounts of these species determined by peak intensities show that just a small proportion of chromium hydroxide and Cr6+ ions exists on the surface after 20 h oxidation (Fig. S3†).
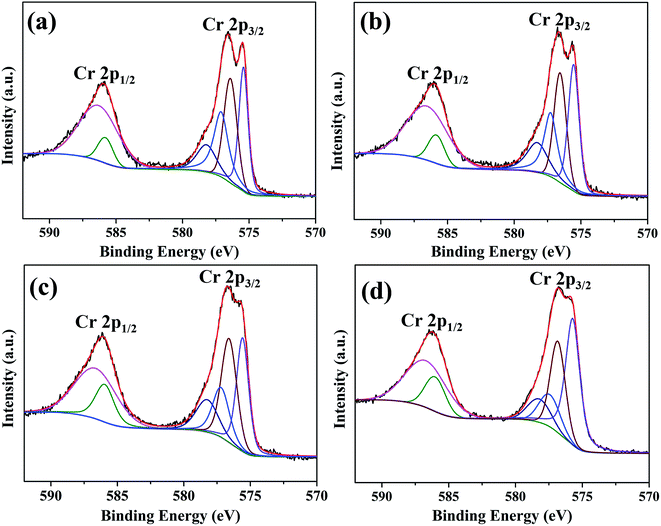 | ||
| Fig. 9 XPS spectra and corresponding fitting lines of Cr 2p3/2 and Cr 2p1/2 regions for oxide scales formed after various oxidation times: (a) 0.2 h; (b) 2 h; (c) 10 h; (d) 20 h. | ||
XPS spectra and corresponding fitting lines of Mn 2p3/2 and Mn 2p1/2 regions for oxide scales after 0.2–20 h oxidation are displayed in Fig. 10. According to fitting lines, each spectrum displays a peak centered at BE 652.3 eV in Mn 2p1/2 region, two peaks centered at BE 640.9 eV and 639.7 eV in Mn 2p3/2 region and a satellite peak centered at BE 646.4 eV. In addition, another peak centered at BE 651.2 eV is only present in XPS spectrum for oxide scale formed after 0.2 h oxidation. It has been reported that, the peaks centered at BE 639.7 eV, 640.9 eV, 651.2 eV and 652.3 eV are assigned to Mn2+ ions, and the satellite feature centered at BE 646.4 eV is also a typical feature for Mn2+ ions.40–42 Binding energy difference (ΔBE) in Mn 3s region of XPS spectrum is another important parameter to distinguish chemical state of Mn element, and ΔBEs of 6.0 eV, 5.3 eV and 4.7 eV correspond to Mn2+, Mn3+, and Mn4+ ions, respectively.43 ΔBEs of Mn 3s regions for all the oxide scales are 6.0 eV (Fig. S4†), confirming that Mn species on all oxide scales exist in the form of Mn2+ ions. Moreover, it was reported that the peak position of Mn2+ ions existed in oxides is significantly influenced by oxide structures, the peak positions of Mn2+ ions in octahedral site and tetragonal site appear at BE 640.9 eV and 639.7 eV, respectively.41 In each spectrum, the intensity of peak centered at BE 640.9 eV is much higher than that of peak centered at BE 639.7 eV, indicating octahedral structure is the main structure for all oxides.
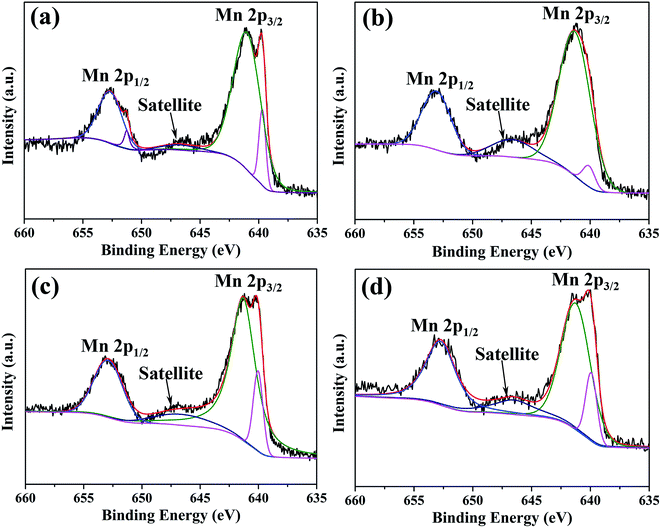 | ||
| Fig. 10 XPS spectra and corresponding fitting lines of Mn 2p3/2 and Mn 2p1/2 regions for oxide scales formed after various oxidation times: (a) 0.2 h; (b) 2 h; (c) 10 h; (d) 20 h. | ||
4. Conclusion
In the present work, high temperature selective oxidation of HP40 alloy were investigated in terms of morphology, elemental distribution, phase composition and chemical state of elements on the surface.Selective oxidation of Mn and Cr elements is realized under low oxygen partial pressure (created by H2–H2O environment), Mn–Cr oxide scales initially grow across the grain boundaries rather than across the grain lattice, then gradually cover the whole surface. The oxide scales exhibit small granular crystals with blade-like structures scattered over throughout the oxidation process.
The oxide scales consist MnCr2O4 and chromia duplex structure, and enrichment of hydrogen is found at the surfaces and oxide/substrate interfaces of the oxidized alloys. With oxidation time, the main phase composition of surface layer of oxide scale significantly changes from Cr2O3 to MnCr2O4 spinel.
O element on the surface exists in both metal oxides and hydroxyl groups, and the species containing metal hydroxides significantly reduce with oxidation time. Throughout the oxidation process, Cr element can be assigned to Cr6+ ions, Cr3+ ions in Cr-containing composite oxides (mainly MnCr2O4) and chromium hydroxide, while Mn element is only attributed to Mn2+ ions.
Acknowledgements
This work is gratefully supported by Research Fund for the Doctoral Program of Higher Education of China (20110074110009) and Sinopec Corp., China.References
- J. Wang, M.-F. Reyniers, K. M. Van Geem and G. B. Marin, Ind. Eng. Chem. Res., 2008, 47, 1468–1482 CrossRef CAS.
- J. Wang, M.-F. Reyniers and G. B. Marin, Ind. Eng. Chem. Res., 2007, 46, 4134–4148 CrossRef CAS.
- M. Shao, L. Cui, Y. Zheng, Y. Wang and L. Xing, Mater. Corros., 2013, 64, 777–782 CrossRef CAS.
- J. Zhou, H. Xu, X. Luan and X. Ling, Fuel Process. Technol., 2012, 104, 198–203 CrossRef CAS.
- L. F. Albright and J. C. Marek, Ind. Eng. Chem. Res., 1988, 27, 755–759 CrossRef CAS.
- S. Tang, S. Gao, S. Hu, J. Wang, Q. Zhu, Y. Chen and X. Li, Ind. Eng. Chem. Res., 2014, 53, 5432–5442 CrossRef CAS.
- C. Li and Y. Yang, Surf. Coat. Technol., 2004, 185, 68–73 CrossRef CAS.
- S. Tang, J. Wang, Q. Zhu, Y. Chen and X. Li, ACS Appl. Mater. Interfaces, 2014, 6, 17157–17165 CAS.
- Z. Zhang and L. F. Albright, Ind. Eng. Chem. Res., 2010, 49, 1991–1994 CrossRef CAS.
- B. Bao, J. Liu, H. Xu, B. Liu and W. Zhang, RSC Adv., 2016, 6, 68934–68941 RSC.
- H. Li and W. Chen, Corros. Sci., 2010, 52, 2481–2488 CrossRef CAS.
- H. Li, Y. Zheng, L. W. Benum, M. Oballa and W. Chen, Corros. Sci., 2009, 51, 2336–2341 CrossRef CAS.
- H. Li and W. Chen, Corros. Sci., 2011, 53, 2097–2105 CrossRef CAS.
- T. Horita, Y. Xiong, K. Yamaji, N. Sakai and H. Yokokawa, Fuel Cells, 2002, 2, 189–194 CrossRef CAS.
- H. Asteman, J.-E. Svensson, M. Norell and L.-G. Johansson, Oxid. Met., 2000, 54, 11–26 CrossRef CAS.
- J. Zurek, G. H. Meier, E. Essuman, M. Hänsel, L. Singheiser and W. J. Quadakkers, J. Alloys Compd., 2000, 467, 450–458 CrossRef.
- R. L. Tallman and E. A. Gulbransen, J. Electrochem. Soc., 1967, 114, 1227–1230 CrossRef CAS.
- E. A. Polman, T. Fransen and P. J. Gellings, Oxid. Met., 1989, 32, 433–447 CrossRef CAS.
- J. Yan, Y. Gao, L. Liang, Z. Ye, Y. Li, W. Chen and J. Zhang, Corros. Sci., 2011, 53, 329–337 CrossRef CAS.
- J. Yan, Y. Gao, Y. Shen, F. Yang, D. Yi, Z. Ye, L. Liang and Y. Du, Corros. Sci., 2011, 53, 3588–3595 CrossRef CAS.
- N. Xu, D. Monceau, D. Young and J. Furtado, Corros. Sci., 2008, 50, 2398–2406 CrossRef CAS.
- G. Hultquist, B. Tveten and E. Hörnlund, Oxid. Met., 2000, 54, 1–10 CrossRef CAS.
- A. Yamauchi, Y. Yamauchi, Y. Hirohata, T. Hino and K. Kurokawa, Mater. Sci. Forum, 2006, 522, 163–170 CrossRef.
- M. Hänsel, L. Garcia-Fresnillo, S. L. Tobing and V. Shemet, Mater. High Temp., 2012, 29, 187–192 CrossRef.
- M. P. Brady, M. Fayek, J. R. Keiser, H. M. Meyer III, K. L. More, L. M. Anovitz, D. J. Wesolowski and D. R. Cole, Corros. Sci., 2011, 53, 1633–1638 CrossRef CAS.
- C. Gindort, L. Singheiser and K. Hilpert, J. Phys. Chem. Solids, 2005, 66, 384–387 CrossRef.
- Z. Zhai, H. Shen, J. Chen, J. Li and S. Zhang, RSC Adv., 2016, 6, 42353–42360 RSC.
- S. M. Abbas, N. Ahmad, A.-U. Rehman, U. A. Rana, S. U.-D. Khan, S. Hussain and K.-W. Nam, Electrochim. Acta, 2016, 212, 260–269 CrossRef CAS.
- B. D. Hosterman, Physics, Ph.D. thesis, University of Nevada, 2011.
- D. Bersani, P. P. Lottici, G. Antonioli, E. Campani, A. Casoli and C. Violante, J. Raman Spectrosc., 2004, 35, 694–703 CrossRef CAS.
- Y. Chen, Z. Liu, S. Ringer, Z. Tong, X. Cui and Y. Chen, Cryst. Growth Des., 2007, 7, 2279–2281 CAS.
- J. Zhou, H. Xu, J. Liu, X. Qi, L. Zhang and Z. Jiang, Mater. Lett., 2007, 61, 5087–5090 CrossRef CAS.
- S. Ningshen, U. Kamachi, V. K. Mittal and H. S. Khatak, Corros. Sci., 2007, 49, 481–496 CrossRef CAS.
- M. E. Simonsen, H. Jensen, Z. Li and E. G. Søgaard, J. Photochem. Photobiol., A, 2008, 200, 192–200 CrossRef CAS.
- R. F. A. Pettersson, J. Enecker and L. Liu, Mater. High Temp., 2005, 22, 269–281 CrossRef CAS.
- W. E. Mahmoud, Mater. Lett., 2016, 177, 42–45 CrossRef CAS.
- D. Peng, X. Bai, R. Yu, X. Chen, Q. Zhou, X. Liu and P. Deng, Electrochim. Acta, 2004, 49, 1403–1408 CrossRef CAS.
- V. Shankar Rao and L. K. Singhal, ISIJ Int., 2009, 49, 1902–1906 CrossRef.
- L. Li, Z. Wang, Q. Liu, C. Ye, Z. Chen and L. Gong, Electrochim. Acta, 2012, 77, 89–96 CrossRef CAS.
- J. Hou, H. Zhao, F. Huang, Q. Jing, H. Gao, Q. Wu, S. Peng and G. Cao, J. Power Sources, 2016, 325, 438–445 CrossRef CAS.
- R. Wang, C. Yang, Y. Shi, Y. Sun, G. Li, T. Jin, G. Qin, F. Liao and J. Lin, Acta Phys.-Chim. Sin., 2012, 28, 1021–1029 CrossRef CAS.
- T. Pandiarajan, L. John Berchmans and S. Ravichandran, RSC Adv., 2015, 5, 34100–34108 RSC.
- D. Alburquenque, L. Troncoso, J. C. Denardin, A. Butera, K. D. Padmasree, J. Ortiz, F. Herrera, J. F. Marco and J. L. Gautier, J. Alloys Compd., 2016, 672, 307–316 CrossRef CAS.
Footnote |
| † Electronic supplementary information (ESI) available. See DOI: 10.1039/c6ra25933b |
| This journal is © The Royal Society of Chemistry 2017 |

