 Open Access Article
Enhancing the performance of SPEEK polymer electrolyte membranes using functionalized TiO2 nanoparticles with proton hopping sites
Parisa Salarizadehab,
Mehran Javanbakht *ab and
Saeed Pourmahdianc
aDepartment of Chemistry, Amirkabir University of Technology, Tehran, 1599637111, Iran. E-mail: mehranjavanbakht@gmail.com; Fax: +98 21 64542762; Tel: +98 21 64542764
bFuel Cell and Solar Cell Laboratory, Renewable Energy Research Center, Amirkabir University of Technology, Tehran, 1599637111, Iran
cDepartment of Polymer Engineering and Color Technology, Amirkabir University of Technology, Tehran, 1599637111, Iran
First published on 24th January 2017
Abstract
In this work, the application of a sulfonated poly(ether ether ketone) (SPEEK)/amine functionalized titanium dioxide nanoparticle (AFT) composite as a novel membrane in proton exchange membrane fuel cells (PEMFC) was studied. Titanium dioxide (TiO2) nanoparticles were functionalized by grafting aminopropyl groups through hydrolysis of 3-aminopropyltriethoxysilane (APTES). The influence of the AFT nanoparticles on thermal and mechanical stability, water uptake, dimensional stability and electrochemical properties of the membranes were studied. The grafting of APTES onto TiO2 nanoparticles improved their dispersion in the SPEEK matrix. The nanocomposite membrane with the optimal amount of AFT nanoparticles, 7.5 wt%, showed a proton conductivity of 0.135 S cm−1 at 80 °C which was 159.6% higher than that of the nanocomposite membrane with 7.5% TiO2. This can be attributed to their good dispersion and reduction of interparticle separation spacing which creates connected pathways for proton transport. The membrane with 7.5 wt% AFT showed a 40.8% decrease in swelling, a 132.7% increase in conductivity and an 86.7% increment in maximum power density (PDmax) (230 mW cm−2) compared with the pristine SPEEK membrane, which indicated its potential application in PEMFCs.
1. Introduction
Proton exchange membrane fuel cells (PEMFCs) are electrochemical devices that generate electricity, water and heat by a simple reaction between hydrogen and oxygen gases. PEMFCs have received much consideration because of their wide applicability, high efficiency, low pollution and quick start time.1–3 A proton exchange membrane (PEM) is the key component in the development of PEMFCs. The commercial membrane used in PEMFCs is Nafion due to its good proton conductivity at temperatures below 80 °C, and high chemical and oxidative stability.4 But, Nafion has its own inherent drawbacks such as high cost, limited operation temperature and fuel crossover.5 Synthesizing novel PEMs with excellent proton conductivity, low cost, good thermal and mechanical stability and high fuel cell performance is essential for the development of PEMFCs.6 Our earlier literature reported on the synthesis of nanocomposite membranes by incorporating some inorganic nanoparticles as filler such as, SBA-15-ph-SO3H,7 poly(sulfonic acid)-g-silica,8 BaZrO3,9 La2Ce2O7,10 sulfonated graphene oxide (SGO),11,12 and Fe2TiO5 nanoparticles13 for enhancing the mechanical stability, the proton conductivity and other properties of membranes.Sulfonated poly(ether ether ketone) (SPEEK) is a non-fluorinated polymer considered as a reliable candidate for PEM application due to its high thermo-oxidative resistance, superior chemical stability, good thermal stability and low cost.14 Increase in sulfonation degree (DS) of SPEEK increases the membrane swelling and proton conductivity and declines the membranes mechanical stability because of the plasticizing nature of sulfonated groups.15,16 The DS of SPEEK can easily be controlled by the reaction time, concentration of acid and temperature.17 Different approaches have been investigated to improve various properties of SPEEK such as, mechanical properties, dimensional stability and proton conductivity, including blending with other polymers,18 cross-linking19 and addition of inorganic fillers.17,20
Inorganic hygroscopic nanofillers such as titanium dioxide (TiO2), zirconium oxide (ZrO2), silica (SiO2) and iron titanate (Fe2TiO5) nanoparticles21–24 have been added to SPEEK membranes to further enhance physicochemical properties with suitable electrochemical properties. But, usually with the adding of the inorganic nano-fillers, the proton conductivity of the membranes declines due to the tendency of fillers to agglomeration, their low compatibility with polymer matrix and dilution effect on sulfonic acid sites in the SPEEK matrix.25 To overcome these problems, surface treatment of nanofillers with acidic and basic organic groups can be an effective method.25–29 Moreover, the modification of the nanoparticles with these functional groups can form proton hopping sites for Grotthuss-type proton transfer, as a result, the proton conductivity of the membrane improves.26
In our previous work, incorporation of modified Fe2TiO5 nanoparticles within SPEEK matrix improved proton conductivity and mechanical properties of membrane.30 Our research was continued with investigation of different nanoparticles effect and their surface modification on the properties of nanocomposite membranes. P25 TiO2 nanoparticles have high hydroxyl groups in their surface which facilitate its surface modifications. Many researchers confirmed bio-catalytic properties of amine functionalized TiO2 nanoparticles for waste water treatment31,32 but it is less studied as a nanoparticle with proton hopping sites in PEMFC. In present work, a novel SPEEK/amine functionalized TiO2 nanocomposite membrane was prepared with the aim of enhancing proton conductivity and physicochemical properties of SPEEK-based membranes. The thermal and mechanical stability, water uptake, membrane swelling, ion exchange capacity (IEC), proton conductivity and PEMFC performance of the membranes were evaluated. –NH2 groups of functionalized TiO2 nanoparticles provided hydrogen bonding and electrostatic interactions with –SO3H groups of the polymer matrix which created further proton transfer sites and increased the proton conductivity of the membranes. Moreover, the modification of TiO2 nanoparticles diminished their agglomeration and improved the proton conductivity of membranes by creating continues pathways for proton transport.
2. Experimental
2.1. Materials
Poly(ether ether ketone), PEEK, (MW = 20![[thin space (1/6-em)]](https://www.rsc.org/images/entities/char_2009.gif) 800) was supplied from Sigma-Aldrich. P25 TiO2 nanoparticles with particle size of 21 nm, specific surface area of 50 ± 15 m2 g−1 was purchased from Degussa. Triethyl amine (TEA) and 3-aminopropyltriethoxysilane, APTES, were purchased from Merck. All of the solvents were obtained from Merck. De-ionized water was used throughout the experiments.
800) was supplied from Sigma-Aldrich. P25 TiO2 nanoparticles with particle size of 21 nm, specific surface area of 50 ± 15 m2 g−1 was purchased from Degussa. Triethyl amine (TEA) and 3-aminopropyltriethoxysilane, APTES, were purchased from Merck. All of the solvents were obtained from Merck. De-ionized water was used throughout the experiments.
2.2. Synthesis of amine functionalized TiO2 nanoparticles and SPEEK
Amine functionalized TiO2 (AFT) nanoparticles were prepared by the two-step method as illustrated in Fig. 1 according to the following procedure: first, 1 g of TiO2 nanoparticles was dried at 100 °C in a vacuum oven, and then dispersed in 100 mL anhydrous toluene. Then, 8 mL of APTES and 0.6 mL of triethyl amine were added drop by drop to the resulting solution and refluxed under N2 atmosphere for 24 h at 80 °C. At the end, the resulting mixture was washed three times with toluene and ethanol, respectively and dried in a vacuum oven.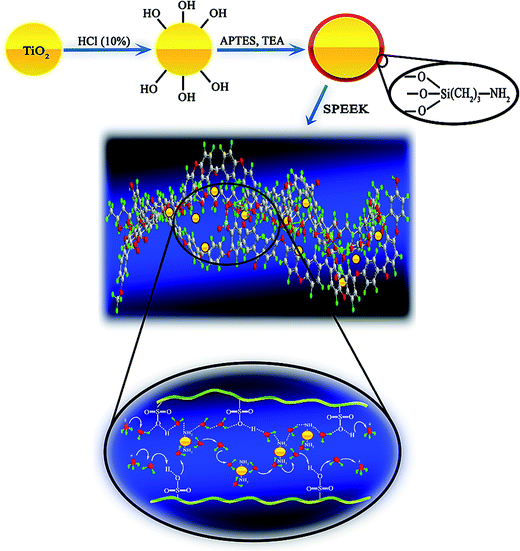 | ||
| Fig. 1 Schematic of amine-functionalization reaction of TiO2 nanoparticles and the proton transfer mechanism in the nanocomposite membrane. | ||
Sulfonated poly(ether ether ketone) (SPEEK) was prepared by direct sulfonation of PEEK. First, dried PEEK (10 g) was dissolved into concentrated sulfuric acid (100 mL) under stirring at 25 °C for 1 h. Then, the polymer solution was stirred for 4 h at 60 °C under nitrogen atmosphere. The sulfonated polymer solution was cooled and then precipitated in excess amount of ice-water under continuous stirring. The solid SPEEK was washed with deionized water till neutral pH and then dried at 70 °C for 24 h. The DS was found to be 68% by titration method.
2.3. Membrane preparation
Three types of membranes (SPEEK, SPEEK/TiO2 and SPEEK/AFT) were synthesized by the solution casting method; these membranes were identified as SP, SPTx and SPAFTx respectively, where x (2.5, 5, 7.5 and 10) represents the weight percentage of nanoparticles in the nanocomposite membranes. At first, 1 g of SPEEK was dissolved in 3 mL of DMAc by stirring at room temperature for 1 h. Then, the appropriate weight of nanoparticles was dispersed in 2 mL DMAc by sonication for 30 min and then added into the SPEEK solution. The solution was sonicated for 30 min until the mixture became homogeneous. The resultant viscous polymer solution was poured on a clean glass plate by using an automatic film applicator. The membranes were dried at room temperature for overnight and 70 °C for 24 h, respectively. The thickness of the dried resulting membranes was about 70 μm. Among SPTx membranes, the SPT5 membrane selected for more analyze to compare with SPAFTx due to its higher proton conductivity than other SPTx membranes. Before of all tests, the membranes were treated in 2 M sulfuric acid solution and deionized water, respectively. This was done in order to liberate the residual solvent.2.4. Characterization
The chemical structures of modified nanoparticles and membranes were characterized by Fourier transform infrared spectrometer (FTIR, Bruker Equinox) in the range of 500–4000 cm−1. The morphology and size of the obtained nanoparticles and cross-sectional morphology of the membranes were investigated by a field emission scanning electron microscope (FESEM, TESCAN). Transmission electron microscopy (TEM, Zeiss EM10C) was used to investigate the size and morphology of the AFT nanoparticles.The surface topography and roughness of the membranes were evaluated by atomic force microscopy (AFM) technique in tapping mode using a SPA-300HV, Seiko Instrument Co. The X-ray diffraction (XRD) of the prepared membranes was performed using an INEL model EQUINOX 3000, France X-ray diffractometer in an angular range of 5–80°.
The thermogravimetric analysis (TGA) of the nanoparticles and membranes was performed using a Hi-Res TGA 2950 thermogravimetric analyzer under nitrogen atmosphere at the heating rate of 10 °C min−1. The mechanical properties of the membranes were evaluated on a STM-150 universal test machine (UTM, SANTAM DBBP, Iran) with an elongation rate of 2 mm min−1.
2.5. Water uptake and membrane swelling
At first, the nanocomposite membranes were immersed in deionized water at room temperature for 12 h until fully hydrated. After wiping the surface water of membranes, the weight (Ww) and length (Lw) of membranes were determined. The membranes were then dried at 60 °C for 12 h and dry weight (Wd) and the length (Ld) of the membranes were measured. The membrane swelling (MS) and water uptake (WU) of the membranes were calculated as follows:
 | (1) |
 | (2) |
2.6. Proton conductivity and ion-exchange capacity
The proton conductivity of membranes was measured by a four probe technique using an Autolab potentiostat/galvanostat taken between 0.1 Hz and 106 Hz at a voltage amplitude of 0.05 V. Before the test, the prepared membranes were soaked in 2 M sulfuric acid solution and deionized water, respectively. Four probe conductivity measurements was performed by a conductivity cell composed of two platinum wires sensing the potential drop, two platinum plates carrying the current and the proton conductivity was obtained as follows:
 | (3) |
The IEC of SPAFTx membranes was measured by the back-titration method.33 The membranes were immersed into a 2 M sulfuric acid solution for 12 h to ensure that all the Na+ ions were exchanged with H+ ions. Then the samples were soaked in deionized water until neutral pH was obtained and dried in an oven. The dried membrane was immersed into 1 M NaCl solution for 24 h and this solution was titrated with 0.01 M NaOH solution. The IEC of the membranes was calculated as follows:
 | (4) |
2.7. Membrane-electrode assembly (MEA) preparation and performance test
For single-cell testing, the anode and cathode electrodes were made by the coating of catalyst ink (including the Pt/C catalyst (20 wt% of Pt), 5 wt% Nafion solution, isopropyl alcohol, the suitable amount of water and glycerol) onto gas diffusion layer (carbon cloth, E-tek, HT 2500-W) by painting method. The electrodes were dried at 80 °C for 40 min and at 120 °C for 1 h, respectively. The Pt loading 0.25 mg cm−2 was kept for both anode and cathode electrodes. For preparation of MEA, two electrodes were located onto both side of the membrane and then hot pressed under 135 kg cm−2 pressure at 120 °C for 3 min. The PEMFC performances were measured at different temperatures using the FCT 1505 fuel cell test system. The H2 and O2 input flow rates were 120 and 300 mL min−1, respectively.3. Results and discussion
3.1. Synthesis and characterization of amine functionalized TiO2
Chemical structure of AFT nanoparticles was verified by FTIR spectroscopy (Fig. 2d). The peaks below 700 cm−1 were assigned to the stretching vibration of Ti–O and Ti–O–Ti groups in titania nanoparticles. The broad absorption peak at 3428 cm−1 and the low intensity peak at 1621 cm−1 in TiO2 spectra were ascribed to the O–H stretching vibration and bending vibration modes of adsorbed water as well as hydroxyl groups, respectively.34 The symmetrical and asymmetrical vibrations of –CH2 groups and also the bending vibration of C–H groups were observed at 2854, 2923 and 1461 cm−1. Furthermore, the stretching vibration of Si–O–Si groups at 1030 and 1130 cm−1 was observed in the spectrum of the AFT nanoparticles.35,36 The peak at 940 cm−1 is allocated to Ti–O–Si vibration.34,37 These bands confirmed the successful surface modification of the TiO2 nanoparticles with silane coupling agent.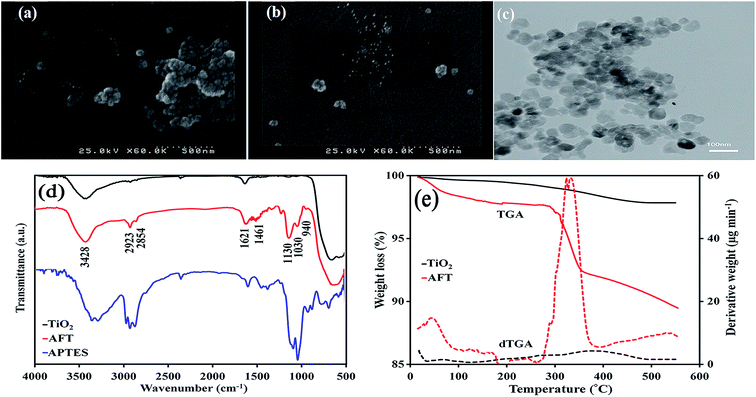 | ||
| Fig. 2 SEM images of TiO2 (a) and AFT (b), TEM image of AFT nanoparticles (c), FTIR spectra of TiO2, AFT and APTES (d) and TGA curves and corresponding dTGA curves of nanoparticles (e). | ||
Also, TGA was utilized to illustrate the successful surface modification of the TiO2 with APTES. The TGA and differential TGA (dTGA) curves are shown in Fig. 2e. The amount of APTES grafted on the surface of TiO2 was estimated from the resultant curve and obtained at least 9.2%. The weight loss of the bare TiO2 nanoparticles was attributed to desorption of adsorbed water and dehydration of the hydroxyl groups.38 AFT nanoparticles exhibited two-step degradation in the temperature between 50–550 °C. The first step at the temperature range of 50–200 °C is assigned to the evaporation of adsorbed water and further condensation of APTES.39 The second step at the temperature range of 250–600 °C was attributed to degradation of the aminopropyl groups from the nanoparticles surface. The boiling temperature of APTES, 217 °C, is lower than the degradation temperature of APTES grafted on TiO2 nanoparticles. Hence, it can be assumed that there was chemical bonding between the TiO2 nanoparticles and APTES.
The morphological features of TiO2 and AFT nanoparticles were observed by the SEM and TEM images as shown in Fig. 2. It can be seen from Fig. 2a and b that TiO2 nanoparticles were agglomerated while AFT nanoparticles were dispersed well. This comparison indicates that the APTES plays a key role in the improvement of the interfacial interaction between nanoparticles. Fig. 2c is the TEM image of AFT nanoparticles. It was found that modified nanoparticles were discrete and agglomeration decreased effectively due to the attraction between the particles was decreased.
3.2. Characterization of membranes
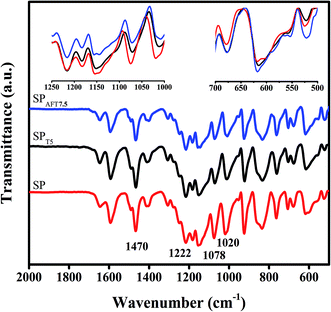
ATR spectra of representative membranes, SP, SPT5 and SPAFT7.5, are displayed in Fig. 3.The successful sulfonation of PEEK backbone was verified by observing characteristic peaks at 1020, 1078 and 1222 cm−1, corresponding to the symmetric and asymmetric stretching vibrations of sulfonic acid groups.26 The intensity of these peaks in SPT5 and SPAFT7.5 membranes were found relatively lower, which indicated the interaction between SO3H groups and functional groups of nanoparticles.25 The peaks at 1470 and 1490 cm−1 were attributed to C![[double bond, length as m-dash]](https://www.rsc.org/images/entities/char_e001.gif) C stretching vibration of the aromatic rings.3 After incorporating TiO2 and AFT nanoparticles into membranes, the intensity of the peaks at range of 550–700 cm−1 slightly increased likely due to overlapping TiO2 absorption peak (Ti–O–Ti) with the polymer peaks and the increase was more evident in SPAFT7.5 than SPT5.
C stretching vibration of the aromatic rings.3 After incorporating TiO2 and AFT nanoparticles into membranes, the intensity of the peaks at range of 550–700 cm−1 slightly increased likely due to overlapping TiO2 absorption peak (Ti–O–Ti) with the polymer peaks and the increase was more evident in SPAFT7.5 than SPT5.
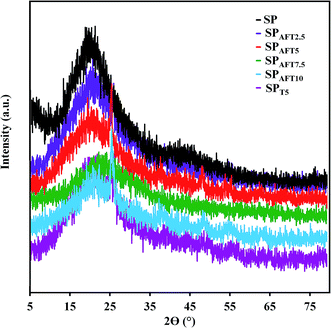
SPEEK and nanocomposite membranes were characterized by XRD to investigate the structural changes resulting from incorporation of AFT and TiO2 nanoparticles. XRD patterns of the as-prepared membranes based on AFT nanoparticles are presented in Fig. 4. It is clear that the crystallinity of PEEK decreased after sulfonation because of incorporation of sulfonic acid groups on the polymer chain randomly.40 SPEEK showed a broad crystalline peak on the 2θ of 18–19°. It can be seen that the peak intensity of the SPT5 and SPAFTx membranes was greatly reduced compared with the SP membrane due to the incorporation of nanoparticles which means that the degree of crystallinity is decreased. Also, SPAFT5 showed lower crystallinity than SPT5 due to better dispersion of these nanoparticles. These results show that more amorphous domains were created in SPAFTx nanocomposite membranes, indicating the AFT nanoparticles were mixed with SPEEK matrix homogeneously and the membrane structure was more disordered. The amorphous structure of nanocomposite membranes is useful for the enhancement of ionic conductivity.41,42 However, AFT incorporation further (more than 10%) slightly increases the peak intensity likely because the aggregation of nanoparticles.
The crystallinity percentage (Xc) of the SP, SPT5 and SPAFTx nanocomposite membranes was calculated by the empirical relation between Xc and β according to eqn (5).42
| β × (Xc)1/3 = KA | (5) |
| Membrane | FWHM (Rad.) | Crystallinity (%) |
|---|---|---|
| SP | 0.1601 | 3.3687 |
| SPAFT2.5 | 0.2430 | 0.9634 |
| SPAFT5 | 0.2469 | 0.9185 |
| SPAFT7.5 | 0.2611 | 0.7766 |
| SPAFT10 | 0.2252 | 1.2104 |
| SPT5 | 0.2366 | 1.0437 |
3.3. Morphology and surface topography
Cross-section FESEM images of as-prepared membranes are indicated in Fig. 5. All of the membranes were synthesized without obvious structural defects. The AFT nanoparticles were dispersed homogeneously within the membrane compared with TiO2 nanoparticles with the particle size of about 21 nm. TiO2 nanoparticles tend to aggregation (Fig. 5d) which was attributed to high surface energy of nanoparticles and low compatibility with polymer matrix. Aggregation of nanoparticles likely created relatively large regions devoid of any nanoparticle in the membrane that disconnected the transportation of the proton in membrane.25 The grafting of APTES onto TiO2 nanoparticles caused uniform dispersion of AFT nanoparticles in nanocomposite membranes due to interaction between NH2 groups of AFT nanoparticles and SO3H groups of SPEEK matrix. The interfacial compatibility between AFT nanoparticles and polymer matrix is conducive for creation proton transfer continues channels.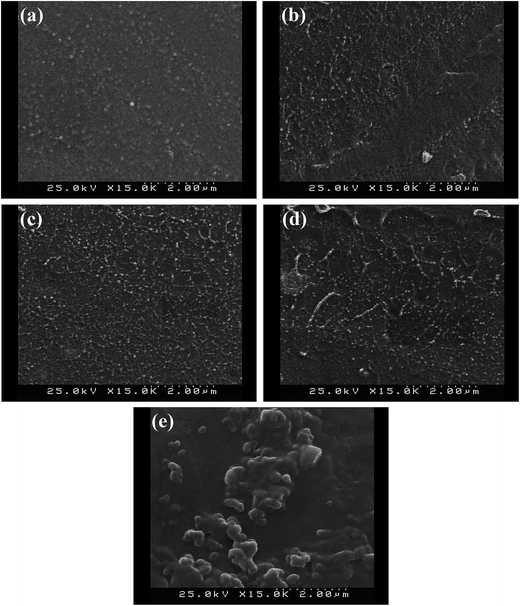 | ||
| Fig. 5 FESEM images of cross-section of the nanocomposite membranes: SPAFT2.5 (a), SPAFT5 (b), SPAFT7.5 (c) and SPAFT10 (d) and SPT5 (e). | ||
Surface roughness is another key factor which has a significant effect on the water uptake and proton conductivity properties of the membranes. Fig. 6 indicates AFM images (2D and 3D) of the SP, SPT5 and SPAFTx nanocomposite membranes at a scan size of 5 μm × 5 μm. The bright and dark regions in the images are related to the differences in domain hardness. The bright regions were dedicated to the hydrophobic polymer backbone and the dark regions were ascribed to a soft structure, which represent the hydrophilic sulfonic acid groups.43 From Fig. 6, the surface topography of the prepared membranes changed considerably after incorporation of nanoparticles. The roughness average (Ra) of SP was 4.06 nm, whereas the Ra of SPAFT2.5, SPAFT5, SPAFT7.5, SPAFT10 and SPT5 nanocomposite membranes increased to 6.74, 8.59, 10.80, 14.82 and 12.01 nm respectively. The increase of roughness might lead to the improvement in the water uptake and thus the proton conductivity of the membranes due to higher surface area.43,44
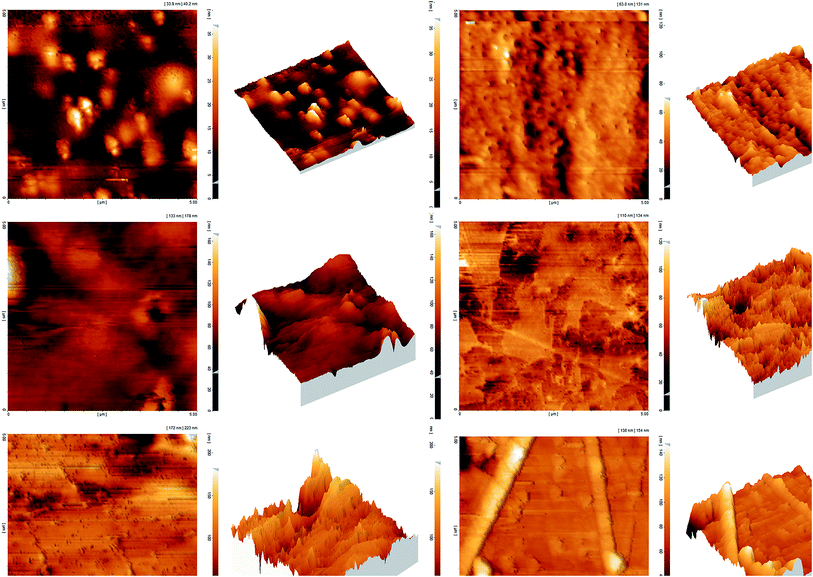 | ||
| Fig. 6 AFM images (3D and 2D) of SP (a), SPAFT2.5 (b), SPAFT5 (c), SPAFT7.5 (d), SPAFT10 (e) and SPT5 (f) membranes. | ||
3.4. Water uptake and membrane swelling
Water uptake and membrane swelling are vital parameters which directly effect on the most of the membrane properties. Fig. 7a displays the water uptake and swelling of SPTx and SPAFTx membranes at room temperature. The water uptake of the SPTx and SPAFTx nanocomposite membranes were higher than that of the SP membrane and increased significantly with increasing the nanofiller content in the nanocomposite membranes. This can be ascribed to the water retention character and the hydrophilic nature of TiO2 nanoparticles. Also, with increasing of AFT content, volume of water channels somewhat increased and the dead end channels interconnected.45 But, the further increase in the filler contents, more than 5 wt% for TiO2 and 7.5 wt% for AFT nanoparticles, resulted in a decrease in the water uptake content. It can be assigned to accumulation and the blocking effect of nanoparticles that may prevent from water molecules entrance to polymer matrix. Generally, water uptake of SPAFTx membranes was lower than SPTx membranes due to slightly lower hydrophilicity of AFT nanoparticles than TiO2 nanoparticles and also the formation of the hydrogen bond between SPEEK chains and AFT nanoparticles. However, at the higher contents of TiO2 (more than 5 wt%), water uptake of SPT7.5 and SPT10 membranes were lower than SPAFT7.5 and SPAFT10 membranes, respectively due to the agglomeration and the blocking effect of nanoparticles.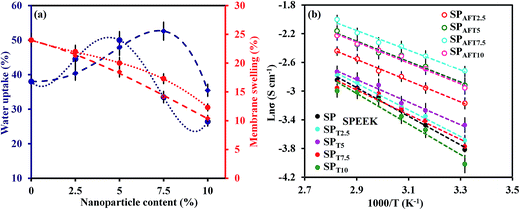 | ||
| Fig. 7 Water uptake and swelling of SPTx (dotted line) and SPAFTx membranes (dashed line) at 25 °C (a) and the proton conductivity of nanocomposite membranes as a function of temperatures (b). | ||
The high swelling of the membranes lead to low durability, low mechanical stability and so would decrease the fuel cell performance. Generally, reasonable swelling can provide larger space and more continuous pathways for proton transport through the membranes.25 From Fig. 7a, the membranes swelling in length declined with the addition of TiO2 and AFT nanoparticles. This result may be from two possible reasons. Firstly, TiO2 and AFT nanoparticles could interact with polymer matrix through hydrogen bonding and electrostatic force between their surface functional groups and sulfonic acid groups of polymer (–OH/–SO3H and –NH2/–SO3H). Secondly, interaction between polymer chains and nanoparticles limited the movement of chains in length. Although swelling in length direction was decreased, it was slightly increased in thickness direction. In other words, with addition of fillers, the water uptake and volume swelling were increased. The volume swelling was increased from 27% for SPEEK membrane to 34% and 30% for SP/T5 and SP/AFT7.5 membranes, respectively.
3.5. IEC and proton conductivity
IEC of a membrane indicates the amount of ionizable functional groups in the membrane and expresses as the number of acid groups per one gram of the sample. Normally, the membranes with high IEC value must demonstrate high proton conductivity due to the decrease in the distance between the ionizable groups.46 IEC values of SP, SPTx and SPAFTx membranes are given in Table 2. With increasing TiO2 and AFT nanoparticles contents from 0 to 10 wt%, the IEC values of membranes decreased from 1.95 to 1.79 and 1.77 meq g−1, respectively. The decrease was imputed to the impact of dilution of TiO2 particles, which lacked the SO3H groups, and also interaction between polymer SO3H groups and nanoparticles functional groups.47,48| Membrane | σ (S cm−1) | IEC (meq g−1) | Ea (kJ mol−1) | |
|---|---|---|---|---|
| (at 25 °C) | (at 80 °C) | |||
| SP | 0.022 | 0.058 | 1.95 | 15.61 |
| SPT2.5 | 0.025 | 0.062 | 1.90 | 14.48 |
| SPT5 | 0.031 | 0.065 | 1.87 | 12.30 |
| SPT7.5 | 0.023 | 0.052 | 1.83 | 13.45 |
| SPT10 | 0.018 | 0.050 | 1.79 | 16.64 |
| SPAFT2.5 | 0.042 | 0.087 | 1.88 | 11.55 |
| SPAFT5 | 0.054 | 0.115 | 1.84 | 11.15 |
| SPAFT7.5 | 0.066 | 0.132 | 1.82 | 10.73 |
| SPAFT10 | 0.052 | 0.105 | 1.77 | 11.34 |
Proton conductivity is a crucial parameter for evaluating the PEMs performance. Proton conductivity of a nanocomposite membrane is influenced by various factors such as IEC, water uptake, dispersion of inorganic fillers and their concentrations in polymer matrix. The proton conductivities of SP and their nanocomposite membranes with different concentration of TiO2 and AFT nanoparticles in 25 °C are shown in Table 2. Proton conductivity of SPEEK was enhanced with the increment in the amount of TiO2 and AFT nanoparticles in spite of the IEC value decline. This was ascribed to the hygroscopic properties of nanoparticles, their suitable dispersion in polymer matrix and channeling of water molecules at the interface of the polymer and nanoparticles49 which created straight transfer pathways for protons and facilitated the proton transfer through the membrane. However, at more than 5 wt% TiO2 and 7.5 wt% AFT, fillers act as barriers for proton conduction by blocking the proton transfer pathways. The reason may be predomination of dilution effect in higher concentration and the tendency of the TiO2 nanoparticles to aggregation with increasing the nanoparticle content in the membrane to more than 5 wt%. The SPAFTx membranes demonstrated higher proton conductivity than SPTx. With increasing amount of TiO2 and AFT nanoparticles (2.5–10 wt%), proton conductivity improved from 0.087 to 0.105 S cm−1 for SPAFTx membranes and decreased from 0.062 to 0.050 S cm−1 for SPTx membranes at 80 °C. Modification of TiO2 nanoparticles decreased their aggregation and augmented membranes proton conductivities. This is attributed to decrease of interparticle separation spacing which constructs connected proton transfer pathways. Furthermore, –NH2 groups provided the proton hopping sites to proton transfer through Grotthuss mechanism (Fig. 1).
Fig. 7b shows the proton conductivity of SP, SPTx and SPAFTx membranes at the temperature range of 25–80 °C. In higher temperatures, the proton conductivity enhanced due to increment of the water molecules movement and the mobility increment of the charged species in the membrane.50,51
The activation energy (Ea (kJ mol−1)) of the proton conduction in the as-prepared membranes was estimated according to Arrhenius equation:
σ = σ0![[thin space (1/6-em)]](https://www.rsc.org/images/entities/char_2009.gif) exp(−Ea/RT) exp(−Ea/RT)
| (6) |
A literature review on electrochemical properties of nanocomposite membranes based on some sulfonated polymers and Nafion 117 is demonstrated in Table 3. It is obvious that the electrochemical properties of the SPAFT7.5 membrane has improved compared to the other results reported in the literature. This enhancement is ascribed to the good dispersion of modified fillers and channeling of water molecules at the interface of the polymer and fillers which can make continues and straight transfer paths for protons. However, compared to Nafion, the power density of these nanocomposite membranes is yet relatively low, which must be enhanced.
| Membranes | Filler loading (%) | T (°C) | σ (S cm−1) | PDmax (mW cm−2) | Catalyst loading (mg cm−2) | Application | Ref. |
|---|---|---|---|---|---|---|---|
| a Sulfonated graphene oxide.b Sulfonated mesoporous benzene–silica.c Sulfonated montmorillonite.d Organic montmorillonite.e Iron titanate.f Titania nanosheet.g Montmorillonite.h Dopamine modified silica nanoparticles.i Phosphonic acid functionalized titania nanoparticles.j Amino acid-functionalized titania nanoparticles.k 12-Phosphotungsticacid.l Polydopamine modified graphene oxide sheets.m Amine functionalized iron titanate.n Sulfonated poly imide.o Sulfonated propylsilane graphene oxide.p Sulfonated poly ether sulfone.q Sulfonated grapheme oxide. | |||||||
| SP | 0 | 80 | 0.058 | 123 | 0.25 | PEMFC | — |
| SPT5 | 5 | 80 | 0.065 | 161 | 0.25 | PEMFC | — |
| SPAFT7.5 | 7.5 | 80 | 0.135 | 230 | 0.25 | PEMFC | — |
| SPEEK/SSGOa | 5 | 65 | 0.052 | 119.6 | 0.25 | PEMFC | 2 |
| SPEEK/sMBSb | 20 | 80 | 0.082 | — | — | — | 53 |
| SPEEK/sMMTc | 3 | 60 | 0.071 | 19 | 4 | DMFC | 54 |
| SPEEK/OMMTd | 5 | 90 | 0.012 | — | — | — | 55 |
| SPEEK/OMBb | 15 | 80 | 0.079 | 56 | 1.3 | DMFC | 56 |
| SPEEK/ITe | 2 | 80 | — | 188 | 0.25 | PEMFC | 24 |
| SPEEK/TNSf | 1.67 | 140 | 0.041 | — | — | — | 57 |
| SPEEK/MMTg | 1 | 25 | 0.017 | — | — | — | 58 |
| SPEEK/DSih | 9 | 55 | 0.033 | 111.7 | 0.25 | PEMFC | 25 |
| SPEEK/TOLPi | 6 | 65 | 0.334 | — | — | — | 59 |
| SPEEK/TNCj | 15 | 25 | 0.062 | — | — | — | 26 |
| CSPEEK/HPWk/meso-SiO2 | 20 | 80 | 0.12 | — | — | — | 23 |
| SPEEK/DGOl | 5 | 30 | 0.018 | 192.1 | 0.25 | PEMFC | 60 |
| SPEEK/AITm | 2 | 80 | 0.12 | 204 | 0.25 | PEMFC | 30 |
| SPIn/SPSGOo | 8 | 90 | 0.125 | 75 | 5 | DMFC | 61 |
| SPESp/SGOq | 5 | 90 | 0.135 | — | — | — | 62 |
| Nafion 117 | — | 80 | 0.09 | — | — | — | 63 |
| Recast Nafion | — | 80 | 0.018 | 640 | 0.4 | PEMFC | 3 |
3.6. Thermal stability and mechanical properties
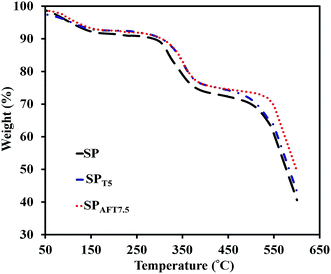
Thermal and mechanical properties are vital parameters of PEMs for application in the PEMFCs. The thermal stability of representative membranes, including SP, SPT5 and SPAFT7.5, were evaluated by the TGA analysis from 50 to 600 °C (Fig. 8). All three membranes demonstrated similar TGA curves comprising of three weight loss stages. The first stage (80–100 °C) was corresponded to the evaporation of residual solvent and physically adsorbed water. The second stage around 300–400 °C was ascribed to the disintegration of SO3H groups of polymer.50 The third stage started from about 450 °C was assigned to the destruction of the polymer backbone. The presence of TiO2 and AFT nanoparticles slightly delayed the oxidative degradation of polymer matrix and improved thermal stability of the nanocomposite membranes. The nanocomposite membranes showed enough thermal stability up to 300 °C, which are eligible for PEMFCs application.The mechanical stability of the as-prepared membranes was examined by UTM. Young's modulus (YM), tensile strength (TS) and elongation at break (EB) of SPTx and SPAFTx membranes are revealed in Fig. 9. The pure SPEEK indicated YM of 700 MPa and TS of 32.6 MPa. SPT2.5 and SPT5 membranes illustrated higher TS and YM compared to the SP membrane. With the increase of TiO2 nanoparticles content (above 5%), TS and YM of nanocomposite membranes decreased because of the aggregation of the TiO2 nanoparticles in SPEEK matrix. For SPAFTx membranes, with increasing AFT nanoparticles from 2.5–10% both TS and YM increased from 34.6 to 44.3 MPa and 816 to 1391 MPa, respectively. With the modification of TiO2 nanoparticles, the interaction between AFT nanoparticles and polymer matrix improved and the structure of membranes were more compressed. Also, the homogeneous distribution of modified nanoparticles in the membrane could reduce the repletion of stress in polymer matrix by its transfer to nanoparticles.8,20 But, EB of SPAFTx membranes decreased compared with SP membrane, likely due to interaction between NH2 groups of AFT nanoparticles and SO3H groups of SPEEK matrix.
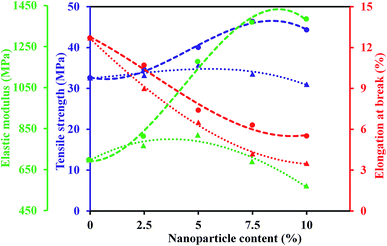 | ||
| Fig. 9 Mechanical properties of SPTx (dotted line) and SPAFTx (dashed line) at different content of nanoparticles. | ||
3.7. Fuel cell performance
The current density–potential and current density–power density curves of representative membranes, including SP, SPT5 and SPAFT7.5 nanocomposite membranes in a single cell operating at 80 °C and 90% relative humidity are shown in Fig. 10. SP membrane indicated the maximum current density (Imax) of about 515 mA cm−2 and the maximum power density (PDmax) of 123 mW cm−2. The PEMFC performances of the nanocomposite membranes were enhanced after TiO2 and AFT incorporation. It was found that incorporating 7.5% AFT caused a 100.6% increase in Imax (1033 mA cm−2) and an 86.7% increase in PDmax (230 mW cm−2). Compared to AFT, TiO2 displayed similar effect in enhancing the fuel cell performances of SPEEK-based membrane, and SPT5 acquired the Imax and PDmax of 720 mA cm−2 and 161 mW cm−2 respectively. This enhancement was attributed to the improved proton conductivities and water uptake of the SPT5 and SPAFT7.5 membranes compared with pure SPEEK membrane.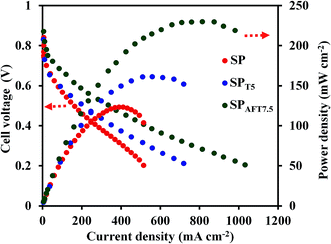 | ||
| Fig. 10 The current density–potential and current density–power density curves of the SP, SPT5 and SPAFT7.5 membranes at 80 °C. The H2 and O2 flow rates were 120 and 300 mL min−1, respectively. | ||
4. Conclusion
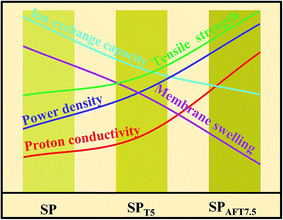
SPEEK-based membranes were synthesized by embedding TiO2 and AFT nanoparticles by the solution casting method. Characterization of AFT nanoparticles by FTIR, TGA and TEM demonstrated that TiO2 nanoparticles were well modified. The influences of AFT nanoparticles on the water uptake, proton conductivity and thermal stability, mechanical properties and PEMFC performance of nanocomposite membranes were investigated. It was observed that by increasing the AFT amount from 0 to 10 wt%, the proton conductivity augmented from 0.058 S cm−1 to 0.135 S cm−1 at 80 °C due to channeling of water molecules at the interface of the polymer and AFT and the decrease of the interparticle separation spacing which construct connected proton transfer pathways. At the same time, the activation energy results, calculated at the temperature between 25 and 80 °C, confirmed that the NH2 groups provided additional sites for proton transfer through Grotthuss mechanism. As a result, SPAFTx membranes showed higher proton conductivity than SP and SPTx membranes. The SPAFT7.5 membrane attained higher PEMFC performance (the current density and power density of 335 mA cm−2 and 178 mW cm−2 at a cell voltage of 0.5 V at 80 °C, respectively) than SP and SPAFTx membranes at 80 °C due to its higher proton conductivity. The effect of AFT nanoparticles on the properties of the membranes is summarized in Fig. 11. With addition of modified TiO2 nanoparticles, swelling in length and IEC of membranes was decreased. Also, nanocomposite membrane containing 7.5 wt% AFT nanoparticles showed higher tensile strength, proton conductivity and power density compared with SPEEK and SP/T5 membranes. The excellent proton conductivity and good performance made the SPAFTx membranes attractive candidates for application in PEMFCs.Acknowledgements
We gratefully acknowledge the financial support from Amirkabir University of Technology (Tehran, Iran), Renewable Energy Research Center (RERC) and Iranian National Science Foundation (INSF).References
- V. Kurdakova, E. Quartarone, P. Mustarelli, A. Magistris, E. Caponetti and M. L. Saladino, J. Power Sources, 2010, 195, 7765–7769 CrossRef CAS.
- L. Zhao, Y. Li, H. Zhang, W. Wu, J. Liu and J. Wang, J. Power Sources, 2015, 286, 445–457 CrossRef CAS.
- Zh. Di, Q. Xie, H. Li, D. Mao, M. Li, D. Zhou and L. Li, J. Power Sources, 2015, 273, 688–696 CrossRef CAS.
- A. K. Mohanty, E. A. Mistri, S. Banerjee, H. Komber and B. Voit, Ind. Eng. Chem. Res., 2013, 52, 2772–2783 CrossRef CAS.
- A. M. Attaran, M. Javanbakht, K. Hooshyari and M. Enhessari, Solid State Ionics, 2015, 269, 98–105 CrossRef CAS.
- A. Mayahi, A. F. Ismail, H. Ilbeygi, M. H. D. Othman, M. Ghasemi, M. N. A. M. Norddin and T. Matsuura, Sep. Purif. Technol., 2013, 106, 72–81 CrossRef CAS.
- H. Beydaghi, M. Javanbakht, H. Salar Amoli, A. Badiei, Y. Khanianid, M. R. Ganjali, P. Norouzi and M. Abdouss, Int. J. Hydrogen Energy, 2011, 36, 13310–13316 CrossRef CAS.
- P. Salarizadeh, M. Javanbakht, M. Abdollahi and L. Naji, Int. J. Hydrogen Energy, 2013, 38, 5473–5479 CrossRef CAS.
- K. Hooshyari, M. Javanbakht, A. Shabanikia and M. Enhessari, J. Power Sources, 2015, 276, 62–72 CrossRef CAS.
- A. Shabanikia, M. Javanbakht, H. Salar Amoli, K. Hooshyari and M. Enhessari, J. Electrochem. Soc., 2014, 161, 1403–1408 CrossRef.
- H. Beydaghi, M. Javanbakht and E. Kowsari, Ind. Eng. Chem. Res., 2014, 53, 16621–16632 CrossRef CAS.
- H. Beydaghi and M. Javanbakht, Ind. Eng. Chem. Res., 2015, 54, 7028–7037 CrossRef CAS.
- K. Hooshyari, M. Javanbakht, L. Naji and M. Enhessari, J. Membr. Sci., 2014, 454, 74–81 CrossRef CAS.
- R. Padmavathi and D. Sangeetha, Ionics, 2013, 19, 1423–1436 CrossRef CAS.
- Z. Jiang, X. Zhao and A. Manthiram, Int. J. Hydrogen Energy, 2013, 38, 5875–5884 CrossRef CAS.
- A. K. Mishra, N. H. Kim, D. Jung and J. H. Lee, J. Membr. Sci., 2014, 458, 128–135 CrossRef CAS.
- Q. Xie, Y. Li, X. Chen, J. Hu, L. Li and H. Li, J. Power Sources, 2015, 282, 489–497 CrossRef CAS.
- S. Molla and V. Compan, Int. J. Hydrogen Energy, 2014, 39, 5121–5136 CrossRef CAS.
- S. L. Zhong, X. J. Cui, H. L. Cai, T. Z. Fu, C. Zhao and H. Na, J. Power Sources, 2007, 164, 65–72 CrossRef CAS.
- S. Sasikala, S. Meenakshi, S. D. Bhat and A. K. Sahu, Electrochim. Acta, 2014, 135, 232–241 CrossRef CAS.
- P. Kalappa and J. H. Lee, Polym. Int., 2007, 56, 371–375 CrossRef CAS.
- S. Seetharamana, S. C. Raghub and K. Ansari Mahabadia, J. Energy Chem., 2016, 25, 77–84 CrossRef.
- J. M. Song, H. S. Woo, J. Y. Sohn and J. Shin, J. Ind. Eng. Chem., 2016, 36, 132–138 CrossRef CAS.
- P. Salarizadeh, M. Javanbakht and S. Pourmahdian, Solid State Ionics, 2015, 281, 12–20 CrossRef CAS.
- J. Wang, H. Bai, H. Zhang, L. Zhao, H. Chen and Y. Li, Electrochim. Acta, 2015, 152, 443–455 CrossRef CAS.
- Y. Yin, T. Xu, G. He, Z. Jiang and H. Wu, J. Power Sources, 2015, 276, 271–278 CrossRef CAS.
- H. Wu, X. Shen, T. Xu, W. Hou and Z. Jiang, J. Power Sources, 2012, 213, 83–92 CrossRef CAS.
- A. Sivasankaran and D. Sangeetha, Fuel, 2015, 159, 689–696 CrossRef CAS.
- H. Zhang, T. Zhang, J. Wang, F. Pei, Y. He and J. Liu, Fuel Cells, 2013, 13, 1155–1165 CrossRef CAS.
- P. Salarizadeh, M. Javanbakht, S. Pourmahdian and H. Beydaghi, Chem. Eng. J., 2016, 299, 320–331 CrossRef CAS.
- J. Hou, G. Dong, Y. Ye and V. Chen, J. Membr. Sci., 2014, 452, 229–240 CrossRef CAS.
- J. Hou, G. Dong, B. Luu, R. G. Sengpiel, Y. Ye, M. Wessling and V. Chen, Bioresour. Technol., 2014, 169, 475–483 CrossRef CAS PubMed.
- S. Molla and V. Compan, J. Membr. Sci., 2015, 492, 123–136 CrossRef CAS.
- J. Zhao, M. Milanova, M. M. C. G. Warmoeskerken and V. Dutschk, Colloids Surf., A, 2012, 413, 273–279 CrossRef CAS.
- N. Majoul, S. Aouida and B. Bessais, Appl. Surf. Sci., 2015, 331, 388–391 CrossRef CAS.
- P. Salarizadeh, M. Javanbakht and M. Abdollahi, Iran. Polym. J., 2012, 21, 661–668 CrossRef CAS.
- C. Wang, H. Mao, C. Wang and S. Fu, Ind. Eng. Chem. Res., 2011, 50, 11930–11934 CrossRef CAS.
- H. Wang, M. Peng, J. Zheng and P. Li, J. Colloid Interface Sci., 2008, 326, 151–157 CrossRef CAS PubMed.
- I. Brnardic, M. Huskic, P. Umek and T. H. Grguric, Ceram. Int., 2013, 39, 9459–9464 CrossRef CAS.
- R. S. Malik, P. Verma and V. Choudhary, Electrochim. Acta, 2015, 152, 352–359 CrossRef CAS.
- M. Kim, L. Lee, Y. Jung and S. Kim, J. Nanosci. Nanotechnol., 2013, 13, 7865–7869 CrossRef CAS PubMed.
- R. Vinodh, M. Purushothaman and D. Sangeetha, Int. J. Hydrogen Energy, 2011, 36, 7291–7302 CrossRef CAS.
- C. Del Rio, E. Morales and P. G. Escribano, Int. J. Hydrogen Energy, 2014, 39, 5326–5337 CrossRef CAS.
- S. Neelakandan, P. Kanagaraj, A. Nagendran, D. Rana, A. Muthumeenal and T. Matsuura, Renewable Energy, 2015, 78, 306–313 CrossRef CAS.
- H. Zhang, C. Ma, J. Wang, X. Wang, H. Bai and J. Liu, Int. J. Hydrogen Energy, 2014, 39, 974–986 CrossRef CAS.
- G. Rambabu and S. D. But, Chem. Eng. J., 2014, 243, 517–525 CrossRef CAS.
- A. Shirdast, A. Sharif and M. Abdollahi, J. Power Sources, 2016, 306, 541–551 CrossRef CAS.
- T. Fu, J. Wang, J. Ni, Z. Cui, S. Zhong, C. Zhao, H. Na and W. Xing, Solid State Ionics, 2008, 179, 2265–2273 CrossRef CAS.
- M. J. Kayser, M. X. Reinholdt and S. Kaliaguine, J. Phys. Chem. B, 2010, 114, 8387–8395 CrossRef CAS PubMed.
- S. Feng, Y. Shang, G. Liu, W. Dong, X. Xie, J. Xu and V. K. Mathur, J. Power Sources, 2010, 195, 6450–6458 CrossRef CAS.
- Y. Li, Q. T. Nguyen, P. Schaetzel, C. Lixon-Buquet, L. Colasse, V. Ratieuville and S. Marais, Electrochim. Acta, 2013, 111, 419–433 CrossRef CAS.
- C. Y. Huang, J. S. Lin, W. H. Pan, C. M. Shih, Y. L. Liu and S. J. Lue, J. Power Sources, 2016, 303, 267–277 CrossRef CAS.
- J. Park and D. Kim, Int. J. Hydrogen Energy, 2014, 39, 1063–1070 CrossRef CAS.
- R. Gosalawit, S. Chirachanchai, S. Shishatskiy and S. P. Nunes, J. Membr. Sci., 2008, 323, 337–346 CrossRef CAS.
- Z. Gaowen and Z. Zhentao, J. Membr. Sci., 2005, 261, 107–113 CrossRef.
- E. B. Cho, D. X. Luu and D. Kim, J. Membr. Sci., 2010, 351, 58–64 CrossRef CAS.
- D. Marani, A. Epifanio, E. Traversa, M. Miyayama and S. Licoccia, Chem. Mater., 2010, 22, 1126–1133 CrossRef CAS.
- M. M. Hasani-Sadrabadi, S. H. Emami, R. Ghaffarian and H. Moaddel, Energy Fuels, 2008, 22, 2539–2542 CrossRef CAS.
- H. Wu, Y. Cao, Z. Li, G. He and Z. Jiang, J. Power Sources, 2015, 273, 544–553 CrossRef CAS.
- Y. He, J. Wang, H. Zhang, T. Zhang, B. Zhang, S. Cao and J. Liu, J. Mater. Chem. A, 2014, 2, 9548–9558 CAS.
- R. P. Pandey, A. K. Thakur and V. K. Shahi, ACS Appl. Mater. Interfaces, 2014, 6, 16993–17002 CAS.
- S. Gahlot, P. P. Sharma, V. Kulshrestha and P. K. Jha, ACS Appl. Mater. Interfaces, 2014, 6, 5595–5601 CAS.
- J. Park, S. Y. Han and D. Kim, Int. J. Hydrogen Energy, 2015, 40, 8160–8171 CrossRef CAS.
| This journal is © The Royal Society of Chemistry 2017 |

