 Open Access Article
Enhanced degradation of gaseous benzene by a Fenton reaction†
Gaoyuan Liu ,
Haibao Huang
 *,
Ruijie Xie,
Qiuyu Feng,
Ruimei Fang,
Yajie Shu,
Yujie Zhan,
Xinguo Ye and
Cheng Zhong
School of Environmental Science and Engineering, Sun Yat-Sen University, Guangzhou, China. E-mail: seabao8@gmail.com
First published on 22nd December 2016
Abstract
A wet scrubbing process coupled with advanced oxidation processes (AOP) has raised great interest for the abatement of volatile organic compounds (VOCs) owing to its strong oxidation capacity and few byproducts. Fenton as an AOP has been widely used in wastewater treatment. However, the dosing method of Fenton reagents is not suitable for the treatment of continuous-flow VOCs waste-gas since H2O2, a major reagent in the Fenton reaction, will be rapidly eliminated. In this study, the Fenton process was used to enhance benzene degradation in an aeration container with intermittent dosing of H2O2. With the same total dosage of H2O2, the benzene removal efficiency reached 85% by intermittent dosing while it was quickly decreased to 0% by dosing in a lump. The generated CO2 by intermittent dosing of H2O2 is nearly 3 times that in the latter. In addition, no by-product was generated in the gas phase. The possible pathways and mechanism of benzene degradation by the Fenton process were proposed according to the detected intermediates in the solution. This study provides a simple and efficient way to significantly enhance VOCs degradation by a Fenton reaction.
Introduction
Many volatile organic compounds (VOCs) are harmful to human health and detrimental to the atmospheric environment. Some of them have potential toxicity and carcinogenicity.1 They are key precursors for the formation of atmospheric secondary organic aerosols (SOA) and O3. Many attempts have been made to remove VOCs pollution using physical, chemical and biological methods,2 including absorption,3 catalytic combustion,4 photocatalytic oxidation5 and biofilters.6 However, these methods still cannot meet with the increasingly stringent discharge standards. For example, the process of adsorption just transfers VOCs from waste gas to the adsorbent but does not destroy them. Catalytic combustion needs expensive catalysts and excessive energy consumption for low-concentration VOCs. Photocatalytic oxidation has some disadvantages such as catalytic deactivation and low efficiency.7 Worst of all, these removal methods may produce intermediates, resulting in secondary gaseous pollution.8As an alternative technology, wet scrubbing process coupled with advanced oxidation processes (AOP) has raised great interest in VOCs degradation owing to its merits such as simplicity, strong oxidation capacity and mild reaction conditions.9,10 Fenton reagent, consisting of both H2O2 and ferrous sulfate, as an AOP has been widely used for wastewater treatment since it can generate highly active, non-specifically but short-lived ·OH.11–14 The overall mechanism of the Fenton reaction is generally known by reaction (1).15,16
| Fe2+ + H2O2 → Fe3+ + ·OH + OH− | (1) |
As for wastewater treatment, the pollutants are generally well mixed with Fenton reagent. Fenton reagents, including H2O2, could be dosed in a lump, generating ·OH to rapidly degrade contaminants in short time. However, such way of dosing H2O2 is not suitable for the treatment of waste-gas in continuous-flow since the oxidizing capacity was quickly decreased with the consumption of H2O2. Recently, photo-Fenton has been used to enhance VOCs degradation2,17 while it requires additional UV energy and still become inefficient with the consumption of H2O2. Therefore, it is of great interest to take simple and efficient steps to enhance oxidation capacity of Fenton reaction for VOCs degradation. In addition, as an emerging method for VOCs degradation, the mechanism of Fenton reaction is still not clear.
In this study, we firstly report the enhanced degradation of VOCs via the Fenton process by intermittent dosing of H2O2. Toxic and refractory benzene was chosen as a representative VOC. The intermediates from benzene degradation were detected and the possible pathways and mechanism of Fenton process were proposed.
Experimental methods
Chemicals and reagents
In the present study the H2O2 (30% solution, reagent grade) was obtained from Yong Da Chemical Reagents (Tianjin) while ferrous sulfate was provided from Sinopharm Chemical Reagent. Benzene vapor, generated from passing an air stream into a benzene solution, was used as an indicative VOC. The benzene solution was saved in the refrigerator for a stable supply of VOC. The intermediates, generated from the benzene degradation, were extracted by dichloromethane. Both the liquid benzene (analytical grade) and dichloromethane (chromatographic grade) were obtained from Tianjin Fuyu Fine Chemical. Sulfuric acid, which was used to adjust the pH value of Fenton reagent, was acquired from Guangzhou Chemical Reagent Factory. All the reagents were used without any further purification.Experimental setup
Schematic of the experimental setup is shown in Fig. 1. A continuous-flow aeration container, made of Pyrex glass with a diameter of 65 mm, height of 290 mm and effective volume of 0.5 L, was adopted for generating a stream of air containing the target pollutant. The temperature of the solution in the aeration container was kept at 25 °C by heat collection-constant temperature type magnetic stirrer (DF-101S, Gongyi Yu Hua Instrument). Air, free of CO2, was generated from a zero air generator (HGA-5L, Beijing Huilong). The air was used to bubble through a benzene solution to generate an air stream containing high concentration of benzene vapor. The benzene vapor was diluted in the buffer and then fed to the bottom of the reactor through an aerator. Flow rate of the simulated gas was set at 1 L min−1 and the initial concentration (C0) of benzene was fixed at 25 ppm. Fenton reagents, with 4 mmol of H2O2 and 1 mmol of ferrous ion, were added into the aeration container. The initial pH value of the solution was adjusted to 3.0 which is the optimal value for Fenton reactions.18 The concentrations of benzene (Ct), and CO2 (generated from benzene oxidation) in gas phase were measured by a gas chromatograph (GC) (9790II, Fuli) equipped with two flame-ionization detectors (FID). One FID was connected with a Rt-Q-BOND PLOT column (30 m × 0.25 mm id, film thickness 10 μm) and used for benzene analysis. The other FID equipped with a packed column (TDX-01, 3 m × 3 mm) followed by a methanizer which was used to determine the concentrations of CO2. Gas samples from the reaction system were dried and fed to the GC on-line by an automatic gas sampling valve. The intermediates from benzene degradation in the liquid and gas phase were extracted with dichloromethane and then analyzed by GC-MS (DSQII, Thermo Fisher). The acid substances, which cannot be extracted with dichloromethane from the liquid phase, were detected by the ion chromatography (DX-600, Dionex). The concentrations of H2O2,19 ferrous ion and total Fe ion in the solution were detected by a spectrophotometer (UV2550, Shimadzu). The concentrations of total carbon (TC), total organic carbon (TOC) and inorganic carbon (IC) were analyzed by a TOC meter (TOC-V CSH, Shimadzu).Results and discussion
Benzene degradation by Fenton
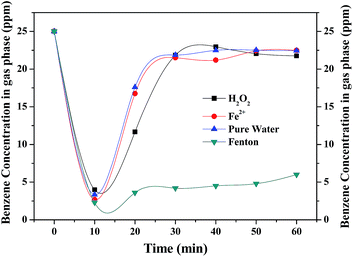
The performance of Fenton reaction for benzene degradation was compared with that of a reference solution made up with pure water. As shown in Fig. 2, without Fenton reagent, benzene removal in the initial stage is mainly ascribed to physical absorption by the water and no CO2 product was observed. In case of pure water, H2O2 and Fe2+ alone, benzene concentration at the outlet was quickly increased to about 22 ppm in 30 min due to the saturation of benzene absorption in the aqueous solution. As for Fenton reagent, benzene concentration sharply dropped to below 2.3 ppm and remained at about 5 ppm for 60 min, indicating that benzene was removed continuously by the Fenton reaction. The optimum [H2O2]/[Fe2+] ratio for Fenton reaction is approximately 4![[thin space (1/6-em)]](https://www.rsc.org/images/entities/char_2009.gif) :
:![[thin space (1/6-em)]](https://www.rsc.org/images/entities/char_2009.gif) 1 (shown in Fig. S1†). ·OH generated by the Fenton reagents rapidly attacked the organic molecules. However, with the consumption of the Fenton reagents and the amount of ·OH reduced, leading to a decrease in benzene removal efficiency after 90 min's reaction (shown in Fig. 3). Therefore, it is highly necessary to enhance the oxidizing capacity of the Fenton reaction.
1 (shown in Fig. S1†). ·OH generated by the Fenton reagents rapidly attacked the organic molecules. However, with the consumption of the Fenton reagents and the amount of ·OH reduced, leading to a decrease in benzene removal efficiency after 90 min's reaction (shown in Fig. 3). Therefore, it is highly necessary to enhance the oxidizing capacity of the Fenton reaction.
Effect of intermittent dosing of H2O2
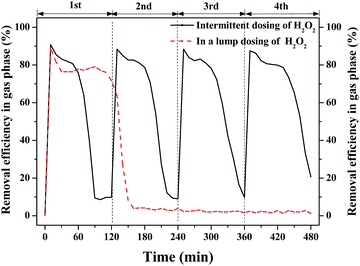
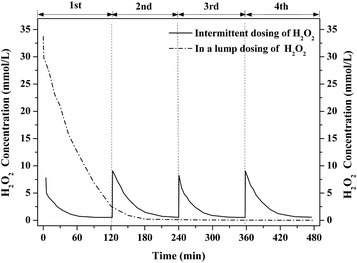
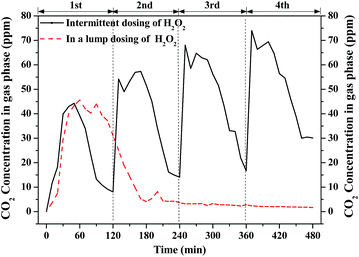
In the test of intermittent dosing, 4 mmol H2O2 was dosed into the 0.5 L aeration container every 2 h for 4 rounds while 16 mmol H2O2 was dosed once at a time as for the test of H2O2 dosing in a lump. Their performance for benzene degradation is shown in Fig. 3. Benzene removal efficiency [=(C0 − Ct)/C0 × 100%] in gas phase was gradually declined with the consumption of H2O2 in both cases. Benzene removal efficiency was kept at about 80% for nearly 90 min in the test of H2O2 dosing in a lump. Then, it dropped to near 0% after 150 min's reaction owing to the depletion of H2O2 as shown in Fig. 4. In the test of intermittent dosing of H2O2, the oxidizing capacity was kept for much longer time. The profiles of benzene degradation are similar in the 4 rounds of H2O2 dosing with benzene removal efficiency reached 85% in each run. After the benzene removal efficiency dropped to near 0%, the oxidizing capacity of Fenton was quickly recovered with the addition of H2O2. It is clear that benzene degradation via Fenton was greatly enhanced by intermittent dosing of H2O2. As for H2O2 dosing in a lump, H2O2 was soon consumed and abundant ·OH were generated while only part of the ·OH was used for benzene degradation due to its short-lived life. However, ·OH can be continuously generated and used for the degradation of continuous-flow benzene waste gas in the case of intermittent dosing of H2O2. It is expected that continuous supply of H2O2 or shorter interval time of H2O2 dosing would further improve the oxidizing ability.Fig. 5 shows the concentration of CO2 generated from benzene degradation by Fenton with the intermittent and the lump dosing cases. CO2 was quickly generated due to the generation of ·OH through the addition of H2O2 but its concentration dropped as the H2O2 was gradually consumed. The CO2 concentration reached 45 ppm after 30 min's reaction in the case of H2O2 dosing in a lump and dropped to nearly 0 ppm after 150 min's reaction. This is not completely consistent with the result of benzene removal efficiency probably due to the absorption of benzene and CO2 in the solution. As for intermittent dosing of H2O2, the CO2 concentration also reached about 45 ppm for the first round while it gradually increased to about 70 ppm in the fourth round. ·OH can be continuously generated in the case of intermittent dosing of H2O2. CO2 was formed not only from benzene degradation but also from the degradation of the intermediates in the solution. For the whole process, the CO2 yield with intermittent dosing of H2O2 is nearly 3 times of that of H2O2 dosing in a lump. It confirms that intermittent dosing of H2O2 can greatly enhance VOCs and its intermediates.
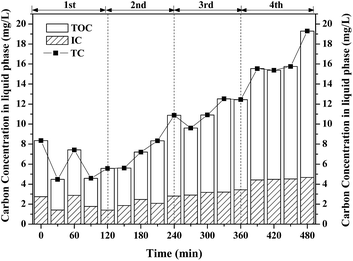
Theoretically, nearly 150 ppm of CO2 can be produced if all the removed benzene was completely oxidized into CO2. However, the measured concentration of CO2 at outlet is much lower than the theoretical value. ∼25% of CO2 (shown in Fig. S2†) was dissolved in solution, which was confirmed by IC. The residual removal benzene was oxidized into intermediates in gas-phase or liquid phase. However, no gaseous intermediates were detected by the GC-MS, showing that no by-product was discharged in the effluent during benzene degradation by Fenton reaction. The aqueous products of benzene degradation by intermittent dosing of H2O2 were analyzed by a TOC analyzer. The concentrations of TC, TOC and IC in the solution are shown in Fig. 6. Both TOC and IC were detected, and the TOC concentration was much larger than the IC concentration. IC mainly comes from mineralized products from benzene degradation and TOC mainly comes from intermediates or benzene dissolved in the solution. Both the IC and TOC concentration increased, from 1.5 mg L−1 to 4.6 mg L−1 and from 2.6 mg L−1 to 14.8 mg L−1, respectively. This indicated that the intermediates formed are soluble and could be easily trapped in the solution. The TOC concentration decreased after each dosing of H2O2, indicating that part of the intermediates were further oxidized by the Fenton reaction. This agrees well with the observed results of CO2 concentration variation profile shown in Fig. 5.
Mechanism of benzene degradation
Benzene degradation by Fenton reaction in an aeration container involves gas–liquid mass transfer of gaseous benzene and the following oxidation of dissolved benzene in the liquid, as shown in Fig. 7. Gaseous benzene was transferred into the liquid phase through the bubbling and the transfer rate of absorption is proportional to the driving force.16 As shown in Fig. 2, water has poor capacity for benzene absorption. However, the quick degradation of dissolved benzene in the solution can promote continuous benzene absorption.Fenton reaction involves electron transfer, leading to the generation of ·OH with strong oxidation capacity. The generation of ·OH is characterized by the reaction (1).
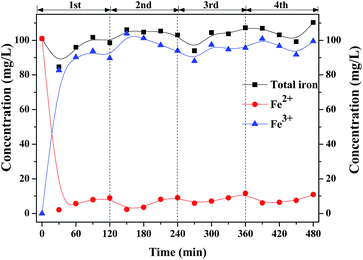
Fe2+ initiates the decomposition of H2O2 to generate ·OH. Fig. 8 shows the profiles of the concentration of Fe ions in the solution with intermittent dosing of H2O2. In the first round, the concentration of Fe2+ rapidly dropped from 101.0 mg L−1 to 2.1 mg L−1 as H2O2 was added into the solution and slightly increased to 7 mg L−1, indicating that partial Fe3+ can also be recovered to Fe2+, according to Fenton-like reactions (2) and (3).20,21
| Fe3+ + H2O2 → Fe2+ + HO2· + H2O | (2) |
| Fe3+ + HO2· → Fe2+ + O2 + H+ | (3) |
As shown in Fig. 8, most of them were converted into Fe3+ which seems difficult to be reduced back to Fe2+ through H2O2, whose reaction rate constant is only 0.02 M−1 s−1.22–24 Future work should be focused on the efficient transfer path of Fe3+ back to Fe2+.
The gaseous and aqueous intermediates from benzene degradation were identified by the GC-MS and the ion-chromatograph. No intermediates from benzene degradation were detected in the gas phase, which can prevent the discharge of gaseous by-products.17 As listed in Table 1, the intermediates in the solution are mainly phenolic, p-benzoquinone and acid substances dissolved. Phenol, observed by the GC-MS at m/z 94, is the main by-product in liquid for the Fenton process. The intensity of phenol peaks was gradually increased with intermittent dosing of H2O2 (shown in Fig. S3†), which accounts for the increased TOC concentration (Fig. 6). The residual phenol in solution can be easily removed by dosing more Fenton regent25–27 or treated in a separate sewage treatment process. Thus, Fenton also can be used as pretreatment method for the degradation of low-concentration VOCs.
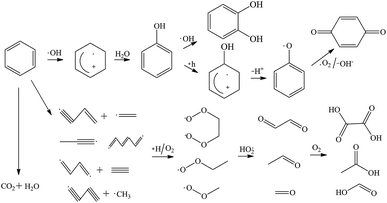
Based on the intermediates above, the possible pathways of benzene degradation were composed of benzene ring excitation and pyrolysis. ·OH is highly active and rapidly attack benzene and its degradation intermediates, generating CO2 and H2O.28–30 It was reported that benzene could be dehydrogenated and cleaved by ·OH, forming unsaturated hydrocarbon and radicals.31 The unsaturated hydrocarbon can react with active hydrogen and oxygen, generating aldehydes.32 The aldehydes were further oxidized into acid substances such as formic acid, acetic acid and oxalic acid.33 The excited benzene ring is firstly oxidized by ·OH to form phenol, which is further oxidized into pyrocatechol and p-benzoquinone.34,35 According to the detected products and by-products, the probable pathways of benzene degradation by the Fenton process were proposed as shown in Fig. 9.
Conclusions
In this study Fenton reaction was used for VOCs degradation in an aeration container. Benzene degradation was greatly enhanced by intermittent dosing of H2O2. With the same total dosage of H2O2, benzene removal efficiency reached 85% and the oxidation capacity was kept for longer time with intermittent dosing of H2O2 while the removal efficiency quickly decreased to 0% for the case of H2O2 dosing in a lump. The generated CO2 by intermittent dosing of H2O2 is nearly 3 times of that in the latter. In addition, no gaseous intermediates was generated and discharged. The intermittent dosing of H2O2 is demonstrated to be suitable for the degradation of continuous-flow waste-gas containing VOCs. The possible pathways and mechanism of benzene degradation by Fenton process were proposed according to the detected intermediates in the liquid phase. This study demonstrates that Fenton reaction is a promising process for the degradation of low-concentration VOCs with few gaseous byproducts under mild reaction conditions.Acknowledgements
The authors gratefully acknowledge the financial supports from National Key Research and Development Program (No. 2016YFC0204800), NSFC-RGC (No. 51561165015, No. N_HKU718/15), Guangdong Applied Science and Technology Research & Development Fund (2015B020236004), Guangdong Special Fund for Science and Technology Development (Hong Kong Technology Cooperation Funding Scheme) (No. 2016A050503022), Science and Technology Project in Guangzhou (No. 2014Y2-00094&2060404), and the Key Fundamental Research Fund for the Central Universities (15lgjc07).References
- A. Bouzaza, C. Vallet and A. Laplanche, J. Photochem. Photobiol., A, 2006, 177, 212–217 CrossRef CAS
.
- M. Handa, Y. Lee, M. Shibusawa, M. Tokumura and Y. Kawase, J. Chem. Technol. Biotechnol., 2013, 88, 88–97 CrossRef CAS
.
- T. K. Poddar and K. K. Sirkar, J. Membr. Sci., 1997, 132, 229–233 CrossRef CAS
.
- W. B. Li, J. X. Wang and H. Gong, Catal. Today, 2009, 148, 81–87 CrossRef CAS
.
- F. Dong, Y. Sun, M. Fu, W.-K. Ho, S. C. Lee and Z. Wu, Langmuir, 2011, 28, 766–773 CrossRef PubMed
.
- S. Mudliar, B. Giri, K. Padoley, D. Satpute, R. Dixit, P. Bhatt, R. Pandey, A. Juwarkar and A. Vaidya, J. Environ. Manage., 2010, 91, 1039–1054 CrossRef CAS PubMed
.
- H. Huang and W. Li, Appl. Catal., B, 2011, 102, 449–453 CrossRef CAS
.
- L. Rizzo, Water Res., 2011, 45, 4311–4340 CrossRef CAS PubMed
.
- A. Chebbi, H. Jaoua, S. Loukil, N. Mhiri, N. Ammar, S. Sayadi and M. Chamkha, Int. J. Environ. Sci. Technol., 2016, 13, 571–580 CrossRef CAS
.
- A. J. Feitz, J. Guan, G. Chattopadhyay and T. D. Waite, Chemosphere, 2002, 48, 401–406 CrossRef CAS PubMed
.
- S. Giannakis, M. I. P. López, D. Spuhler, J. A. S. Pérez, P. F. Ibáñez and C. Pulgarin, Appl. Catal., B, 2016, 198, 431–446 CrossRef CAS
.
- Y. Yuan, B. Lai, P. Yang and Y. Zhou, J. Taiwan Inst. Chem. Eng., 2016, 65, 286–294 CrossRef CAS
.
- L. A. G. Mora-Tovar, F. J. R. Valadez, O. Garcia, D. Fernandez and A. I. Zarate, The Electrochemical Society, 2016, 21, 1139 Search PubMed.
- A. J. dos Santos, M. D. de Lima, D. R. da Silva, S. Garcia-Segura and C. A. Martínez-Huitle, Electrochim. Acta, 2016, 208, 156–163 CrossRef
.
- J. Yoon, Y. Lee and S. Kim, Water Sci. Technol., 2001, 44, 15–21 CAS
.
- R.-S. Juang, S.-H. Lin and M.-C. Yang, J. Membr. Sci., 2005, 255, 79–87 CrossRef CAS
.
- M. Tokumura, Y. Wada, Y. Usami, T. Yamaki, A. Mizukoshi, M. Noguchi and Y. Yanagisawa, Chemosphere, 2012, 89, 1238–1242 CrossRef CAS PubMed
.
- M. Tokumura, M. Baba and Y. Kawase, Chem. Eng. Sci., 2007, 62, 7305–7311 CrossRef CAS
.
- N. V. Klassen, D. Marchington and H. C. E. McGowan, Anal. Chem., 1994, 66, 2921–2925 CrossRef CAS
.
- C. L. Hsueh, Y. H. Huang, C. C. Wang and C. Y. Chen, Chemosphere, 2005, 58, 1409–1414 CrossRef CAS PubMed
.
- J. De Laat, Y. H. Dao, N. Hamdi El Najjar and C. Daou, Water Res., 2011, 45, 5654–5664 CrossRef CAS PubMed
.
- E. Neyens and J. Baeyens, J. Hazard. Mater., 2003, 98, 33–50 CrossRef CAS PubMed
.
- L. Chen, J. Ma, X. Li, J. Zhang, J. Fang, Y. Guan and P. Xie, Environ. Sci. Technol., 2011, 45, 3925–3930 CrossRef CAS PubMed
.
- A. Rastogi, S. R. Al-Abed and D. D. Dionysiou, Water Res., 2009, 43, 684–694 CrossRef CAS PubMed
.
- L. G. C. Villegas, N. Mashhadi, M. Chen, D. Mukherjee, K. E. Taylor and N. Biswas, Current Pollution Reports, 2016, 2, 157–167 CrossRef
.
- Y. Yavuz, A. Savas Koparal and Ü. Bakir Ögütveren, Chem. Eng. Technol., 2007, 30, 583–586 CrossRef CAS
.
- R. Maciel, G. Sant'Anna and M. Dezotti, Chemosphere, 2004, 57, 711–719 CrossRef CAS PubMed
.
- M.-C. Lu, C.-J. Lin, C.-H. Liao, W.-P. Ting and R.-Y. Huang, Water Sci. Technol., 2001, 44, 327–332 CrossRef CAS PubMed
.
- J. Yoon, Y. Lee and S. Kim, Water Sci. Technol., 2000, 44, 15–21 Search PubMed
.
- D. Wu, M. Liu, D. Dong and X. Zhou, Microchem. J., 2007, 85, 250–256 CrossRef CAS
.
- M. Kang, B.-J. Kim, S. M. Cho, C.-H. Chung, B.-W. Kim, G. Y. Han and K. J. Yoon, J. Mol. Catal. A: Chem., 2002, 180, 125–132 CrossRef CAS
.
- M. R. Hoffmann, S. T. Martin, W. Choi and D. W. Bahnemann, Chem. Rev., 1995, 95, 69–96 CrossRef CAS
.
- Y. Luo and D. F. Ollis, J. Catal., 1996, 163, 1–11 CrossRef CAS
.
- R. M. Alberici and W. F. Jardim, Appl. Catal., B, 1997, 14, 55–68 CrossRef CAS
.
- J. Zhao and X. Yang, Building and Environment, 2003, 38, 645–654 CrossRef
.
Footnote |
| † Electronic supplementary information (ESI) available. See DOI: 10.1039/c6ra26016k |
| This journal is © The Royal Society of Chemistry 2017 |


