 Open Access Article
Creative Commons Attribution 3.0 Unported Licence
Performance of bimetallic PdRu catalysts supported on gamma alumina for 2-ethylanthraquinone hydrogenation†
Jinli Zhangab,
Kaige Gaoa,
Suli Wanga,
Wei Lia and
You Han *a
*a
aSchool of Chemical Engineering & Technology, Tianjin University, Tianjin 300072, P. R. China. E-mail: yhan@tju.edu.cn; Tel: +86-22-8535-1149
bSchool of Chemistry & Chemical Engineering, Shihezi University, Xinjiang, Shihezi 832000, P. R. China
First published on 19th January 2017
Abstract
A series of bimetallic PdRu catalysts supported on γ-Al2O3 were prepared by incipient wetness impregnation method and were assessed in the 2-ethylanthraquinone hydrogenation process. It is found that the addition of Ru to Pd can improve the catalyst's activity and maintain high selectivity at the same time for 2-ethylanthraquinone hydrogenation. Several analysis techniques including N2 adsorption–desorption, ICP-AES, XRD, TEM, H2-TPR, H2-TPD and XPS were adopted for characterizing the structural and electronic properties of the samples. It is revealed that PdRu bimetallic system shows stronger hydrogen desorption behavior in contrast to the monometallic catalysts. In addition, the higher fraction of Pd2+ and the presence of Ru4+ in the PdRu system may act as the electrophilic sites for the adsorption and activation of the C![[double bond, length as m-dash]](https://www.rsc.org/images/entities/char_e001.gif) O of the 2-ethylanthraquinone molecule through the lone electron pair of the oxygen atom. These factors may be attributed to the superior performance of PdRu bimetallic samples for 2-ethylanthraquinone hydrogenation.
O of the 2-ethylanthraquinone molecule through the lone electron pair of the oxygen atom. These factors may be attributed to the superior performance of PdRu bimetallic samples for 2-ethylanthraquinone hydrogenation.
1 Introduction
As an environmentally friendly oxidizing agent, hydrogen peroxide (H2O2) has been increasingly used in many fields, such as electronics, chemical synthesis, textile and pharmaceutical industries, paper bleaching, mining and waste water treatment, etc.1–7 By far, the anthraquinone (EAQ) process involving sequential hydrogenation and oxidation of an anthraquinone derivative (typically 2-ethylanthraquinone) is the most popular route for commercial scale production of H2O2.8–11 Specifically, 2-ethylanthraquinone (2-EAQ) in an appropriate mixture of solvents (typically C9–C10 aromatics and trioctyl phosphate) is hydrogenated catalytically to yield 2-ethylanthrahydroquinone (EAQH2). Then EAQH2 is oxidized to produce H2O2 with regeneration of the EAQ.12,13 However, various hydrogenation products besides EAQH2 are produced in the hydrogenation process due to further hydrogenation of EAQ, such as 2-ethyl-5,6,7,8-tetrahydroanthracene-9,10-diol (H4EAQH2), 2-ethyl-1,2,3,4,5,6,7,8-octahydroanthracene-9,10-diol (H8EAQH2) and 2-ethylanthrone (EAN), etc. Among them, only H4EAQH2 can be oxidized to generate H2O2 and H4EAQ, which can also be used in the production cycle of H2O2. Therefore, EAQ and H4EAQ are usually called as “active quinones” and other hydrogenation products which are not capable to produce H2O2 are considered as “degradation products”.14,15Hydrogenation of anthraquinone in the presence of metal catalyst is the key reaction in the synthesis of H2O2 through anthraquinone route. Supported palladium catalyst are commonly used in this process.16,17 Considering the growing demand of H2O2, development of a catalyst with superior performance and relatively low price is one of the most important issues to satisfy the requirements of efficiency and economy.
It is well known that supported bimetallic catalysts have attracted much attentions in the catalysis field, as such combination of metals can often lead to superior catalytic performance due to the synergetic effects.18 To improve the catalytic performance of Pd based catalysts for hydrogenation reactions, the effects of a second metal component additives, including Au,19–22 Ag,23 Pt,24,25 Zn,26 Cu,27 Co,28 Sn,29,30 Ni,31,32 etc. have been investigated extensively.
For 2-ethylanthraquinone hydrogenation process, continuous efforts have also been made to improve the catalytic performance by incorporating a second metal into Pd catalysts.33,34 Our previous work has reported that addition of Au to Pd can enhance the catalyst's activity for the hydrogenation of 2-ethylanthraquinone.35 However, considering its higher price of Au (almost twice of Pd), the application of this catalyst is also restricted. Hence, it remains a big challenge to find promising candidates in order to reduce the cost of catalysts to meet the requirements of economy.
PdRu, one of the most widely-studied bimetallic catalysts, has been reported to be active for selective hydrogenation of unsaturated organic compounds. Ntainjua et al. reported that addition of Ru enhanced the activity of Pd/TiO2 for direct synthesis of H2O2 from hydrogen and oxygen.36 Luo et al. reported that PdRu/TiO2 was not only exceptionally active but also excellent, sustained selectivity for the catalytic hydrogenation of levulinic acid to γ-valerolactone.37 Huang et al. found that bimetallic PdRu catalysts supported on mesoporous silica nanoparticle (MSN) showed 5 times higher activity than that of Pd/MSN towards the liquid-phase hydrogenation of phenol.38 Qiu et al. reported that the cinnamaldehyde conversion and the selectivity towards the hydrogenation of C![[double bond, length as m-dash]](https://www.rsc.org/images/entities/char_e001.gif) O bond over Pd–Ru/PCNT catalyst was better than Pd/PCNT and Ru/PCNT catalysts under the same reaction conditions, which might be due to the synergic effect of Pd and Ru metals or the promoting effect of Ru metal.39 Chen et al. reported bimetallic PdRu catalysts on porous alumina spheres behaved superior catalytic activity over monometallic ones for selective hydrogenation of dimethyl terephthalate (DMT) to dimethyl cyclohexane-1,4-dicarboxylate (DMCD).40 Yu et al. found that bimetallic PdRu nanoparticles could show high activity for hydrogenation of alkene.41
O bond over Pd–Ru/PCNT catalyst was better than Pd/PCNT and Ru/PCNT catalysts under the same reaction conditions, which might be due to the synergic effect of Pd and Ru metals or the promoting effect of Ru metal.39 Chen et al. reported bimetallic PdRu catalysts on porous alumina spheres behaved superior catalytic activity over monometallic ones for selective hydrogenation of dimethyl terephthalate (DMT) to dimethyl cyclohexane-1,4-dicarboxylate (DMCD).40 Yu et al. found that bimetallic PdRu nanoparticles could show high activity for hydrogenation of alkene.41
Generally, many researches have found the synergistic effect in PdRu catalysts and proved that PdRu bimetallic systems could exhibited superior performance than monometallic one for some hydrogenation reactions. Inspired by these encouraging findings, addition of Ru to Pd/γ-Al2O3 may be a feasible method to improve its performance for 2-ethylanthraquinone hydrogenation process. In addition, its relatively low price (only eight percent of Pd, four percent of Au) may meet the requirement of economy. However, as far as we can see, no studies have been published on supported PdRu bimetallic catalysts for the hydrogenation of 2-ethylanthraquinone. In addition, the promoting roles of Ru need be further investigated.
In our present work, we attempt to prepare a series of bimetallic PdRu/γ-Al2O3 catalysts with different Pd/Ru mass ratios by incipient wetness impregnation method and extensively investigated their performance for 2-ethylanthraquinone hydrogenation. Several analysis techniques including N2 adsorption–desorption, inductively coupled plasma-atomic emission spectrometry (ICP-AES), powder X-ray diffraction (XRD), transmission electron microscopy (TEM), X-ray photoelectron spectroscopy (XPS) and temperature programmed reduction of hydrogen (H2-TPR)/temperature programmed desorption of hydrogen (H2-TPD) were adopted for offering insights into the reasons for the superior catalytic performance of PdRu bimetallic system.
2 Experimental
2.1 Materials
Na2PdCl4 (AR, Energy Chemical, China); RuCl3·xH2O (AR, Aladdin, China); pseudoboehmite (AR, CNOOC Tianjin Chemical Research Institute, China); 2-ethylanthraquinone, trioctyl phosphate and trimethylbenzene (AR, TCI, Japan).2.2 Catalyst preparation
PdRu/γ-Al2O3 catalysts were prepared by the incipient wetness impregnation method. Na2PdCl4 was used as the Pd precursor and RuCl3·xH2O as the Ru precursor. Pseudoboehmite was calcined in air at 600 °C for 4 h to obtain γ-Al2O3, then it was used as the support. A slurry of γ-Al2O3 in a Na2PdCl4 and RuCl3 aqueous solution was stirred at 45 °C for 1 h. After excess water was evaporated, the impregnated samples were dried at 110 °C overnight and finally calcined in static air at 450 °C for 4 h. Four bimetallic catalysts were prepared with the same Pd loading amount (0.6%) and varying the Ru content (0.4%, 0.8%, 1.2%, 1.6%), which were named as 0.6Pd0.4Ru, 0.6Pd0.8Ru, 0.6Pd1.2Ru, 0.6Pd1.6Ru, respectively. For comparison, monometallic Pd (mono-Pd) with a metal content of 0.6 wt% (0.6Pd) and monometallic Ru (mono-Ru) catalysts with a metal content of 0.4 wt% (0.4Ru), 0.8 wt% (0.8Ru), 1.2 wt% (1.2Ru) and 1.6 wt% (1.6Ru) were prepared using the same procedures respectively.2.3 Catalyst characterization
The specific surface area, total pore volume and average pore size were measured by low-temperature N2 adsorption–desorption experiment on a Surface Area & Pore Size Analyzer (Nova 2200e, Quantachrome Instruments, USA) at −196 °C. Before the analysis, the samples were degassed at 300 °C for 4 h. Elemental analysis was carried out by inductively coupled plasma-atomic emission spectrometry (ICP-AES) using an Iris Advantage Thermo Jarrel Ash device. XRD patterns were measured on a Bruker D8 Advance diffractometer equipped with a Si (Li) solid-state detector (SOL-X) and a sealed tube providing Cu Kα radiation, in a 2θ angle range from 10° to 90° with a scanning rate of 5° min−1. Transmission electron microscopy (TEM) analysis was carried out using a JEOL JEM2010 microscope under an accelerating voltage of 200 kV. XPS was recorded using a Kratos Axis Ultra DLD spectrometer employing a monochromated Al Kα X-ray source (hν = 1486.6 eV), hybrid (magnetic/electrostatic) optics, a multi-channel plate and a delayline detector (DLD) to examine the electronic properties of Pd and Ru on the catalysts surface. All the binding energies were referenced to the C 1s peak at 284.8 eV. Temperature programmed reduction of hydrogen (H2-TPR) and temperature programmed desorption of hydrogen (H2-TPD) were performed with an AutoChem BET TPR/TPD (Quantachrome Instruments, USA) connected to a thermal conductivity detector (TCD) to investigate the reducibility and hydrogen desorption property of the catalysts. The classic H2-TPR was as follows: a sample of 100 mg was heated from room temperature to 600 °C at a heating rate of 10 °C min−1 under a flow of 10% H2/Ar. The representative H2-TPD was conducted as follows: prior to the absorption, the catalyst was reduced in 10% H2/Ar at 450 °C for 60 min, then cooled down in pure Ar. Absorbent of 10% H2/Ar was introduced into the system at 40 °C for 30 min. Afterwards, the system was purged with Ar for 30 min. Then temperature was ramped from 40 °C to 450 °C at a rate of 10 °C min−1 in Ar.The H2-TPR, H2-TPD investigations were performed with fresh catalysts and the N2 adsorption–desorption, ICP, XRD, TEM and XPS investigations were performed using the reduced catalysts.
2.4 Catalytic performance test
Prior to the reaction, the samples were reduced at 450 °C in 10% H2/Ar for 2 h. The hydrogenation experiments were performed in an autoclave at a H2 pressure of 0.3 MPa and 60 °C with a rotating speed of 1000 rpm. 120 g of 2-ethylanthraquinone was dissolved in 1 L of a mixed solvent composed of trioctyl phosphate and trimethylbenzene with a volume ratio of 1![[thin space (1/6-em)]](https://www.rsc.org/images/entities/char_2009.gif) :
:![[thin space (1/6-em)]](https://www.rsc.org/images/entities/char_2009.gif) 1 to obtain the working solution. Typically, 0.3 g catalysts and 60 mL of the working solution were put into the autoclave. After reacting for a certain time (5 min, 10 min, 15 min, 20 min, 25 min, 30 min, 35 min), 2 mL of the hydrogenation products were put into 15 mL deionized water and oxidized with O2 at room temperature. After that, a H2O2 aqueous solution was obtained. The content of H2O2 was analyzed by titration with KMnO4 solution. Prior to titration, 5 mL of a 3 mol L−1 sulfuric acid solution was added to the obtained H2O2 solution. The catalytic activity is expressed by the following equation:
1 to obtain the working solution. Typically, 0.3 g catalysts and 60 mL of the working solution were put into the autoclave. After reacting for a certain time (5 min, 10 min, 15 min, 20 min, 25 min, 30 min, 35 min), 2 mL of the hydrogenation products were put into 15 mL deionized water and oxidized with O2 at room temperature. After that, a H2O2 aqueous solution was obtained. The content of H2O2 was analyzed by titration with KMnO4 solution. Prior to titration, 5 mL of a 3 mol L−1 sulfuric acid solution was added to the obtained H2O2 solution. The catalytic activity is expressed by the following equation:
 | (1) |
The concentrations of the initial concentration of EAQ (n0(EAQ)), active quinones (EAQ and H4EAQ) in the working solution after a cycle process, which were denoted as nt(EAQ) and nt(H4EAQ) were analyzed with a high performance liquid chromatograph (HPLC) equipped with a C18 separation column and a UV detector. The mobile phase was a mixture of methanol and water with a volume ratio of 80![[thin space (1/6-em)]](https://www.rsc.org/images/entities/char_2009.gif) :
:![[thin space (1/6-em)]](https://www.rsc.org/images/entities/char_2009.gif) 20 and the wavelength of the ultraviolet radiation was set at 254 nm. The selectivity of active quinones can be calculated by the equation:
20 and the wavelength of the ultraviolet radiation was set at 254 nm. The selectivity of active quinones can be calculated by the equation:
 | (2) |
3 Results
3.1 Structural and morphological properties
Table 1 shows the basic characteristics of the catalysts. The γ-Al2O3 support exhibits a mesoporous structure with SBET = 167.6 m2 g−1, Vp = 0.54 cm3 g−1, Dp = 12.8 nm. The surface area and pore size of the support change only slightly after loading with the metallic components, indicating that the γ-Al2O3 is an excellent support for the PdRu catalyst. The decrease of the surface area and pore size compared to γ-Al2O3 is attributed to pore blockage caused by the metallic components during catalyst preparation.42| Sample | Pda (wt%) | Rua (wt%) | SBETb (m2 g−1) | Vpb (cm3 g−1) | Dpb (nm) |
|---|---|---|---|---|---|
| a As determined by ICP.b BET surface area, total pore volume (Vp) and average pore diameter (Dp) were measured from the N2 adsorption–desorption isotherms. | |||||
| Al2O3 | — | — | 167.6 | 0.54 | 12.8 |
| 0.6Pd | 0.51 | — | 164.9 | 0.51 | 12.2 |
| 0.6Pd0.4Ru | 0.52 | 0.38 | 162.7 | 0.50 | 12.2 |
| 0.6Pd0.8Ru | 0.50 | 0.63 | 161.0 | 0.47 | 12.0 |
| 0.6Pd1.2Ru | 0.50 | 0.99 | 158.5 | 0.47 | 12.0 |
| 0.6Pd1.6Ru | 0.49 | 1.25 | 155.3 | 0.46 | 11.9 |
| 1.6Ru | — | 1.29 | 157.9 | 0.47 | 11.9 |
Table 1 also shows the metal contents of the samples measured by ICP. The amounts of Pd and Ru in the catalysts measured by ICP are lower than the theoretical values, which may be due to the incomplete adsorption of Pd and Ru metal ions onto the Al2O3 support. These phenomena were always observed in the catalysts preparation process by impregnation method.4,42–44
3.2 TEM
The TEM analysis was performed to investigate the morphological features. For each sample, particles in several images are selected randomly to obtain the size distributions. The typical TEM, particle size distribution histograms and HRTEM of mono-Pd, 0.6Pd1.2Ru, mono-Ru are shown in Fig. 1. The sphere-like particles can be seen obviously in each samples, which may be due to the minimization of surface energy, and not many particles can be found in a single image may be attributed to the low loading amount and high dispersion. As shown in Fig. 1, the average particle size of Pd derives from TEM analysis is about 4.13 nm. The average particle size of 1.6Ru is larger (6.21 nm) than that of 0.6Pd, which may be due to the fact that Ru was more mobile on the surface or across the pores of the support during the preparation process in the view of the metal–support interaction.40 For the PdRu bimetallic catalysts, the nanoparticles are also spherical type, very similar to the case of monometallic Pd and Ru samples. The average particle size of 0.6Pd1.2Ru samples (4.85 nm) is slightly larger than monometallic Pd but smaller than monometallic Ru, which can be ascertained by the statistics. These results may be explained by the consequence of geometric effect between Pd and Ru. The typical TEM, particle size distribution histograms of 0.6Pd0.4Ru, 0.6Pd0.8Ru and 0.6Pd1.6Ru are also shown in Fig. S1.† As we can see, the average particle size of 0.6Pd0.4Ru and 0.6Pd0.8Ru is 4.24 nm and 4.35 nm respectively. The 0.6Pd1.6Ru sample shows a large particle size (5.76 nm), indicating that an excessive Ru loading may cause the metallic particles to aggregate.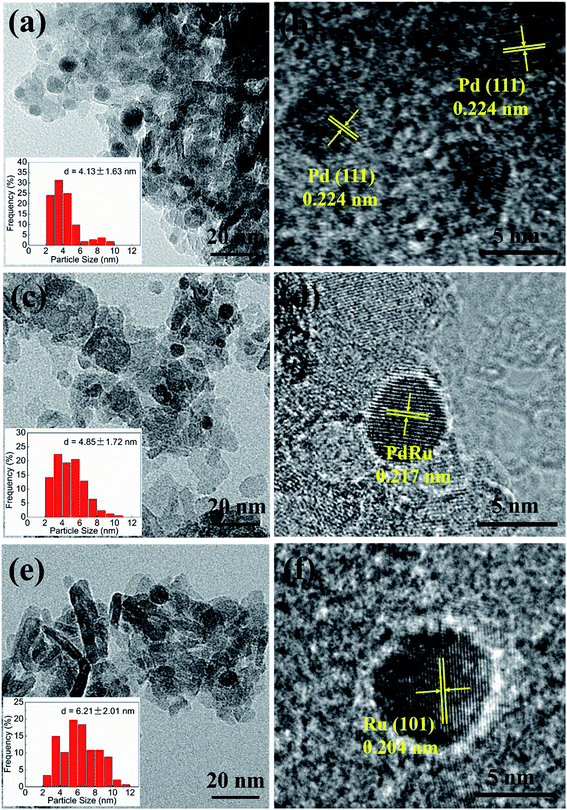 | ||
| Fig. 1 TEM and HRTEM images of the fresh reduced catalysts, (a) and (b) 0.6Pd, (c) and (d) 0.6Pd1.2Ru, (e) and (f) 1.6Ru. | ||
The HRTEM images are also shown in Fig. 1. The lattice fringe at 0.224 nm can be detected in mon-Pd, which can be attributed to the Pd (111), and mom-Ru shows a lattice fringe at 0.204 nm which can be ascribed to the Ru (101) plane. For 0.6Pd1.2Ru sample, the plane spacing of 0.217 nm can be detected, which doesn't accord with any lattice fringes of Pd and Ru, suggesting that the PdRu alloy may be formed in the bimetallic catalysts.44–46
Additionally, we have performed TEM-EDS to detect the distribution of Pd and Ru in PdRu bimetallic system. As can be seen in Fig. S2,† the relevant EDS spectrum recorded from the corresponding region includes signals corresponding to Pd and Ru.
In order to gain a better understanding of the microstructure of the PdRu particles, the samples were also observed using TEM-HAADF, line-scanning EDS and EDS mapping. As shown in Fig. S3,† the EDS line scanning analysis demonstrates that the Pd signals and Ru signals almost homogeneous distribution in the PdRu particle, and the relevant EDS mapping results also reveal the homogeneous distribution of Pd and Ru, which can further confirm the formation of PdRu alloy.44
In addition, the Pd particle with a plane spacing of 0.224 nm and Ru particle with a plane spacing of 0.204 nm are detected in the 0.6Pd1.2Ru sample (see Fig. S4†), demonstrating that a fraction of Pd or Ru don't form bimetallic particle. The similar phenomenon have also been observed by other researches, which may be due to the disadvantage of the co-impregnation method.40,45
3.3 XRD
The XRD patterns of the γ-Al2O3 and the catalysts after reduction treatment are shown in Fig. 2. Compared with pure γ-Al2O3, the XRD patterns of the mono-Pd, bimetallic PdRu and mono-Ru samples only change slightly, indicating that the mesoporous structure of γ-Al2O3 is well retained after supporting with metal components. Peaks locate at 2θ = 38.4°, 42.2°, 44.0°, 69.4°, 78.4°, 86.0° correspond to the (100), (002), (101), (110), (103), (201) planes of Ru metal (JCPDS Card no. 06-0663). As shown in Fig. 2, no any characteristic peaks of Pd are observed, which can be explained by the low loading amount or may be attributed to the overlapping with the broad and high-intensity peaks of γ-Al2O3 support.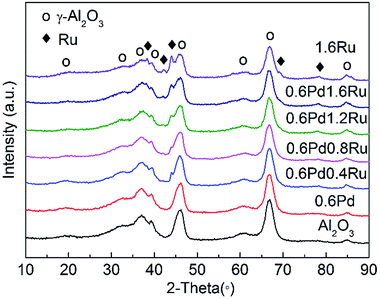 | ||
| Fig. 2 XRD patterns of the γ-Al2O3, 0.6Pd, 0.6Pd0.4Ru, 0.6Pd0.8Ru, 0.6Pd1.2Ru, 0.6Pd1.6Ru, and 1.6Ru samples. | ||
3.4 H2-TPR
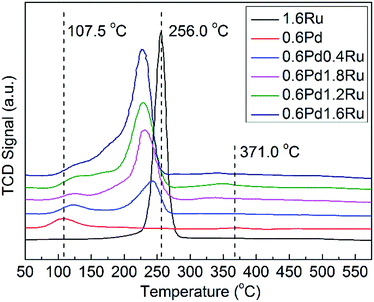
The reducibility of the unreduced samples and the possible interactions between Pd and Ru were investigated by H2-TPR. The H2-TPR spectra for the various catalysts are presented in Fig. 3. For mono-Pd sample, peaks observed at 107.5 °C should be ascribed to the reduction of surface PdO, and the H2 consumption peaks show at 371.0 °C may be attributed to the reduction of subsurface oxidized palladium species.35,47 The 1.6Ru catalyst exhibits a H2 consumption peaks at 256.0 °C, which may be due to the reduction of RuO2. For the PdRu samples, it is obvious that bimetallic cases cause significant change for the reduction behaviors. For all PdRu samples, the reduction peaks of PdO shift to a higher temperature. On the contrary, when compared with mono-Ru, the reduction peak of Ru in the PdRu samples shift to a lower temperature. In addition, it is worth noting that no obvious negative peak assigned to PdHx decomposition can be observed for any samples. As PdHx decreasing with the decrease of metal particle size, this result may be an evidence of the relatively small average particle size and high metal dispersion of the samples.48 These results can be attributed to the interaction between the Pd and Ru species.3.5 H2-TPD
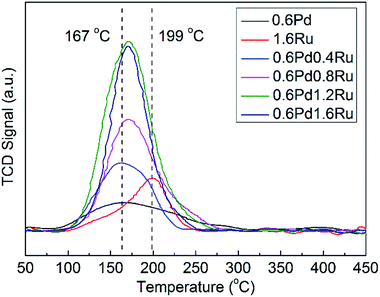
H2-TPD were performed to investigate the correlation between sites and hydrogenation performances of the catalysts from the view of hydrogen supply, and the H2-TPD results for all samples were given in Fig. 4. As can be observed in Fig. 4, the desorption peak at 167 °C can be attributed to the chemisorbed hydrogen for 0.6Pd, and H2 desorption peak is detected at 199 °C for 1.6Ru.The peak intensity of PdRu bimetallic samples is obviously stronger than that of monometallic Pd and Ru. According to the results shown in Table 2, the desorption amount of H2 of PdRu samples is even larger than the sum of 0.6Pd and 1.6Ru except for 0.6Pd0.4Ru, which may be due to the low Ru loading amount. In addition, the desorption amount of H2 of bimetallic samples are enhanced as the amount of Ru increased from 0.4% to 1.2% but decrease slightly for Ru contents of 1.6%, in accordance with the tendency of the catalytic performance. These results indicate that PdRu bimetallic systems show stronger hydrogen desorption behaviors, which may be attributed to the intense metal–metal and metal–support interactions.
| Sample | Total amounts (μmol gcatalyst−1) |
|---|---|
| 0.6Pd | 2.46 |
| 0.6Pd0.4Ru | 4.18 |
| 0.6Pd0.8Ru | 5.60 |
| 0.6Pd1.2Ru | 9.05 |
| 0.6Pd1.6Ru | 7.28 |
| 1.6Ru | 2.19 |
3.6 XPS
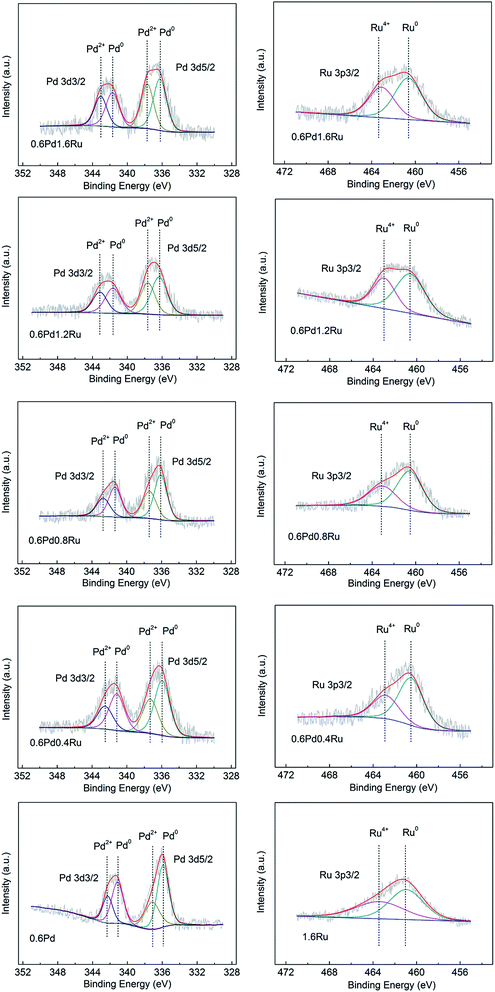
XPS investigations were carried out to get further insight into the interactions between Ru and Pd and the valence states of the surface metal species for those samples. The Pd 3d and Ru 3p3/2 spectra of the catalysts are shown in Fig. 5. The binding energies are referenced to the C 1s line at 284.8 eV.As shown in Fig. 5, a positive shift (0.1–0.8 eV) of the Pd 3d binding energy can be observed for the of PdRu bimetallic catalysts with respect to 0.6Pd, indicating that a change in the electronic properties of Pd atom modified upon alloying with Ru, which can be also identified by the binding energy shift of Ru. As the Ru 3d3/2 and Run+ 3d5/2 peaks overlaps with that of C 1s, the Ru 3p3/2 XPS signal are employed for all catalysts to research the chemical state of Ru.37,44 The peaks at 461.0 eV and 463.4 eV are assigned to the Ru 3p3/2 line of Ru0 and Ru4+ supported on γ-Al2O3.49 Compared with 1.6Ru, the Ru 3p3/2 binding energy of PdRu bimetallic catalysts presents a negative shift (0.3–0.6 eV) caused by the electronic interaction of Pd and Ru.
For further understanding of the XPS measurement, the valence states of surface Pd and Ru species are derived from the peak-fitting method, and the XPS-derived ratios of oxidized and reduced metal states with different samples are summarized in Tables 3 and 4. With respect to the mono-Pd sample, the proportion of Pd2+ species increase from 35.9% to 44.8% as the amount of Ru increased. Correspondingly, the proportion of Ru4+ decreased for the bimetallic catalysts compared with the Ru/γ-Al2O3. Similar changes in the electronic state of Pd and Ru in bimetallic PdRu samples had also been found by other researches earlier, implying the obvious interactions between Pd and Ru for the bimetallic catalysts.44,45
| Samples | Pd 3d5/2, eV | Pd 3d3/2, eV | Pd0% | Pd2+% | ||
|---|---|---|---|---|---|---|
| Pd0 | Pd2+ | Pd0 | Pd2+ | |||
| 0.6Pd | 335.9 | 337.1 | 341.1 | 342.3 | 64.1 | 35.9 |
| 0.6Pd0.4Ru | 336.0 | 337.2 | 341.2 | 342.4 | 61.2 | 38.8 |
| 0.6Pd0.8Ru | 336.1 | 337.4 | 341.4 | 342.6 | 60.4 | 39.6 |
| 0.6Pd1.2Ru | 336.3 | 337.6 | 341.6 | 343.1 | 56.8 | 43.2 |
| 0.6Pd1.6Ru | 336.3 | 337.7 | 341.7 | 343.1 | 55.2 | 44.8 |
| Samples | Ru 3p3/2, eV | Ru0% | Ru4+% | |
|---|---|---|---|---|
| Ru4+ | Ru0 | |||
| 0.6Pd0.4Ru | 462.8 | 460.5 | 65.8 | 34.2 |
| 0.6Pd0.8Ru | 463.0 | 460.5 | 63.5 | 36.5 |
| 0.6Pd1.2Ru | 463.0 | 460.6 | 61.9 | 38.1 |
| 0.6Pd1.6Ru | 463.1 | 460.7 | 58.8 | 41.2 |
| 1.6Ru | 463.4 | 461.0 | 54.9 | 45.1 |
3.7 Catalytic performance
The catalytic performance of all catalysts under the given reaction conditions are shown in Table 5. As we can see, 1.6Ru shows a low activity (0.8 g L−1) under our given reaction condition, while 0.6Pd exhibits a hydrogenation efficiency of 10.1 g L−1, corresponding to a H2O2 productivity of 1581.3 gH2O2 per gPd per h. Compared to mon-Pd catalyst and mon-Ru, it is evident that the PdRu bimetallic catalysts show a significant improvement in the catalytic performance. All of the bimetallic PdRu catalysts exhibit a higher catalytic activity than monometallic Pd catalyst, indicating the promotion effect of Ru addition to Pd. In particular, the hydrogenation efficiency increases from 10.1 g L−1 to 12.1 g L−1 for 0.6Pd1.2Ru.| Catalysts | B (g L−1) | Selectivity | Productivity (gH2O2 per gPd per h) |
|---|---|---|---|
| a Reaction conditions: catalysts: 0.3 g, H2 pressure: 0.3 MPa, temperature: 60 °C, reaction time: 15 min. | |||
| 0.6Pd | 10.1 | 99.5% | 1581.3 |
| 0.6Pd0.4Ru | 11.1 | 99.5% | 1707.7 |
| 0.6Pd0.8Ru | 11.6 | 99.6% | 1851.3 |
| 0.6Pd1.2Ru | 12.1 | 99.5% | 1942.2 |
| 0.6Pd1.6Ru | 11.8 | 99.4% | 1923.5 |
| 0.4Ru | 0 | 99.9% | — |
| 0.8Ru | 0.3 | 99.6% | — |
| 1.2Ru | 0.4 | 99.5% | — |
| 1.6Ru | 0.8 | 99.4% | — |
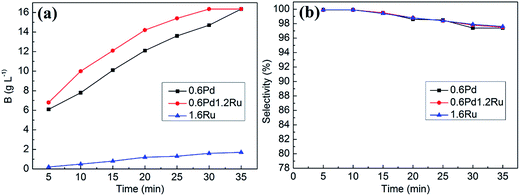
The effect of hydrogenation time for 0.6Pd, 0.6Pd1.2Ru and 1.6Ru are shown in Fig. 6. As the reaction time proceed, the hydrogenation efficiency for all samples increased. Obviously, the activity of bimetallic catalyst is higher than mon-Pd in the whole process. However, the hydrogenation activity on 1.6Ru is relatively low under the given reaction time. Respect to the selectivity, all catalysts exhibit high initial selectivity at a relatively low 2-EAQ conversion. With the reaction time going on, the decrease of 2-EAQ selectivity for all samples can be observed. It is worth noting that the 2-EAQ selectivity is well preserved for the bimetallic samples. Hence, the hydrogenation results demonstrate that addition of Ru to Pd can improve the catalyst's activity and maintain the high selectivity at the same time for 2-ethylanthraquinone hydrogenation.
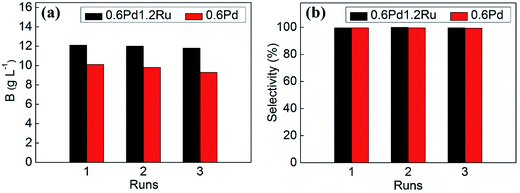
The stability and reusability of the catalysts is very important for the catalysts. Hence, recycling experiments were performed to investigate this point. The stability and reusability of 0.6Pd1.2Ru in contrast with 0.6Pd was investigated, and the recycling experiment results were shown in Fig. 7. It can be seen that the hydrogenation efficiency of 0.6Pd1.2Ru decreased slightly after three runs. However, for 0.6Pd, there is a relatively obvious decrease in catalytic activity in the recycling experiments. It should be noted that both 0.6Pd1.2Ru and 0.6Pd maintain the high selectivity during the recycling tests.
The changes in the average metal particle diameters of the used samples after three runs were also investigated by TEM and shown in Fig. S5.† The 0.6Pd catalyst shows an increase in the particle size after three runs (from 4.13 nm to 5.00 nm). In contrast, 0.6Pd1.2Ru catalyst almost keeps the same size after three catalytic runs (from 4.85 nm to 4.90 nm). Furthermore, the metal contents of the fresh and used (after three runs) catalysts was determined by ICP-AES and shown in Table S1.† The result shows that negligible leaching occurred during the catalytic experiments.
These results demonstrate that the PdRu/γ-Al2O3 doesn't show obvious deactivation during three catalytic runs, illustrating its good stability and reusability.
4 Discussion
Addition of Ru can significantly improve the performance of Pd catalysts for 2-ethylanthraquinone hydrogenation process. From the experimental results above, the superior catalytic performance of bimetallic PdRu samples may be caused by the synergistic effects between Pd and Ru, which can (i) enhance the hydrogen desorption behaviors, (ii) modulate the electronic state of metals and thus promote the activation of 2-ethylanthraquinone molecules.It is well known that the hydrogen supply plays an important role in the hydrogenation reaction. Due to the intense metal–metal and metal–support interactions, the desorption peak intensity of hydrogen of PdRu bimetallic samples is obviously stronger than that of monometallic Pd and Ru. That's to say, more hydrogen can be supplied to reacted with 2-ethylanthraquinone, leading to a superior hydrogenation performance. In addition, it should be noticed that the activity of 0.6Pd1.6Ru is lower than that of 0.6Pd1.2Ru. This may be due to the severe aggregation of the metal particles because of the excessive Ru loading, and too many Pd atoms are covered by the Ru which were unable to supply sufficient active sites, the similar results had also been reported earlier.50,51
With respect to the electronic factor, electropositive species can act as electrophilic sites for the adsorption and activation of C![[double bond, length as m-dash]](https://www.rsc.org/images/entities/char_e001.gif) O through the lone electron pair of the oxygen atoms, known as the “electrophilic C
O through the lone electron pair of the oxygen atoms, known as the “electrophilic C![[double bond, length as m-dash]](https://www.rsc.org/images/entities/char_e001.gif) O activation” mechanism, can favored the hydrogenation of C
O activation” mechanism, can favored the hydrogenation of C![[double bond, length as m-dash]](https://www.rsc.org/images/entities/char_e001.gif) O.52 For example, Richard et al. found that the appropriate Feδ+ deposited on Pt particles can act as an adsorption site for the C
O.52 For example, Richard et al. found that the appropriate Feδ+ deposited on Pt particles can act as an adsorption site for the C![[double bond, length as m-dash]](https://www.rsc.org/images/entities/char_e001.gif) O group of the cinnamaldehyde and then improve the activity and selectivity of platinum for the liquid-phase hydrogenation of cinnamaldehyde into cinnamyl alcohol.50 Hirschl et al. reported that an electropositive iron could transfer charge to the oxygen atom thus activating the hydrogenation of carbonyl group.53 Koo-amornpattana et al. suggested that electropositive metal (Li+, Na+ and K+) can enhance the activation of C
O group of the cinnamaldehyde and then improve the activity and selectivity of platinum for the liquid-phase hydrogenation of cinnamaldehyde into cinnamyl alcohol.50 Hirschl et al. reported that an electropositive iron could transfer charge to the oxygen atom thus activating the hydrogenation of carbonyl group.53 Koo-amornpattana et al. suggested that electropositive metal (Li+, Na+ and K+) can enhance the activation of C![[double bond, length as m-dash]](https://www.rsc.org/images/entities/char_e001.gif) O.54
O.54
Many researches have also observed that electropositive Pd or Ru could act as electrophilic sites for the adsorption and activation of the C![[double bond, length as m-dash]](https://www.rsc.org/images/entities/char_e001.gif) O through the lone electron pair of oxygen atoms and favored the hydrogenation of C
O through the lone electron pair of oxygen atoms and favored the hydrogenation of C![[double bond, length as m-dash]](https://www.rsc.org/images/entities/char_e001.gif) O. For example, Mironenko et al. reported that the enhanced catalytic performance of Pd–Ru/C catalysts in hydrogenation of benzaldehyde may be due to facilitation of electrophilic activation of the C
O. For example, Mironenko et al. reported that the enhanced catalytic performance of Pd–Ru/C catalysts in hydrogenation of benzaldehyde may be due to facilitation of electrophilic activation of the C![[double bond, length as m-dash]](https://www.rsc.org/images/entities/char_e001.gif) O owing to an increased fraction of the electron-deficient Pd species.45 Mistri et al. observed that addition Ru to Pd/CeO2 can enhance its activity and selectivity for hydrogenation of p-chloronitrobenzene due to the remarkable Ru4+ promotion effect.55 Teddy et al. found that the electropositive Ru atoms in the PtRu/CNT catalyst acts as electrophilic site for the adsorption and activation of the C
O owing to an increased fraction of the electron-deficient Pd species.45 Mistri et al. observed that addition Ru to Pd/CeO2 can enhance its activity and selectivity for hydrogenation of p-chloronitrobenzene due to the remarkable Ru4+ promotion effect.55 Teddy et al. found that the electropositive Ru atoms in the PtRu/CNT catalyst acts as electrophilic site for the adsorption and activation of the C![[double bond, length as m-dash]](https://www.rsc.org/images/entities/char_e001.gif) O bond via the lone electron pair of the oxygen atoms, and permits to increase the selectivity of cinnamaldehyde hydrogenation towards cinnamyl alcohol.56
O bond via the lone electron pair of the oxygen atoms, and permits to increase the selectivity of cinnamaldehyde hydrogenation towards cinnamyl alcohol.56
Here our study suggests that the promoting role of Ru may be explained via the “electrophilic C![[double bond, length as m-dash]](https://www.rsc.org/images/entities/char_e001.gif) O activation”. As evidenced by XPS analysis, the electronic interaction between Pd and Ru causes an increased fraction of electron-deficient Pd species in the bimetallic samples. On the other hand, Ru4+ exists in each samples, and the amount of Ru4+ increases as the increasing of the loading amount of Ru. The interpretation of the promoting effects may be suggested as follow. The dissociative adsorption of the hydrogen molecule in the surface of metallic Pd and Ru can make easy supply of hydride ion. Pd2+ and Ru4+ can act as the electrophilic sites for the adsorption and activation of the C
O activation”. As evidenced by XPS analysis, the electronic interaction between Pd and Ru causes an increased fraction of electron-deficient Pd species in the bimetallic samples. On the other hand, Ru4+ exists in each samples, and the amount of Ru4+ increases as the increasing of the loading amount of Ru. The interpretation of the promoting effects may be suggested as follow. The dissociative adsorption of the hydrogen molecule in the surface of metallic Pd and Ru can make easy supply of hydride ion. Pd2+ and Ru4+ can act as the electrophilic sites for the adsorption and activation of the C![[double bond, length as m-dash]](https://www.rsc.org/images/entities/char_e001.gif) O through the lone electron pair of the oxygen atoms, which may be conducive to the hydrogenation of C
O through the lone electron pair of the oxygen atoms, which may be conducive to the hydrogenation of C![[double bond, length as m-dash]](https://www.rsc.org/images/entities/char_e001.gif) O and enhance the performance of PdRu catalysts (see Fig. 8). This interpretation is also confirmed by the catalytic performance described above.
O and enhance the performance of PdRu catalysts (see Fig. 8). This interpretation is also confirmed by the catalytic performance described above.
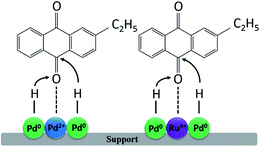 | ||
| Fig. 8 The proposed mechanism of promoting effect of a second metal in bimetallic PdRu/γ-Al2O3 samples and the preferential modes of 2-ethylanthraquinone activation on their surface. | ||
5 Conclusion
In this work, PdRu bimetallic catalysts supported on gamma alumina were prepared by a facile incipient wetness impregnation method for the 2-ethylanthraquinone hydrogenation. It is found that the addition of Ru to Pd can improve the catalyst's activity and maintain the high selectivity at the same time. The excellent catalytic performance of the bimetallic catalysts in this reaction system can be attributed to the synergistic effects between Pd and Ru.(i) Due to the intense metal–metal and metal–support interactions, more hydrogen can be adsorbed and dissociated on PdRu bimetallic system in contrast to the monometallic cases, as evidenced by H2-TPD results, which may favor the hydrogenation effect of the PdRu catalysts.
(ii) The XPS results also indicate the intensified electronic interactions between the two metals. The higher fraction of Pd2+ and the presence of Ru4+ in the PdRu system may act as the electrophilic sites for the adsorption and activation of the C![[double bond, length as m-dash]](https://www.rsc.org/images/entities/char_e001.gif) O of the 2-ethylanthraquinone molecule through the lone electron pair of the oxygen atoms, which may be conducive to the hydrogenation of C
O of the 2-ethylanthraquinone molecule through the lone electron pair of the oxygen atoms, which may be conducive to the hydrogenation of C![[double bond, length as m-dash]](https://www.rsc.org/images/entities/char_e001.gif) O and enhance the performance of PdRu catalysts.
O and enhance the performance of PdRu catalysts.
Acknowledgements
This work was supported by the National Natural Science Foundation of China (21276179, 21576205) and the Program for Changjiang Scholars, Innovative Research Team in University (IRT_15R46).References
- J. M. Campos-Martin, G. Blanco-Brieva and J. L. G. Fierro, Angew. Chem., Int. Ed., 2006, 45, 6962–6984 CrossRef CAS PubMed.
- H. Yao, C. Shen, Y. Wang and G. Luo, RSC Adv., 2016, 6, 23942–23948 RSC.
- G. Blanco-Brieva, M. Montiel-Argaiz, F. Desmedt, P. Miquel, J. M. Campos-Martin and J. L. G. Fierro, RSC Adv., 2016, 6, 99291–99296 RSC.
- Y. Han, Z. He, S. Wang, W. Li and J. Zhang, Catal. Sci. Technol., 2015, 5, 2630–2639 CAS.
- J. Tan, J. Zhang, Y. Lu, J. Xu and G. Luo, AIChE J., 2012, 58, 1326–1335 CrossRef CAS.
- S. Melada, R. Rioda, F. Menegazzo, F. Pinna and G. Strukul, J. Catal., 2006, 239, 422–430 CrossRef CAS.
- J. García-Serna, T. Moreno, P. Biasi, M. J. Cocero, J. P. Mikkola and T. P. Salmi, Green Chem., 2014, 16, 2320 RSC.
- Y. Isaka, Y. Yamada, T. Suenobu, T. Nakagawa and S. Fukuzumi, RSC Adv., 2016, 6, 42041–42044 RSC.
- S. J. Freakley, Q. He, J. H. Harrhy, L. Lu, D. A. Crole, D. J. Morgan, E. N. Ntainjua, J. K. Edwards, A. F. Carley, A. Y. Borisevich, C. J. Kiely and G. J. Hutchings, Science, 2016, 351, 965–968 CrossRef CAS PubMed.
- R. Hong, J. Feng, Y. He and D. Li, Chem. Eng. Sci., 2015, 135, 274–284 CrossRef CAS.
- Y. Li, J. Feng, Y. He, D. G. Evans and D. Li, Ind. Eng. Chem. Res., 2012, 51, 11083–11090 CrossRef CAS.
- H. Shang, H. Zhou, Z. Zhu and W. Zhang, J. Ind. Eng. Chem., 2012, 18, 1851–1857 CrossRef CAS.
- T. Kamachi, T. Ogata, E. Mori, K. Iura, N. Okuda, M. Nagata and K. Yoshizawa, J. Phys. Chem. C, 2015, 119, 8748–8754 CAS.
- P. Tang, Y. Chai, J. Feng, Y. Feng, Y. Li and D. Li, Appl. Catal., A, 2014, 469, 312–319 CrossRef CAS.
- X. Li, H. Su, G. Ren and S. Wang, RSC Adv., 2015, 5, 100968–100977 RSC.
- H. Chen, D. Huang, X. Su, J. Huang, X. Jing, M. Du, D. Sun, L. Jia and Q. Li, Chem. Eng. J., 2015, 262, 356–363 CrossRef CAS.
- A. Drelinkiewicz and A. Waksmundzka-Góra, J. Mol. Catal. A: Chem., 2006, 246, 167–175 CrossRef CAS.
- D. M. Alonso, S. G. Wettstein and J. A. Dumesic, Chem. Soc. Rev., 2012, 41, 8075–8098 RSC.
- X. Yang, D. Chen, S. Liao, H. Song, Y. Li, Z. Fu and Y. Su, J. Catal., 2012, 291, 36–43 CrossRef CAS.
- F. Menegazzo, M. Signoretto, M. Manzoli, F. Boccuzzi, G. Cruciani, F. Pinna and G. Strukul, J. Catal., 2009, 268, 122–130 CrossRef CAS.
- L. Ouyang, G. Da, P. Tian, T. Chen, G. Liang, J. Xu and Y. Han, J. Catal., 2014, 311, 129–136 CrossRef CAS.
- P. Kittisakmontree, B. Pongthawornsakun, H. Yoshida, S. Fujita, M. Arai and J. Panpranot, J. Catal., 2013, 297, 155–164 CrossRef CAS.
- Q. Zhang, J. Li, X. Liu and Q. Zhu, Appl. Catal., A, 2000, 197, 221–228 CrossRef CAS.
- E. Kim, H. S. Jeong and B. M. Kim, Catal. Commun., 2014, 45, 25–29 CrossRef CAS.
- J. Xu, L. Ouyang, G. Da, Q. Song, X. Yang and Y. Han, J. Catal., 2012, 285, 74–82 CrossRef CAS.
- S. Chinayon, O. Mekasuwandumrong, P. Praserthdam and J. Panpranot, Catal. Commun., 2008, 9, 2297–2302 CrossRef CAS.
- X. Jiang, N. Koizumi, X. Guo and C. Song, Appl. Catal., B, 2015, 170–171, 173–185 CrossRef CAS.
- W. G. Menezes, L. Altmann, V. Zielasek, K. Thiel and M. Bäumer, J. Catal., 2013, 300, 125–135 CrossRef CAS.
- J. Zhao, X. Xu, X. Li and J. Wang, Catal. Commun., 2014, 43, 102–106 CrossRef CAS.
- A. Vicente, G. Lafaye, C. Especel, P. Marécot and C. T. Williams, J. Catal., 2011, 283, 133–142 CrossRef CAS.
- R. Hou, W. Yu, M. D. Porosoff, J. Chen and T. Wang, J. Catal., 2014, 316, 1–10 CrossRef CAS.
- G. Budroni, S. A. Kondrat, S. H. Taylor, D. J. Morgan, A. F. Carley, P. B. Williams and G. J. Hutchings, Catal. Sci. Technol., 2013, 3, 2746 CAS.
- R. Kosydar, A. Drelinkiewicz, E. Lalik and J. Gurgul, Appl. Catal., A, 2011, 402, 121–131 CrossRef CAS.
- T. Ding, Y. Qin and Z. Ma, Chin. J. Catal., 2002, 23, 227–230 CAS.
- Y. Han, Z. He, Y. Guan, W. Li and J. Zhang, Acta Phys.–Chim. Sin., 2015, 31, 729–737 CAS.
- E. N. Ntainjua, S. J. Freakley and G. J. Hutchings, Top. Catal., 2012, 55, 718–722 CrossRef CAS.
- W. Luo, M. Sankar, A. M. Beale, Q. He, C. J. Kiely, P. C. Bruijnincx and B. M. Weckhuysen, Nat. Commun., 2015, 6, 6540 CrossRef PubMed.
- C. Huang, X. Yang, H. Yang, P. Huang, H. Song and S. Liao, Appl. Surf. Sci., 2014, 315, 138–143 CrossRef CAS.
- J. Qiu, H. Zhang, X. Wang, H. Han, C. Liang and C. Li, React. Kinet. Catal. Lett., 2006, 88, 269–275 CrossRef CAS.
- J. Chen, X. Liu and F. Zhang, Chem. Eng. J., 2015, 259, 43–52 CrossRef CAS.
- K. M. K. Yu, P. Meric and S. C. Tsang, Catal. Today, 2006, 114, 428–433 CrossRef CAS.
- J. Gu, S. Wang, Z. He, Y. Han and J. Zhang, Catal. Sci. Technol., 2016, 6, 809–817 CAS.
- S. Wang, K. Gao, W. Li and J. Zhang, Appl. Catal., A, 2017, 531, 89–95 CrossRef CAS.
- M. Tang, S. Mao, M. Li, Z. Wei, F. Xu, H. Li and Y. Wang, ACS Catal., 2015, 5, 3100–3107 CrossRef CAS.
- R. M. Mironenko, O. B. Belskaya, T. I. Gulyaeva, M. V. Trenikhin, A. I. Nizovskii, A. V. Kalinkin, V. I. Bukhtiyarov, A. V. Lavrenov and V. A. Likholobov, Catal. Today, 2017, 279, 2–9 CrossRef CAS.
- A. Mitra, D. Jana and G. De, Ind. Eng. Chem. Res., 2013, 52, 15817–15823 CrossRef CAS.
- N. S. Babu, N. Lingaiah, J. V. Kumar and P. S. S. Prasad, Appl. Catal., A, 2009, 367, 70–76 CrossRef CAS.
- Y. Liu, Y. He, D. Zhou, J. Feng and D. Li, Catal. Sci. Technol., 2016, 6, 3027–3037 CAS.
- J. Okal and M. Zawadzki, Appl. Catal., B, 2009, 89, 22–32 CrossRef CAS.
- D. Richard, J. Ockelford, A. G. Fendler and P. Gallezot, Catal. Lett., 1989, 3, 53–58 CrossRef CAS.
- Y. Zhao, S. Zhao, Y. Geng, Y. Shen, H. Yue, J. Lv, S. Wang and X. Ma, Catal. Today, 2016, 276, 28–35 CrossRef CAS.
- P. Mäki-Arvela, J. Hájek, T. Salmi and D. Y. Murzin, Appl. Catal., A, 2005, 292, 1–49 CrossRef.
- R. Hirschl, F. Delbecq, P. Sautet and J. Hafner, J. Catal., 2003, 217, 354–366 CrossRef CAS.
- W. Koo-amornpattana and J. M. Winterbottom, Catal. Today, 2001, 66, 277–287 CrossRef CAS.
- R. Mistri, J. Llorca, B. C. Ray and A. Gayen, J. Mol. Catal. A: Chem., 2013, 376, 111–119 CrossRef CAS.
- J. Teddy, A. Falqui, A. Corrias, D. Carta, P. Lecante, I. Gerber and P. Serp, J. Catal., 2011, 278, 59–70 CrossRef CAS.
Footnote |
| † Electronic supplementary information (ESI) available. See DOI: 10.1039/c6ra26142f |
| This journal is © The Royal Society of Chemistry 2017 |

