 Open Access Article
Creative Commons Attribution 3.0 Unported Licence
Catalytic synergy effect of MoS2/reduced graphene oxide hybrids for a highly efficient hydrogen evolution reaction†
Jung Eun Lee‡
a,
Jaemin Jung‡a,
Taeg Yeoung Koa,
Sujin Kimb,
Seong-Il Kimc,
Junghyo Nahd,
Sunmin Ryue,
Ki Tae Namf and
Min Hyung Lee *a
*a
aDepartment of Applied Chemistry, Kyung Hee University, Yongin, Gyeonggi 17104, Korea. E-mail: minhlee@khu.ac.kr
bDepartment of Chemistry, POSTECH, Pohang, Gyeongbuk 37673, Korea
cCenter for Materials Architecturing, Korea Institute of Science and Technology, Seoul 02792, Korea
dDepartment of Electrical Engineering, Chungnam National University, Daejeon 34134, Korea
eDepartment of Chemistry & Division of Advanced Materials Science, POSTECH, Pohang, Gyeongbuk 37673, Korea
fDepartment of Material Science and Engineering, Seoul National University, Seoul 08826, Korea
First published on 17th January 2017
Abstract
Two-dimensional layered transition metal dichalcogenide (TMD) materials such as MoS2 and WS2 have received a great deal of attention as alternatives to Pt in hydrogen evolution reaction (HER) catalysts. Recently, confined synthesis of TMD nanoparticles on graphene exhibited great catalytic performance for HER, due to the presence of many active edge sites. However, the correlation of gradual electronic transition states of TMD/graphene hybrids to catalytic behavior has been rarely studied. By means of controlling only the graphene oxide (GO) content added during the solvothermal synthesis with MoS2, we have synthesized hybrids of MoS2 and reduced graphene oxide (rGO) with tunable morphology; this tuning also brought about a gradual change in the electronic states of MoS2 due to strain induced by van der Waals interaction between heterolayers. The GO content tuning gradually enhanced the HER catalytic performance of the MoS2/rGO hybrids, decreasing the Tafel slope from 82 to 48 mV per decade owing to synergistic effects of an increase of catalytically active areas, an electronic transition of MoS2, and conductivity of rGO substrates.
1. Introduction
Hydrogen production using photoelectrochemical water splitting has received a great deal of attention as a sustainable and clean way to convert solar energy to hydrogen energy. The material requirements of photoelectrochemical cells (i.e., high visible absorption, slow recombination, and fast carrier transport, etc.) have some analogues to those of solar cells, but photoelectrochemical water splitting is more challenging due to further redox reaction steps using photogenerated carriers. Accordingly, kinetically effective transfer of carriers from semiconductors to electrolyte is a critical step to achieve high solar-to-hydrogen efficiency. To improve the reaction kinetics, the development of HER cocatalysts with low overpotential is a very important issue. Pt has been considered to be the most effective catalyst for the HER, but its large-scale application is limited due to its scarcity and high cost. Therefore, much effort has been devoted to developing cocatalysts made of earth-abundant materials with HER catalytic performance comparable to that of Pt. Moly-based catalysts such as MoP sheets1,2 and Mo2C nanoparticles3 have been demonstrated to be HER catalysts with good stability and performance. Mono transition metal dichalcogenides (TMD) sheets such as MoS2,4–8 MoSe2,7,9 and WS2 10,11 have been considered to be promising candidates to replace Pt. For MoS2, the most studied TMD catalyst, most research has focused on increasing the number of unsaturated sulfide edges, based on the understanding that these are the primary catalytically active sites.12 In contrast to this point of view, Voiry et al. reported that the conductivity of the basal plane is a critical factor in the catalytic performance of MoS2.13 Based on this idea, graphene has been used as MoS2 support to enhance charge transfer.14,15 Recently, several groups have demonstrated that the conversion of electronic structures of TMD from 2H to 1T drastically improve their HER catalytic performance.13,16 To understand the mechanism of the HER catalytic behavior of TMD, investigation of the correlation between catalytic performance and electronic structural changes will be very important. Very recently, Wang et al. demonstrated continuous tuning of the electronic structure of chemical vapour deposition (CVD)-grown vertically aligned MoS2 by using electrochemical lithiation approaches.16 However, synthetic approaches to gradually control the electronic states of MoS2 by using reduced graphene oxide (rGO) supports without lithium intercalation have been rarely studied, and the effect on catalytic performance of such tunability in MoS2/rGO hybrids has been rarely reported so far.In the present work, we developed facile routes to control the morphologies of MoS2/rGO hybrids, including continuous control over the electronic state of MoS2 laid directly flat on rGO, by changing the ratio of MoS2 and rGO during a solvothermal synthesis. MoS2/rGO hybrids synthesized by including an appropriate amount of rGO possessed many active sites because MoS2 was well dispersed on the rGO sheets; these materials achieved good conductivity of carriers, leading to low overpotential.
2. Experimental section
2.1 Synthesis of MoS2/rGO composites
Graphene oxide (GO) was synthesized from natural graphite flakes (Alfa Aesar, −325 mesh, 99.8% metal basis flakes) by using a modified Hummers method.17 Graphite flakes of 1 g and 0.5 g of sodium nitrate (NaNO3) were put into a 250 ml round-bottom flask and then kept in an ice bath while slowly adding 23 ml of sulfuric acid (H2SO4) with stirring. While maintaining mild agitation and keeping the reaction temperature below 20 °C, 3 g of potassium permanganate (KMnO4) was slowly added to the suspension. The ice bath was then removed and the suspension was heated in an oil bath to 35 °C; the suspension was maintained at this temperature for 1 h. As the reaction proceeded, the suspension gradually thickened and became paste-like. Then, 40 ml of DI water was added slowly with vigorous agitation while maintaining the oil bath condition. This reaction caused violent effervescence and increased the temperature of the suspension. When the temperature decreased to 40 °C, the suspension was diluted to 100 ml by addition of DI water and was then treated with 34.5% hydrogen peroxide until the suspension turned bright yellow. Next, the yellow suspension was vacuum-filtered, yielding a brown filter cake. The filter cake was washed with DI water and centrifuged at 4000 rpm for 10 min, and then was washed with 10% hydrochloric acid and centrifuged again at 4000 rpm for 10 min. Then, the material was rinsed four times by ultracentrifugation (30![[thin space (1/6-em)]](https://www.rsc.org/images/entities/char_2009.gif) 000 rpm for 10 min) followed by resuspension in DI water. Then, the suspension was dialyzed by using a dialysis membrane (Spectra/Por) for 1 week, during which time the suspension reached approximately pH 7. Finally, the suspension was transferred to a plastic dish and dried in a convection oven at 60 °C for 12 h, yielding a free-standing GO film.
000 rpm for 10 min) followed by resuspension in DI water. Then, the suspension was dialyzed by using a dialysis membrane (Spectra/Por) for 1 week, during which time the suspension reached approximately pH 7. Finally, the suspension was transferred to a plastic dish and dried in a convection oven at 60 °C for 12 h, yielding a free-standing GO film.
To synthesize MoS2/rGO hybrids, 22 mg of (NH4)2MoS4 was added to various solutions of GO in DMF (2.5, 3.3, 5, and 10 mg of GO in 10 ml of DMF) and stirred at room temperature until the solutions were homogenous. Next, each solution was well dispersed by using an ultrasonic bath for 20 min, and was then transferred to a 40 ml Teflon-lined autoclave and kept in a convection oven at 200 °C for 10 h. The product was then centrifuged at 8000 rpm and washed with DI water. Next, the solution was rinsed 5 times to completely remove DMF and organic residues. The final product was redispersed in 5 ml DI water. Pristine MoS2 was prepared by using the same procedure but without the addition of GO.
2.2 Electrochemical measurements
Homogeneous catalyst solutions of MoS2/rGO hybrids and of pristine MoS2 were prepared by mixing 4 mg of catalyst with 80 μl of 5 wt% Nafion solution, and then adding 0.2 ml of EtOH and 0.8 ml H2O and ultrasonicating the resulting mixture for 20 min. Then, 10 μl portions of catalyst solution were deposited on glassy carbon working electrodes 3 mm in diameter and Pt working electrodes 2 mm in diameter with a PTFE body. All electrodes were dried at room temperature. Polarization curves were measured by using a three-electrode setup (using Pt mesh as a counter electrode, saturated calomel electrode (SCE) as a reference electrode, and the catalyst as a working electrode) in N2-bubbled 0.5 M H2SO4 using a scan rate of 10 mV s−1. The potential in 0.5 M H2SO4 was converted from SCE to RHE by using the equation E(RHE) = E(SCE) + 0.273 V. All electrochemical data reported herein are given in terms of potential versus RHE. iR-drop by solution resistance and parasitic resistance is corrected by the following equation: EiR-corrected = ERHE − iRΩ, where iRΩ is iR-drop and ERHE is the potential vs. reversible hydrogen electrode. The Tafel slopes of all MoS2/rGO samples are calculated by compensating the iR-drop. EIS measurements were performed using the same experimental setup, at the overpotential η = 180 mV (bias: −0.45 V vs. SCE from 100![[thin space (1/6-em)]](https://www.rsc.org/images/entities/char_2009.gif) 000 to 0.01 Hz with amplitude 0.01 V).
000 to 0.01 Hz with amplitude 0.01 V).
2.3 Material characterization
The synthesized materials were characterized by means of XPS (Thermo Electron K-Alpha), XRD (D8 Advance equipped with a Cu Kα source), high-resolution TEM (HRTEM; JEOL JEM-2100 F, 200 kV), field emission scanning electron microscopy (FESEM; LEO SUPRA 55). Raman spectra were measured by using a custom-built micro-Raman setup detailed elsewhere;18 briefly, an Ar ion laser operated at 514 nm with 1 mW output was focused to a diffraction-limited spot on the samples by using an objective lens (40×, numerical aperture 0.60). The Raman signal collected by the same lens was fed to a liquid nitrogen-cooled charge-coupled device detector (Princeton Instruments, SPEC-10) coupled with a spectrograph with a focal length of 30 cm (Princeton Instruments, SP-2300). The spectral resolution was determined to be 3 cm−1 and the spectral accuracy was better than 1 cm−1.183. Results and discussion
3.1 Synthesis and characterization of MoS2/rGO hybrids
The method used to control the morphology of MoS2 is summarized in Scheme 1. First, GO was synthesized by using a modified Hummer's method (see Experimental section).17 The GO solution thus prepared was rinsed with deionized (DI) water and dried to make GO sheets. The desired amount of GO sheets was weighed, and then dispersed into a solution of MoS2 precursors in dimethylformamide (DMF). Next, the solution of GO and MoS2 precursors was placed into a Teflon-lined autoclave and kept in a convection oven at 200 °C for 10 h. During this solvothermal process, MoS2 grew on the GO layers, and GO was simultaneously changed to reduced graphene oxide (rGO). Although MoS2 was grown on single layer rGO sheets, the final products look like intercalation of MoS2 between the rGO layers due to stacking of the rGO layers.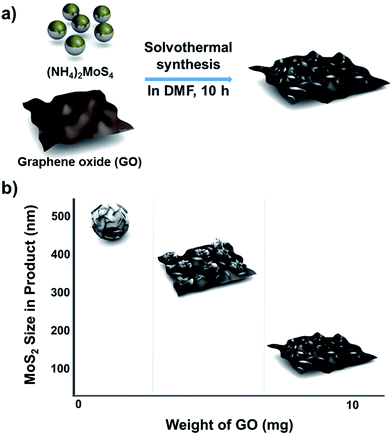 | ||
| Scheme 1 Schematic description of (a) the synthetic approach for MoS2/rGO hybrids and (b) morphology and size changes depending on the GO content in the precursor solution. | ||
Pure MoS2 samples and MoS2/rGO hybrids synthesized by means of the solvothermal process had different morphologies depending on the amount of GO included during the synthesis (Fig. 1). When MoS2 was synthesized without added GO, submicron-scale spherical particles consisting of highly packed corrugated MoS2 layers resulted (Fig. 1a). Pure MoS2 layers tend to stack onto each other by means of van der Waals interactions,12 and tend to minimize surface energy by agglomerating to form spherical shapes. Accordingly, fewer catalytically active edge sites were available in this material compared to isolated nanoparticulate MoS2.
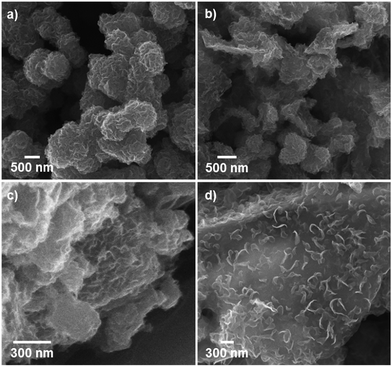 | ||
| Fig. 1 SEM images showing the different morphologies of (a) pristine MoS2 and (b–d) MoS2/rGO hybrids prepared using various GO contents: (b) MS-GO1, (c) MS-GO3, and (d) MS-GO4. | ||
When the solvothermal process was performed including MoS2 precursor solution (fixed at 22 mg) and various amounts of GO, MoS2/rGO hybrids were synthesized (Fig. 1b–d). The interactions between MoS2 precursor and rGO were clearly reflected in the changes in MoS2/rGO morphology observed as the amount of GO was increased. First, the amount of GO affected the amount of MoS2 sheets loaded on the GO, because GO oxygen functional groups such as carbonyls and other defect sites play an important role in nucleating MoS2 growth.15,19,20 Second, the stacked GO sheets interfere with the growth of MoS2 in the (002) direction through the layer confinement effect;15,19 thus, increasing the GO content decreases the number of stacked MoS2 layers. When the GO content was used as 2.5 mg (a composition denoted as MS-GO1), thick-layered MoS2/rGO composites were synthesized (Fig. 1b). Also, spherical MoS2 particles were observed that had smaller diameters (200–500 nm) than those formed in the pure MoS2 sample (Fig. 1a). That is to say, the low GO content in MS-GO1 provided relatively few nucleation sites, still allowing aggregation of MoS2 layers to occur, albeit to a lesser extent than in the reaction yielding pure MoS2. When the GO content was increased to 3.3 mg (denoted as MS-GO2), small spherical MoS2 particles were observed that lay flat on rGO layers, and much less MoS2 aggregation was observed compared to that in MS-GO1 (Fig. S1a†). However, both MS-GO1 and MS-GO2 had nanoparticulate rather than sheet morphology, and thus did not achieve the desired homogeneous distribution of MoS2 on rGO sheets. When the GO content was increased to 5 mg (denoted as MS-GO3), most rGO was well decorated with layered MoS2 and no spherical MoS2 particle was observed, indicating that the GO provided a sufficient number of nucleation sites to avoid aggregation (Fig. 1c). When the GO content of 10 mg was used (denoted as MS-GO4), well distributed MoS2 sheets were observed with lower loading density on the rGO compared to that observed for MS-GO3 (Fig. 1d). Importantly, the amount of GO needs to be balanced: the GO content should provide sufficient nucleation sites to avoid aggregation of MoS2, but should be low enough to maintain a high density of MoS2 in the resulting material. When the GO content was increased further while maintaining the MoS2 precursor content and the total synthetic volume, the greater GO content provided more nucleation sites, but lowered the density of MoS2 due to the excess of nucleation sites relative to the MoS2 content. This effect was clearly observed when the solvothermal synthesis was performed with excess amounts of GO (over 10 mg); for example, when the GO content was 20 mg, the loading density of MoS2 on the rGO sheets was drastically decreased (Fig. S1b†). This result indicates that the morphological changes of MoS2/rGO depend on the ratio of GO and MoS2 precursor amounts.14,21 In our study, the MoS2/rGO ratio is controlled by changing the amount of GO only, with a fixed amount of MoS2 precursor. Decreased aggregation and size of MoS2 can be achieved by increasing GO, but this is a trade-off with the low loading density of MoS2. Therefore, it is important to choose an appropriate amount of GO (10 mg of GO in our case) to obtain the optimum HER catalytic performance with a homogeneous distribution and appropriate loading density for MoS2. The reproducibility of the proposed morphology control and catalytic performance of each hybrid are confirmed in tens of experiments.
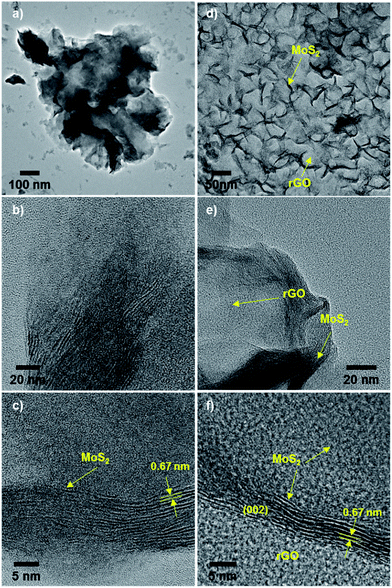
To verify the quality of MoS2 hybridized on rGO, transmission electron microscope (TEM) images of MoS2/rGO hybrids were acquired. TEM images of aggregated spheres of pristine MoS2 revealed the stacking of layers within these particles (tens of layers with approx. 0.67 nm interlayer distance; Fig. 2a–c). In a low-magnification TEM image of MoS2/rGO hybrids (MS-GO4), MoS2 was observed throughout the surface of crumpled rGO layers (Fig. 2d), which were formed by self-assembly of the flexible graphene layers during the solvothermal synthesis.21,22 MoS2 basal planes were clearly observed to sit parallel on the rGO (Fig. 2d–f). Unlike the structure of pristine MoS2, MoS2 sheets grown on rGO had fewer (around three to five) stacked MoS2 layers, with an interlayer distance of about 0.67 nm, as observed from a folded edge in the hybrid material (Fig. 2f). Energy-dispersive X-ray spectroscopy (EDS) mapping of selected areas of pure rGO and a MoS2/rGO hybrid confirmed that MoS2 was well hybridized on rGO (Fig. S2†) and verified that Mo and S were distributed uniformly over the rGO sheets. SAED patterns indicated that the MoS2 in the hybrids was polycrystalline (Fig. S3†); the MoS2 was indexed as a hexagonal phase randomly oriented on the rGO.19,23 Broad peaks in the X-ray diffraction (XRD) spectra of the hybrids confirmed the amorphous nature of MoS2 in the hybrids (Fig. S4†). The poor crystallinity of MoS2 was due to the incorporation of graphene, which interfered with the growth of MoS2 crystals.21
Raman spectroscopy was used to further investigate the structure changes of MoS2/rGO. Raman spectra of all MoS2/rGO samples showed three distinct peaks corresponding to the graphene bands of D (1351 cm−1), G (1587 cm−1), and 2D (2691 cm−1; Fig. 3a). It is worth notice that the G band of GO (1603 cm−1) was downshifted for bare rGO (1595 cm−1) due to the recovery of sp2 conjugation. The MoS2/rGO hybrids exhibited further downshift of G bands (1588 cm−1), which can be attributed to further reduction or addition of N atom possibly come from DMF or ammonium tetrathiomolybdate.24,25 The downshift of G modes also might be caused by strain on rGO faced with MoS2 by lattice mismatching (Fig. S5†).26 Basically, the D band corresponds to the A′1 vibration mode. In the case of perfect graphene, this mode cannot be observed by Raman scattering due to the perfect lattice symmetry. Thus, the D band responded to the vibrations of carbon atoms with in-plane terminations of disordered graphite dangling bonds. The G band, which is commonly found in graphite materials, responded to vibrations of carbon atoms in the opposite direction from each other with the adjacent atoms, and is due to the symmetry of E2g. Measuring the ratio of D and G bands intensity (ID/IG) is a useful indicator for estimating the quality of the graphite crystal structures. Crucially, in the case of rGO hybrid composites, ID/IG value can provide information on the unrepaired defects of rGO quantitatively. These defect sites on the rGO could play a critical role for the nucleation point during the synthesis of hybrid materials; therefore, we can estimate the amount of nucleation sites for MoS2 from the ID/IG value.27 In our study ID/IG was 1.140, 1.141, 1.191, and 1.220 for MS-GO1, MS-GO2, MS-GO3, and MS-GO4, respectively; this trend indicates that an increase in total defect sites (i.e., increase of nucleation sites for MoS2) results from increasing the GO amount. This shows why increasing the GO amounts inhibits the agglomerate of MoS2 gradually. Characteristic Raman peaks of MoS2 corresponding to the E12g in-plane vibrational mode at 376 cm−1 and the A1g out-of-plane vibrational modes at 403 cm−1 were observed for all MoS2/rGO hybrids (Fig. 3b). The A1g peaks of MS-GO3 and MS-GO4 were of lower frequency than those of MS-GO1 and MS-GO2, indicating that MS-GO3 and MS-GO4 had fewer MoS2 layers because increased GO-MoS2 interactions interfere the stacking of MoS2 attributed to van der Waals interaction between hetero interface of MoS2 and rGO.28,29
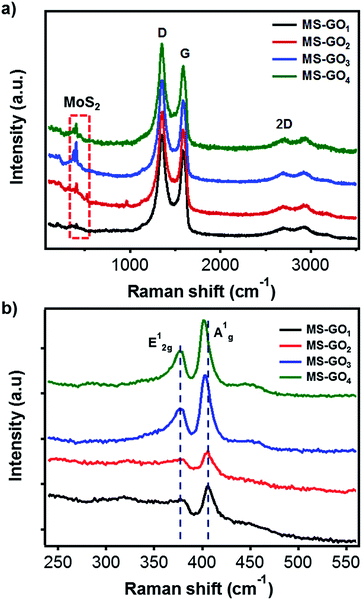 | ||
| Fig. 3 Raman spectra of MoS2/rGO hybrids prepared using various GO contents: (a) rGO and (b) MoS2 peak regions. | ||
X-ray photoelectron spectroscopy (XPS) data gave clues regarding the electronic states of MoS2/rGO hybrids (Fig. 4). C 1s peak analysis of MoS2/rGO hybrids showed a decrease in the intensity of the C–O peak (286 eV) relative to that of the GO precursor, indicating the successful reduction of GO during the solvothermal process (Fig. S6†).30,31 Five distinct peaks were observed in Mo 3d spectra of pristine MoS2 and of all MoS2/rGO hybrids (Fig. 4a): pristine MoS2 showed peaks of 3d5/2 (228.98 eV) and Mo 3d3/2 (232.08 eV), and these peaks gradually shifted to lower binding energy as the GO content was increased up to 10 mg (3d5/2 at 228.28 eV and 3d3/2 at 231.48); the binding energy was very close to reported value of 1T-MoS2. The peak shifts indicated that the electron transfer might take place in between MoS2 sheets and rGO, and this transfer is more favourable for hybrids with high rGO contents. The transfer gives positive effect for catalytic performance with improved electronic and ionic conductance.25 We carefully predict the electronic state changes by degree of van der Waals interaction depending on amount of rGO based on Raman and the XPS change. In addition to the Raman studies, the XPS peak shifts indicated that the GO content used during MoS2/rGO synthesis not only changed the morphology of the MoS2, but also induced a gradual change in the MoS2 electronic state due to van der Waals interaction between hetero 2D layers.13,29,32 The peak observed at 236.0 eV was a residual peak from the +6 oxidation state, arising from slight oxidation during the experiment.33 The small shoulder at 230 eV was evidence of a trace of conversion from Mo6+ to Mo5+.34–36 High-resolution XPS images of the S 2p doublet around 161 eV (S 2p3/2) and 162 eV (S 2p1/2) showed that the S 2p binding energies of MS-GO1 and MS-GO2 were similar to those of pristine MoS2 (161.58 and 162.68 eV), but these peaks were downshifted (161.28 and 162.18 eV) in MS-GO3 and MS-GO4. The shoulder around 164 eV indicated that bridged S22− or apical S2− were present; these are considered to be active HER species (Fig. 4b).15,34–36
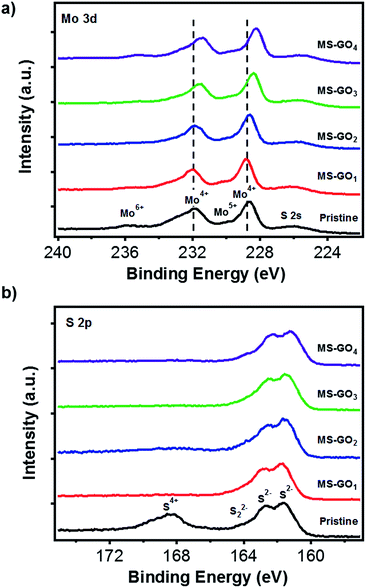 | ||
| Fig. 4 (a) Mo 3d and (b) S 2p XPS spectra of pristine MoS2 and of MoS2/rGO hybrids with various GO contents. | ||
3.2 Electrochemical properties of MoS2/rGO hybrids
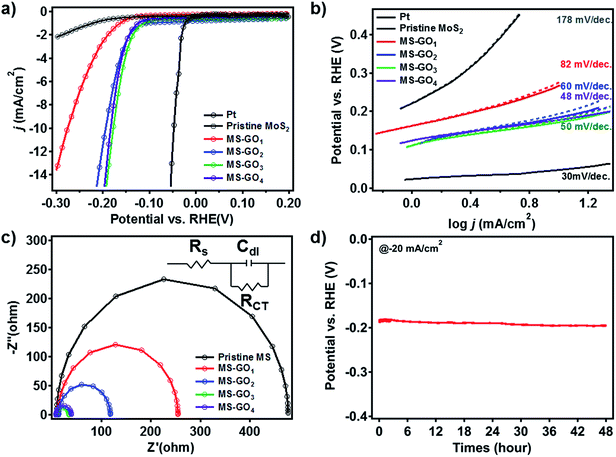
To test the electrocatalytic HER performance of MoS2/rGO hybrids, electrochemical analyses were carried out using MoS2/rGO coated on glassy carbon working electrodes. The polarization curves of pristine MoS2 exhibited the onset potential—defined here as the potential at j = −3 mA cm−2—of −0.347 V (Fig. 5a). Compared to the pristine MoS2, MS-GO1 had a large positive shift of the onset potential, to −0.207 V. The polarization curves of MS-GO2, MS-GO3, and MS-GO4 hybrids showed the onset potentials of −0.157, −0.147, and −0.152 V, respectively; the onset potential of MS-GO3 was shifted positively by about 200 mV compared to that of pristine MoS2. The measured current densities of MoS2/rGO hybrid electrodes at −200 mV were −24.6, −24.4, −16.1, and −3.0 mA cm−2 for MS-GO4, MS-GO3, MS-GO2, and MS-GO1 hybrids, respectively. Compared to MoS2/rGO hybrids, pure MoS2 exhibited the much lower current density of −0.8 mA cm−2.Tafel plots were prepared using the polarization curve data after correction of the potential by the ohmic potential drop (iR) losses induced by the resistance between the electrolytes and the electrode. Tafel slopes were calculated by using the Tafel equation (Fig. 5b).37 Pristine MoS2 showed the highest Tafel slope (178 mV dec.−1) among the samples studied; MS-GO1 had a much lower Tafel slope (82 mV dec.−1), and MS-GO2 had the Tafel slope of 60 mV per decade. The Tafel slope of MS-GO4 was the lowest (48 mV dec.−1) among all the MoS2/rGO hybrids studied. MS-GO3 had a similar Tafel slope (50 mV dec.−1) to that of MS-GO4, which was expected because of these materials' similar morphologies and electronic states. Pt, a well-known HER catalyst, was compared to estimate catalytic performance of MoS2/rGO hybrids, and it shows 18 mV per decade lower Tafel slope (30 mV dec.−1) than MS-GO4. The Tafel slopes of the MoS2/rGO hybrids could be used to estimate the kinetics of the HER on these materials based on the Heyrovsky reaction, which is the rate-determining step in the electrochemical desorption.14,38 Contrastingly, MoS2/rGO hybrids with excess GO content had worse onset potential and higher Tafel slope than those with lower GO content. For example, the onset potential of MoS2/rGO synthesized with 20 mg of GO was more negative than that synthesized with 10 mg of GO (MS-GO4), and the corresponding Tafel slope (53 mV dec.−1) was higher than that of both MS-GO3 and MS-GO4 (Fig. S7a and b†). These data show that the use of excessive GO decreases the MoS2 loading density (and thus the density of catalytically active sites) in the resulting hybrid (Fig. S1b†). This effect deteriorates the overall catalytic performance. That is to say, the GO content used can not only control the MoS2/rGO hybrids' morphology, but can also affect their catalytic performance in terms of conductivity and the number of active edge sites. All electrochemical characterizations are summarized in ESI Table S1.†
Electrochemical impedance spectroscopy (EIS) was conducted to compare the hybrids' electrical transport and electrode kinetics characteristics. Nyquist plots were prepared for each hybrid based on a Randles equivalent circuit model (Fig. 5c); all MoS2/rGO hybrids showed series resistances (RS) of about 10 Ω, suggesting good conductivity of the electrolytes. Importantly, charge transfer resistance (RCT) at the interfaces between the glassy carbon and the MS-GO hybrids and between MS-GO and electrolytes increased in the following order: MS-GO3 (25.59 Ω) < MS-GO4 (31.56 Ω) < MS-GO2 (104.6 Ω) < MS-GO1 (242.0 Ω). This observed trend supports the explanation that charge transfer is enhanced because of a transition of MoS2 crystals to a more conductive electronic phase (Fig. 5c). Also, the higher amount of rGO in good contact with MoS2 of high density can improve the conductivity of a MoS2/rGO hybrid, thereby enhancing the charge transfer. The low RCT observed for MS-GO3 and MS-GO4 is strong evidence of these hybrids' fast electrode kinetics (i.e., good catalytic performance). Furthermore, the double-layer capacitance (CDL) of the MS-GO hybrids was extracted based on the equivalent circuit model to provide information on the active surface area. MS-GO3 and MS-GO4 showed the highest CDL (3.9 and 4.2 mF) among the samples studied (Table S2†), indicating that these hybrids have a large active surface area of the electrode.39 The high CDL values of MS-GO3 and MS-GO4 originated from the density of the MoS2 sheet's distribution on the rGO, which depended on the relative contents of MoS2 and rGO. Therefore, to achieve both good charge transfer and high active surface area, precise control is required over the ratio of MoS2 to rGO content used during the synthesis of the hybrids.
To evaluate the stability of the MoS2/rGO hybrid as a HER catalyst, we performed durability test over 48 h by chronopotentiometry (Fig. 5d). Overpotential drift at the static current of −20 mA cm−2 was less than 10 mV after the test, showing good long-term stability of the catalyst toward HER. Besides, we carried out 1000 consecutive cycles of cyclic voltammetry for MS-GO4 under potential between 0 and −0.3 V versus a reversible hydrogen electrode (RHE); negligible current density change was observed during the test, suggesting superior long-term stability as a HER catalyst (Fig. S8†).
4. Conclusion
In conclusion, we have demonstrated the morphology-dependent HER catalytic performance of MoS2/rGO hybrids. The morphology of MoS2/rGO hybrids was well controlled by simply changing the content of rGO used during solvothermal synthesis, relative to the MoS2 content. When an appropriate amount of GO was used, the resulting MoS2/rGO hybrids had a high density of homogeneously distributed MoS2 sheets on the rGO, yielding many catalytically active edge sites; also, using the appropriate GO content yielded good contact between the MoS2 and rGO and caused the electronic states of MoS2 to transition to a more conductive phase, increasing the hybrids' conductivity. The synthetic approach discussed herein can be applied to other TMD/rGO hybrids as well as other layered materials.Acknowledgements
This research was supported by the Basic Science Research Program of the National Research Foundation of Korea, funded by the Ministry of Education, Science and Technology (NRF-2014R1A1A2058607 and NRF-2014M3A6A5060934). This work was also supported by the Korea Institute of Science and Technology (2E24572-14-097) and Samsung Electronics Co., Ltd.Notes and references
- W. Cui, Q. Liu, Z. Xing, A. M. Asiri, K. A. Alamry and X. Sun, Appl. Catal., B, 2015, 164, 144–150 CrossRef CAS.
- Z. Xing, Q. Liu, A. M. Asiri and X. Sun, Adv. Mater., 2014, 26, 5702–5707 CrossRef CAS PubMed.
- W. Cui, N. Cheng, Q. Liu, C. Ge, A. M. Asiri and X. Sun, ACS Catal., 2014, 4, 2658–2661 CrossRef CAS.
- B. Hinnemann, P. G. Moses, J. Bonde, K. P. Jørgensen, J. H. Nielsen, S. Horch, I. Chorkendorff and J. K. Nørskov, J. Am. Chem. Soc., 2005, 127, 5308–5309 CrossRef CAS PubMed.
- Z. Pu, Q. Liu, A. M. Asiri, Y. Luo, X. Sun and Y. He, Electrochim. Acta, 2015, 168, 133–138 CrossRef CAS.
- J. Xie, H. Zhang, S. Li, R. Wang, X. Sun, M. Zhou, J. Zhou, X. W. Lou and Y. Xie, Adv. Mater., 2013, 25, 5807–5813 CrossRef CAS PubMed.
- D. Kong, H. Wang, J. J. Cha, M. Pasta, K. J. Koski, J. Yao and Y. Cui, Nano Lett., 2013, 13, 1341–1347 CrossRef CAS PubMed.
- W. Li, X. Wang, D. Xiong and L. Liu, Int. J. Hydrogen Energy, 2016, 41, 9344–9354 CrossRef CAS.
- H. Tang, K. Dou, C.-C. Kaun, Q. Kuang and S. Yang, J. Mater. Chem. A, 2014, 2, 360–364 CAS.
- J. Yang, D. Voiry, S. J. Ahn, D. Kang, A. Y. Kim, M. Chhowalla and H. S. Shin, Angew. Chem., Int. Ed., 2013, 52, 13751–13754 CrossRef CAS PubMed.
- W. Li, D. Chen, F. Xia, J. Z. Y. Tan, J. Song, W.-G. Song and R. A. Caruso, Chem. Commun., 2016, 52, 4481–4484 RSC.
- T. F. Jaramillo, K. P. Jørgensen, J. Bonde, J. H. Nielsen, S. Horch and I. Chorkendorff, Science, 2007, 317, 100–102 CrossRef CAS PubMed.
- D. Voiry, M. Salehi, R. Silva, T. Fujita, M. Chen, T. Asefa, V. B. Shenoy, G. Eda and M. Chhowalla, Nano Lett., 2013, 13, 6222–6227 CrossRef CAS PubMed.
- Y. Li, H. Wang, L. Xie, Y. Liang, G. Hong and H. Dai, J. Am. Chem. Soc., 2011, 133, 7296–7299 CrossRef CAS PubMed.
- X. Zheng, J. Xu, K. Yan, H. Wang, Z. Wang and S. Yang, Chem. Mater., 2014, 26, 2344–2353 CrossRef CAS.
- H. Wang, Z. Lu, S. Xu, D. Kong, J. J. Cha, G. Zheng, P.-C. Hsu, K. Yan, D. Bradshaw, F. B. Prinz and Y. Cui, Proc. Natl. Acad. Sci. U. S. A., 2013, 110, 19701–19706 CrossRef CAS PubMed.
- W. S. Hummers and R. E. Offeman, J. Am. Chem. Soc., 1958, 80, 1339 CrossRef CAS.
- J. E. Lee, G. Ahn, J. Shim, Y. S. Lee and S. Ryu, Nat. Commun., 2012, 3, 1024 Search PubMed.
- S. Min and G. Lu, J. Phys. Chem. C, 2012, 116, 25415–25424 CAS.
- Z. H. Deng, L. Li, W. Ding, K. Xiong and Z. D. Wei, Chem. Commun., 2015, 51, 1893–1896 RSC.
- K. Chang and W. Chen, Chem. Commun., 2011, 47, 4252–4254 RSC.
- Y. Xu, K. Sheng, C. Li and G. Shi, ACS Nano, 2010, 4, 4324–4330 CrossRef CAS PubMed.
- E. G. S. Firmiano, M. A. L. Cordeiro, A. C. Rabelo, C. J. Dalmaschio, A. N. Pinheiro, E. C. Pereira and E. R. Leite, Chem. Commun., 2012, 48, 7687–7689 RSC.
- K. N. Kudin, B. Ozbas, H. C. Schniepp, R. K. Prud'homme, I. A. Aksay and R. Car, Nano Lett., 2008, 8, 36–41 CrossRef CAS PubMed.
- Y. Zhao, L. Kuai, Y. Liu, P. Wang, H. Arandiyan, S. Cao, J. Zhang, F. Li, Q. Wang, B. Geng and H. Sun, Sci. Rep., 2015, 5, 8722 CrossRef CAS PubMed.
- Z. Ni, Y. Wang, T. Yu and Z. Shen, Nano Res., 2008, 1, 273–291 CrossRef CAS.
- M. Li, J. E. Zhu, L. Zhang, X. Chen, H. Zhang, F. Zhang, S. Xu and D. G. Evans, Nanoscale, 2011, 3, 4240–4246 RSC.
- K.-G. Zhou, F. Withers, Y. Cao, S. Hu, G. Yu and C. Casiraghi, ACS Nano, 2014, 8, 9914–9924 CrossRef CAS PubMed.
- N. Lu, H. Guo, L. Wang, X. Wu and X. C. Zeng, Nanoscale, 2014, 6, 4566–4571 RSC.
- S. Stankovich, D. A. Dikin, R. D. Piner, K. A. Kohlhaas, A. Kleinhammes, Y. Jia, Y. Wu, S. T. Nguyen and R. S. Ruoff, Carbon, 2007, 45, 1558–1565 CrossRef CAS.
- H.-J. Shin, K. K. Kim, A. Benayad, S.-M. Yoon, H. K. Park, I.-S. Jung, M. H. Jin, H.-K. Jeong, J. M. Kim, J.-Y. Choi and Y. H. Lee, Adv. Funct. Mater., 2009, 19, 1987–1992 CrossRef CAS.
- G. Eda, H. Yamaguchi, D. Voiry, T. Fujita, M. Chen and M. Chhowalla, Nano Lett., 2011, 11, 5111–5116 CrossRef CAS PubMed.
- V. O. Koroteev, L. G. Bulusheva, I. P. Asanov, E. V. Shlyakhova, D. V. Vyalikh and A. V. Okotrub, J. Phys. Chem. C, 2011, 115, 21199–21204 CAS.
- Y.-H. Chang, C.-T. Lin, T.-Y. Chen, C.-L. Hsu, Y.-H. Lee, W. Zhang, K.-H. Wei and L.-J. Li, Adv. Mater., 2013, 25, 756–760 CrossRef CAS PubMed.
- H. Vrubel, D. Merki and X. Hu, Energy Environ. Sci., 2012, 5, 6136–6144 CAS.
- T. Weber, J. C. Muijsers, J. H. M. C. van Wolput, C. P. J. Verhagen and J. W. Niemantsverdriet, J. Phys. Chem., 1996, 100, 14144–14150 CrossRef CAS.
- A. J. Bard and L. R. Faulkner, Electrochemical methods: fundamentals and applications, Wiley, New York, USA, 1980 Search PubMed.
- B. E. Conway and B. V. Tilak, Electrochim. Acta, 2002, 47, 3571–3594 CrossRef CAS.
- I. Danaee and S. Noori, Int. J. Hydrogen Energy, 2011, 36, 12102–12111 CrossRef CAS.
Footnotes |
| † Electronic supplementary information (ESI) available: SEM images of hybrids synthesized with 3.3 and 20 mg GO contents; EDS mapping and SAED patterns, XRD, and C 1s XPS of MoS2/rGO hybrids; polarization curves and Tafel slope of MoS2/rGO; detailed electrochemical properties and EIS parameters of MoS2/rGO hybrids. See DOI: 10.1039/c6ra26149c |
| ‡ These authors contributed equally to this work. |
| This journal is © The Royal Society of Chemistry 2017 |

