 Open Access Article
Creative Commons Attribution 3.0 Unported Licence
Compatibility-tuned distribution of nanoparticles in co-continuous rubber structures toward microwave absorption enhancement
Lefan Liac,
Pengfei Zhao*a,
Yongyue Luoa,
Heping Yua,
Jinlong Taoa,
Dongning Hea,
Wei Gonga,
Dejun Lib,
Zhifen Wangc and
Zheng Peng*a
aChinese Agricultural Ministry Key Laboratory of Tropical Crop Product Processing, Agricultural Product Processing Research Institute, Chinese Academy of Tropical Agricultural Sciences, Zhanjiang 524001, PR China. E-mail: zpengcatas@126.com; pengfeizhao85ac@163.com
bRubber Research Institute, Chinese Academy of Tropical Agricultural Sciences, Danzhou 571731, PR China
cCollege of Materials and Chemical Engineering, Hainan University, Haikou, 570228, PR China
First published on 4th January 2017
Abstract
Development of novel and versatile approaches to engineer composites with light density, broad effective bandwidth and high microwave absorption (MA) capacity is of great importance. Here, co-continuous natural rubber/epoxidized natural rubber (NR/ENR) blends with a selective distribution of conductive carbon black nanoparticles (CCBs), have been fabricated by tow-roll mixing. ENR with abundant epoxide groups shows inferior wettability to CCB than NR, which is responsible for the preferential location of CCB in the NR/ENR blend. Increasing the epoxidation level of ENR promotes the preferential location of CCB and creates stronger dielectric loss, thus enhancing the MA properties of CCB/NR/ENR composites. When the epoxidation level increases to 40 mol%, the MA capacity of the composite has been significantly enhanced by 40%. Meanwhile, the qualified frequency bandwidth (RL < −10 dB) of composites with ENR is 85% broader than that of CCB/NR composites. Such a novel approach of compatibility-tuned nanoparticles distribution in co-continuous rubber blends will significantly promote the multi-functional use of rubber and carbonaceous resources.
Introduction
Microwave absorbing materials have captured rapidly increasing attention in the past decade, not only for the sake of solving the problem of serious microwave radiation emitting from telecommunication apparatus, but also for the stealth of military equipment.1–3 Conventional microwave absorbing materials, such as ferrites, and magnetic metals, have been extensively investigated and utilized.4,5 However, their applications are invariably limited by the shortcomings of high specific gravity, poor adaptability, and uneconomic processing. Therefore, an eligible microwave absorbing material, labelled with the characteristic features of lightweight, wide effective bandwidth, powerful absorption, and thin thickness, is becoming desirable and indispensable.6–8Combination the of low density, excellent processability and tunable physiochemical properties, elastomeric composites with dielectric or/and magnetic loss nanoparticles are spontaneously considered to be the alternative.9 It has been reported that nitrile butadiene rubber composites with thermally reduced graphene oxide exhibits excellent microwave absorption (MA) capacity (−57 dB) and broad effective bandwidth (4.5 GHz).10 Magnetic oxides, especially for the hybrid ones, are also attributed to the microwave attenuation.11 Undoubtedly, incorporating dielectric and magnetic loss absorbents together is preferred, and various composites with excellent MA capacity have been extensively developed.12,13 However, as the absorbents are randomly distributed in matrix, high content is usually required to form interconnected network for improving MA performance. It is widely accepted that high loading of absorbents may deteriorate the mechanical properties and processability of the composites due to severe agglomeration and poor filler-matrix bonding.
With the significant importance of microwave absorbing materials in military and civil fields, much effort has been devoted to improving the filling efficiency of nanoparticles, thus maximizing their unique attributes.14,15 Recently progress indicates that preferential distribution of nanofillers in co-continues blend structures may contribute to MA capacity due to their complementary behaviour, interfacial polarization and depletion effect.16 Moreover, such engineered blend structure and tailor-made distribution of nanoparticles are conduced to functional reproducibility and processability.17,18 Unfortunately, to the best of our knowledge, such strategy has been scarcely investigated in elastomeric blends.
Theoretically, preferential distribution of nanofillers in blend structures is essentially stemmed from their different wettability with matrix, and the dynamic kinetics and stability can be influenced by many parameters, such as shape and surface chemistry of nanoparticles, blend ratio and polarity of matrix.19 Therefore, understanding and controlling of the preferential distribution of nanofillers in elastomeric blends are the keys toward new microwave absorbing materials. In our previous work, we have designed conductive carbon black incorporated natural rubber/epoxidized natural rubber blend (CCB/NR/ENR) with a minimum reflection loss (RL) of −19.31 dB and −10 dB bandwidth of 2.96 GHz, which are superior to that of CCB filled NR or ENR alone. Moreover, the MA performance of the composites can be efficiently tuned via adjusting the NR/ENR ratio.20 Rationale behind the present work is to investigate whether compatibility of NR/ENR blends can be used as a tool to tune the distribution of CCB, potentially resulting in intact dielectric/magnetic loss network and higher MA capacity.
Experimental
Materials
Natural rubber (NR or ENR-0) was sourced from Guangken Rubber Co., Ltd. Epoxidized natural rubber with 25 mol% (ENR-25) and 40 mol% (ENR-40) epoxide groups were synthesized in our pilot-plant. CCB nanoparticles with electrical conductivity of 0.025 S cm−1 and surface area of 420 m2 g−1 were purchased from Ebory Chemical Co., Ltd (Tianjin, P. R. China). Vulcanizing additives including sulfur, zinc oxide, stearic acid, n-tert-butylbenzothiazole-2-sulphenamide (accelerant NS), and 2-mercaptobenzimidazole (antioxidant MB) were analytical grade and used as received without further purification.Preparation of composites
Three series of composites with formula listed in Table 1 were prepared by incorporating CCB in binary rubber blends using open-roll mill. First, rubber matrices were introduced into the open-roll mill and homogenized for 8 times. Subsequently, CCB nanoparticles were added and the mixture was masticated for 5 min. Then, the masterbatch was mixed with vulcanization recipe for another 5 min. Temperature was maintained below 60 °C during the milling process to avoid early cross-linking reaction. After stayed for 24 h, the compounds were vulcanized (15 MPa, 145 °C) into required shape at the optimum times (about 20 min) which was deduced from the disc rheometer curves (MDR 2000, Alpha, USA). For a comparative purpose, the obtained composites were designated as CCB/NR/ENR-0, CCB/NR/ENR-25, CCB/NR/ENR-40 according to the type of ENR used.| Sample | NR | ENR-25 | ENR-40 | CCB | Zinc oxide | Stearic acid | Accelerant NS | Antioxidant MB | Sulfur |
|---|---|---|---|---|---|---|---|---|---|
| a Parts per hundred parts of rubber. | |||||||||
| CCB/NR/ENR-0 | 100 | 0 | 0 | Variable | 5 | 2 | 0.7 | 2 | 2.2 |
| CCB/NR/ENR-25 | 50 | 50 | 0 | Variable | 5 | 2 | 0.7 | 2 | 2.2 |
| CCB/NR/ENR-40 | 50 | 0 | 50 | Variable | 5 | 2 | 0.7 | 2 | 2.2 |
Characterization
Dynamic-mechanical thermal analysis (DMA) of rectangular specimens (20 × 4 × 2 mm3) in tensile mode at a frequency of 5 Hz was taken on a Dynamic Mechanical Analyser (DMA242C, Netzsch, Germany). Morphologies of CCB in the composites were studied by scanning electron microscope (SEM) (S-4800, Hitachi, Japan), operating at an accelerating voltage of 1 kV. Prior to visualization, the samples were cryogenically fractured in liquid nitrogen, mounted on aluminium studs and sputter coated with platinum. Transmission electron microscopy (TEM) was carried on a JEM-2100F (JEOL, Tokyo, Japan) at 100 kV. Before the observation, the samples with a thickness of 80–100 nm were prepared by a microtome (EMUC6, Leica, Germany). Volume electrical resistance, Rv (Ω), of the composites was measured by using a ZC-68 high resistance meter for Rv > 104 Ω and a RTS-9 four-probe digital multi-meter for Rv < 106 Ω. Both sides of the samples were coated with silver paste in order to eliminate the effect of contact resistance. The conductivity, σ (S m−1), was calculated according to the equation σ = l/(wtRv), where w, l, and t (m) are the width, long and thickness of sample. Microwave scattering parameters of the composites were conducted at room temperature in the frequency range of 2–18 GHz by using N5244A vector network analyzer (Agilent, USA). The samples were compressed into cylindrical toroidal shape with 3.04 mm of inner diameter, 7.00 mm of outer diameter and 4 mm of thickness. Generally, the efficiency of reflection loss is expressed in decibels (dB), and the lower decibel level of RL indicates more energy that is absorbed by material. According to the transmission line theory, the reflection loss (RL) of a layer material can be defined as:
 | (1) |
 | (2) |
Results and discussion
Theoretical prediction
Compared with single-polymer composites, the combination of multi-component polymer blends with functional fillers affords a higher capability for the development of composites with superior performance as well as extremely low filler percolation thresholds. Different concepts, such as melt viscosity effects and system's tendency to minimize its free energy, are described in the literature to explain the localization of solid nanofillers in polymer blends.21 A widely accepted possibility to express this generally valid principle is the wetting coefficient ωa that is derived from Young's equation:
 | (3) |
Despite the importance of the topic, it is not possible to reliably predict the localization behaviour of nanofillers in a melt mixed multiphase elastomeric blends, even if in many cases the prediction of the wetting coefficient was reported to agree with experimental findings.21,22 Prevalently, a tendency has been observed in the available literature: engineered blend structure with tailor-made distribution of nanoparticles appears to be in favour of excellent microwave absorption.23 Therefore, modification of elastomer chain or/and nanoparticles surface are frequently adopted to control the selective distribution of nanoparticles within the thermodynamically favoured phase after typical mixing processes.
Compatibility between the two blend phases so far never been considered as a significant parameter for tuning the filler distribution within the blend morphology. Based on a purely theoretical analysis, a strong compatibility dependence has been concluded for the distribution behaviour of nanoparticles. The derived dependency affects both the thermodynamically most stable localization in blend and dielectric/magnetic loss of MA layer.17,24,25 Hereto, the validity of the proposed correlations is evaluated based on our previous studies, in which it has been confirmed that CCB nanoparticles are preferentially located distributed in NR phase.20 As the DMA results shown in Fig. 1, the compatibility of NR and ENR-25 is better than that of NR and ENR-40, evidenced by smaller gap between the tow characteristic tan![[thin space (1/6-em)]](https://www.rsc.org/images/entities/char_2009.gif) δ peaks. When ENR was compounded with NR to enhance the comprehensive properties, the addition of 30 phr CCB does not cause a remarkable variation of tan
δ peaks. When ENR was compounded with NR to enhance the comprehensive properties, the addition of 30 phr CCB does not cause a remarkable variation of tan![[thin space (1/6-em)]](https://www.rsc.org/images/entities/char_2009.gif) δ for ENR, but a dramatic reduction for NR, indicating that more CCB nanoparticles are distributed in NR phase.
δ for ENR, but a dramatic reduction for NR, indicating that more CCB nanoparticles are distributed in NR phase.
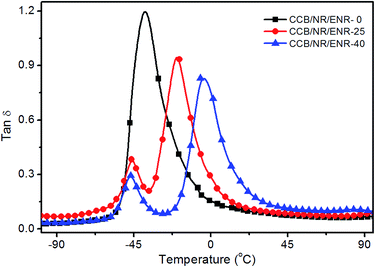 | ||
Fig. 1 Temperature dependence of tan![[thin space (1/6-em)]](https://www.rsc.org/images/entities/char_2009.gif) δ for the 30 wt% CCB-filled NR/ENR composites with indicated epoxidation level. δ for the 30 wt% CCB-filled NR/ENR composites with indicated epoxidation level. | ||
Compatibility-tuned distribution of nanoparticles
Generally, the final properties of a composite are contingent upon specific interaction between components and the resulted morphology. To investigate the state of distribution of CCBs in the blend, SEM and TEM were performed on the compression molded samples. Due to the similar phase contrast of NR and ENR derived from the same polyisoprene chain backbone, it is difficult to identify the NR and ENR phase in NR/ENR blend by etching one of the phases or using phase contrast difference of two components.22,26 However, the selective distribution of CCBs in NR/ENR blend can be confirmed by the compatibility-modulated morphology variation. Initially, CCB nanoparticles or aggregates are randomly dispersed in the NR matrix under the dynamic shear force by two-roll mixing (Fig. 2a and a′). Nevertheless, a faint network is observed in the blends when ENR-25 is used (Fig. 2b and b′), where the CCBs are partly distributed in the NR phase. Evidently, a “honeycomb-like” segregated structure is constructed throughout the matrix when the epoxide level is increased to 40 mol% (Fig. 2c and c′). It should be ascribed to the fact that the increase of epoxidation level should deprave the interfacial interaction of CCBs and ENR, thus more CCBs is preferentially located in NR phase. Meanwhile, the ENR domains are evolved with the growth of epoxidation, and act as templates for the formation of the “honeycomb-like” segregated networks. Here, the NR phase can also be regarded as bridges to link the CCBs and is valuable in weakening CCBs aggregation. The thermodynamic analysis also further coincide with the above result. As proven by Arjmand et al.27 and Wang et al.,28 the continuous “honeycomb-like” networks structure is in favor of the electron transportation and microwave attenuation.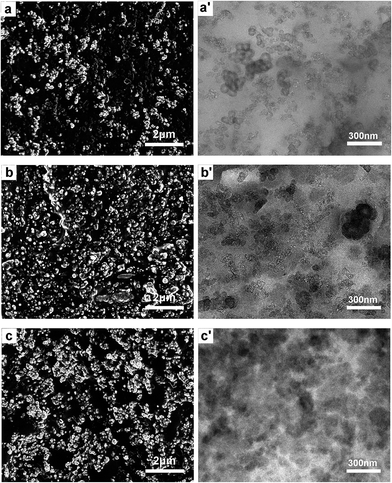 | ||
| Fig. 2 SEM and TEM images of 30 wt% CCBs filled NR/ENR composites with different epoxidation level: (a and a′) CCB/NR/ENR-0, (b and b′) CCB/NR/ENR-25 and (c and c′) CCB/NR/ENR-40. | ||
Electrical conductivity
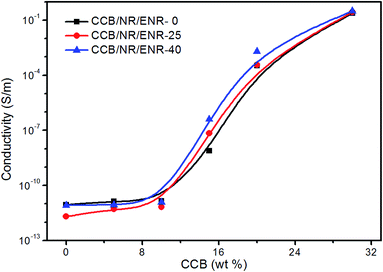
As mentioned above, the conductivity transition for polymer composites is stemmed for the conductive networks throughout the matrices. Understanding the conduction mechanisms will allow us to determine applications of MAs with various filler contents. Fig. 3 shows the electrical conductivity dependence on the CCBs loading for composites with different type ENR. It can be obviously seen that all the composites share the same percolation behavior that can be divided into three regions. When the CCB loading is below 10 wt%, all the composites show approximately the same electrical conductivity, which suggests CCB nanoparticles disperse separately from each other in the matrix at low loading. When the CCB contents increase from 10 wt% to 20 wt%, electrical conductivity dramatically scales from 6.67 × 10⁻¹² S m−1 to 3.67 × 10⁻⁴ S m−1 for CCB/NR/ENR-25 and 1.23 × 10⁻¹¹ S m−1 to 1.96 × 10⁻³ S m−1 for CCB/NR/ENR-40, while that of the CCB/NR/ENR-0 composites scales from 1.46 × 10⁻¹¹ S m−1 to 3.26 × 10⁻⁴ S m−1. With increasing the CCB content to exceed the percolation threshold, lots of CCB nanoparticles get close enough to each other to form conductive paths for electron hopping, and then networks throughout the matrix for electron transportation. Make a comparison among the three series composites, and a slightly decrease percolation concentration was observed as the epoxidation level increase, which means that there may be more conductive pathways near each other when ENR-40 was used. In other words, the higher epoxidation levels of ENR, the more significant selective distribution of CCBs, which can be evidenced by the SEM results. Note that the conductivity of these three kinds of rubber matrices are similar, such reduced percolation threshold can be attributed to the extreme geometry, excellent dispersion, and selective localization of the CCB in NR phase.Complex permittivity
Like other carbonaceous fillers, MA performance of CCB-filled elastomer composites can be associated with complex permittivity, where the real parts (ε′) and imaginary (ε′′) parts of complex permittivity represent the storage capability and loss of electric energy. Fig. 4 shows complex permittivity of rubber blend and its composites with CCBs over the frequency range of 2–18 GHz. Clearly, the permittivity value decreases with increasing frequency for all of the composites, which can indeed help to broaden the absorbing bandwidth.29 With the increase of CCBs, the ε′ of CCB/NR/ENR-0 composites (8.0 GHz) scales from 2.37 to 8.32, while the ε′′ scales from 0.03 to 1.91. The same trends were observed in CCB/NR/ENR-25 and CCB/NR/ENR-40 and other analogues,30,31 which is ascribed to the stronger polarization loss of thinner rubber layer and greater mean free path of more CCB network at higher CCB loading. It is noticed that complex permittivity of composites increases with the increasing of epoxidation level of ENR, indicating a compatibility-tuned morphology and dielectric property.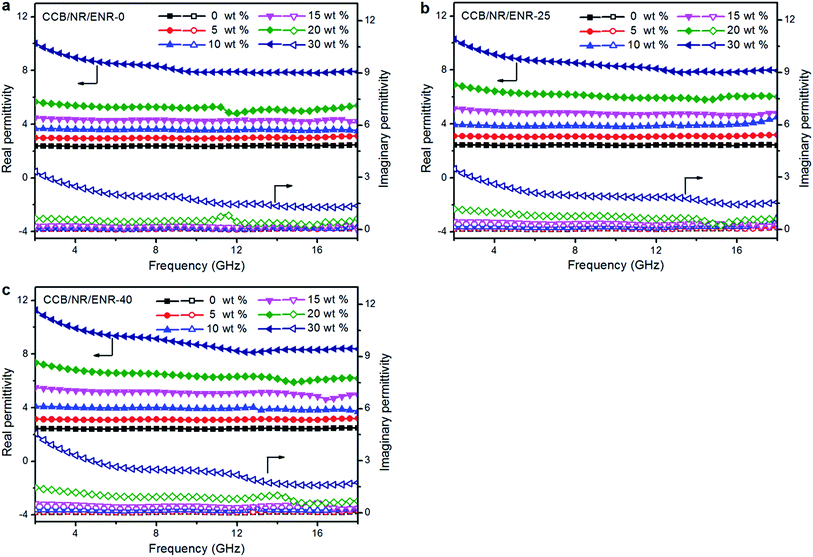 | ||
| Fig. 4 Real permittivity (solid) and imaginary permittivity (hollow) composites as a function of frequency. | ||
Microwave absorbing performance
The RL curves in 2–18 GHz for the composites with a specimen thickness of 4 mm and different CCB loading are shown in Fig. 5. Overall, the microwave performance of all composites is obviously improved compared with the neat matrix, and the minimum RL (RLmin) of all composites increases with the filler contents. For instance, the RLmin of 0 and 30 wt% CCB in the CCB/NR/ENR-0 composite are found to be −1.21 dB and −10.43 dB (Fig. 5a), respectively. Moreover, it can be seen that the ENR-involved composites share more obvious enhancement in MA properties than the CCB/NR/ENR-0 composites do, and the RLs decline from −1.23 dB to −10.90 dB for CCB/NR/ENR-25 (Fig. 5b) and −0.37 dB to −14.49 dB for CCB/NR/ENR-40 (Fig. 5c) when the CCB loading increase from 0 wt% to 30 wt%. The possible reason for this is that the strong attenuation characteristics of absorber must satisfy a proper matching of the magnetic loss and dielectric loss, the combination of NR and ENR is beneficial to the complementation of dielectric loss. | ||
| Fig. 5 RL curves at 4 mm as a function of frequency for CCB-filled NR/ENR blend with various CCB concentrations. | ||
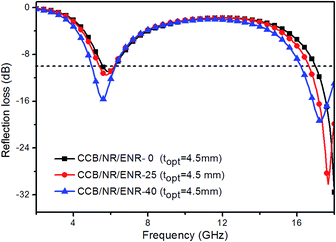
According to eqn (1) and (2), the microwave absorbing performance is influenced by many factors such as permittivity, permeability, sample thickness and frequency. With these scattering parameters, we calculated the RLs of the absorbing layer at different thickness from 1 to 5.5 mm. Since the calculation results demonstrate that all the composites share similar attenuation characteristic, only composites with 30 wt% CCBs were plotted (Fig. 6) and discussed here. It is found that the peak value shifts to lower frequency with the increasing of specimen thickness, which can be rationalized by the quarter-wavelength attenuation.32 The RLs at the optimal thickness for composites are extracted and shown in Fig. 7. It could be clearly seen that all the composites exhibit two strong absorption bands located 4–8 GHz and 12–18 GHz respectively corresponding to C-band and Ku-band, demonstrating that epoxidation of NR has no significant impact on the microwave characteristic CCB filled NR composites. It is worth noting that RLmin over C-band and Ku-band show a contrary trend with the increase of epoxidation level. When the epoxidation level changes form 0 to 40 mol%, the RLmin of composites (30 wt%) over C-band declines from −10.95 dB to −15.64 dB, whereas that of Ku-band elevates from −31.56 dB to −19.31 dB. Similar phenomenon has been observed for the blend ratio-depended microwave performance of CCB/NR/ENR composites in our previous work, which is may attribute to impedance matching but needed further confirmed. It is noted that the epoxidation of NR less favors the maximization of MA capacity over Ku-band, but it is competent to broaden qualified frequency bandwidth. Here, the bandwidth is defined as the frequency width where the RL is less than −10 dB, which means the frequency bandwidth that can attenuate 90% of incident microwave. The qualified frequency bandwidth of CCB/NR/ENR-40 composite (30 wt%) reach 2.96 GHz that covers 18.5% of the involved frequency, which is 85% broader than that of CCB/NR/ENR-0 (1.60 GHz) and CCB/NR/ENR-25 (2.08 GHz).
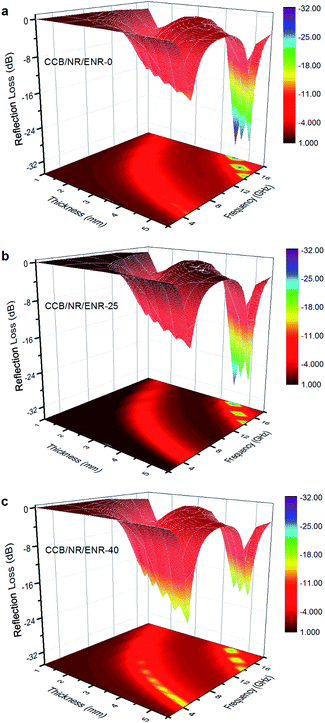 | ||
| Fig. 6 Three-dimensional presentations of the RLs of 30 wt% CCB-filled rubber composites at various thicknesses in 2–18 GHz. | ||
Table 2 lists the MA properties of some typical carbon black-filled polymer composites released in recent years,2,33–35 and it is clear that the MA abilities of CCB/NR/ENR composites are indeed superior or at least comparable to those composites, indicating their comparable MA capacity. It must be mentioned that such good performance of CCB preferentially located NR/ENR composite has been achieved without any assistance of any common metals or metal oxides, which further demonstrates their promising prospect as a novel strategy for the fabrication of lightweight microwave absorbers.
| Matrix | Filler content | Thickness (mm) | RLmin (dB) | BW−10 dB (GHz) | Ref. |
|---|---|---|---|---|---|
| a Hydrogenated acrylonitrile–butadiene rubber.b Polyaniline. | |||||
| HNBRa | 20% | 1.7 | −13.1 | 2.90 | 2 |
| PANIb | 30% | 2.0 | −40.0 | 3.10 | 25 |
| Silicone rubber | 10% | 2.0 | −22.2 | 3.90 | 26 |
| Epoxy | 20% | 2.7 | −31.1 | 3.00 | 27 |
| NR/ENR-25 | 30% | 4.5 | −19.31 | 2.08 | Herein |
| NE/ENR-40 | 30% | 4.5 | −30.17 | 2.96 | Herein |
Essential for microwave attenuation
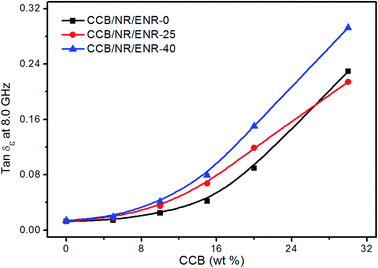
As the mentioned above, CCB-filled NR/ENR composites have negligible magnetic loss mechanism, therefore they attenuate the incident electromagnetic wave via single dielectric loss mechanism. Dielectric dissipation factor (tan![[thin space (1/6-em)]](https://www.rsc.org/images/entities/char_2009.gif) δε = ε′′/ε′) is a common parameter to evaluate the dielectric loss abilities of microwave absorbers. As shown in Fig. 8, tan
δε = ε′′/ε′) is a common parameter to evaluate the dielectric loss abilities of microwave absorbers. As shown in Fig. 8, tan![[thin space (1/6-em)]](https://www.rsc.org/images/entities/char_2009.gif) δε of composites show quite low value (around 0.013) for bare elastomeric, and ascend to more than 0.21 with the increasing of CCB loadings. Moreover, with the introduction of ENR, tan
δε of composites show quite low value (around 0.013) for bare elastomeric, and ascend to more than 0.21 with the increasing of CCB loadings. Moreover, with the introduction of ENR, tan![[thin space (1/6-em)]](https://www.rsc.org/images/entities/char_2009.gif) δε can be substantially enhanced from ENR-0 to ENR-40. It is widely accepted that dielectric loss ability mainly results from conductivity loss and polarization loss, where the latter can be further divided as dipole orientation polarization and interfacial polarization in the involved frequency. Our previous work revealed that remarkable increment in the epoxidation level of ENR does not produce a significant improvement in tan
δε can be substantially enhanced from ENR-0 to ENR-40. It is widely accepted that dielectric loss ability mainly results from conductivity loss and polarization loss, where the latter can be further divided as dipole orientation polarization and interfacial polarization in the involved frequency. Our previous work revealed that remarkable increment in the epoxidation level of ENR does not produce a significant improvement in tan![[thin space (1/6-em)]](https://www.rsc.org/images/entities/char_2009.gif) δε for CCB/ENR-40, implying that conductivity loss and interfacial polarization should be the dominant mechanisms for dielectric loss.
δε for CCB/ENR-40, implying that conductivity loss and interfacial polarization should be the dominant mechanisms for dielectric loss.
The high MA capacity of CCB/NR/ENR composites is attributed to electrical conduction loss, dielectric relaxation, interface scattering, and multiple reflections (as schematically illustrated in Fig. 9). When electromagnetic waves propagate within the composites, the directional motion of charge carriers on CCB formed oscillatory current, and boundary charges induces dielectric relaxation and polarization. The dielectric relaxation and polarization are mainly induced by interfacial multi-poles, which exists along the boundaries between CCB sheets and rubber matrix. They are related to the interface area, which was the same as the interface scattering. Moreover, the selectively distributed CCBs with high specific surface area constitute more intact conduction network within the rubber matrix, resulting in high conduction loss. Finally, due to the difference in complex permittivity between CCB and NR/ENR blend, pronounced interface scattering can be generated. High surface area of CCB with well dispersion enhances the attenuation caused by relaxation and scattering. Furthermore, multiple reflections could be induced due to the intact CCB network, thus extending, the routes of electromagnetic waves propagate in the layer, which brings more efficient absorption.
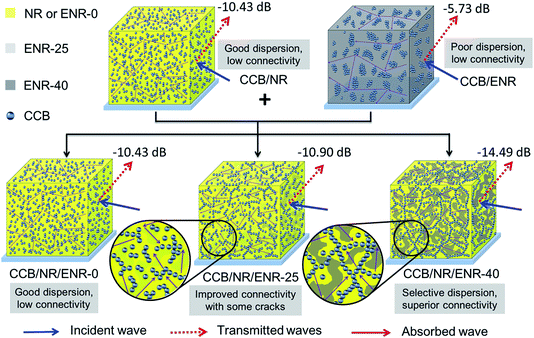 | ||
| Fig. 9 Schematic representation of microwave transfer across the typical localization scenarios of CCB-filled rubber composite. | ||
Conclusion
In summary, by adopting thermodynamics-induced preferential location of nanoparticles in co-continuous blends, microwave absorbers with improved performance can be designed using a trinary CCB/NR/ENR composite. The selective distribution and morphology of CCBs in matrix can be easily tuned by adjusting the compatibility of NR and ENR, which is conduced to the improvement in electrical conductivity, complex permittivity, and MA performance. The MA performance of composites has been enhanced by incorporation of ENR and increased with the increase epoxidation level of ENR, i.e. decreasing of miscibility between NR and ENR. Investigations on the mechanism of microwave attenuation indicate that conduction loss, interfacial polarization, and multiple reflections contribute to the dielectric loss significantly, which is beneficial to producing strong reflection loss. This approach provides a new strategy for the development of some novel lightweight microwave absorbers with desired microstructure and enhanced functional property.Acknowledgements
This work is financially supported by the Natural Science Foundation of Hainan Province, PR China (No. 20155197), the Natural Science Foundation of Guangdong Province PR China (2016A030307004) and the Fundamental Scientific Research Funds for Chinese Academy of Tropical Agricultural Sciences (No. 1630022015033 and 1630062013011).References
- J. Wei, S. Zhang, X. Liu, J. Qian, J. Hua, X. Li and Q. Zhuang, J. Mater. Chem. A, 2015, 3, 8205–8214 CAS.
- Y. Zhai, Y. Zhang and W. Ren, Mater. Chem. Phys., 2012, 133, 176–181 CrossRef CAS.
- G. Sun, B. Dong, M. Cao, B. Wei and C. Hu, Chem. Mater., 2011, 23, 1587–1593 CrossRef CAS.
- R. Qiang, Y. Du, H. Zhao, Y. Wang, C. Tian, Z. Li, X. Han and P. Xu, J. Mater. Chem. A, 2015, 3, 13426–13434 CAS.
- Y.-L. Ren, H.-Y. Wu, M.-M. Lu, Y.-J. Chen, C.-L. Zhu, P. Gao, M.-S. Cao, C.-Y. Li and Q.-Y. Ouyang, ACS Appl. Mater. Interfaces, 2012, 4, 6436–6442 CAS.
- Y. Zhang, Y. Huang, T. Zhang, H. Chang, P. Xiao, H. Chen, Z. Huang and Y. Chen, Adv. Mater., 2015, 27, 2049–2053 CrossRef CAS PubMed.
- M. Najim, G. Modi, Y. K. Mishra, R. Adelung, D. Singh and V. Agarwala, Phys. Chem. Chem. Phys., 2015, 17, 22923–22933 RSC.
- P. Bollen, N. Quiévy, I. Huynen, C. Bailly, C. Detrembleur, J. M. Thomassin and T. Pardoen, Scr. Mater., 2013, 68, 50–54 CrossRef CAS.
- R. Shtarkova and N. Dishovsky, J. Elastomers Plast., 2009, 41, 163–174 CrossRef CAS.
- V. K. Singh, A. Shukla, M. K. Patra, L. Saini, R. K. Jani, S. R. Vadera and N. Kumar, Carbon, 2012, 50, 2202–2208 CrossRef CAS.
- I. Kong, S. H. Ahmad, M. H. Abdullah, D. Hui, A. N. Yusoff and D. Puryanti, J. Magn. Magn. Mater., 2010, 322, 3401–3409 CrossRef CAS.
- Y. Zhai, W. Wu, Y. Zhang and W. Ren, Compos. Sci. Technol., 2012, 72, 696–701 CrossRef CAS.
- S. Vinayasree, M. A. Soloman, V. Sunny, P. Mohanan, P. Kurian and M. R. Anantharaman, Compos. Sci. Technol., 2013, 82, 69–75 CrossRef CAS.
- Y. Chen, X. Y. Liu, X. Y. Mao, Q. X. Zhuang, Z. Xie and Z. W. Han, Nanoscale, 2014, 6, 6440–6447 RSC.
- X.-J. Zhang, G.-S. Wang, W.-Q. Cao, Y.-Z. Wei, J.-F. Liang, L. Guo and M.-S. Cao, ACS Appl. Mater. Interfaces, 2014, 6, 7471–7478 CAS.
- S. Biswas, G. P. Kar and S. Bose, ACS Appl. Mater. Interfaces, 2015, 7, 25448–25463 CAS.
- S. Biswas, G. P. Kar and S. Bose, Phys. Chem. Chem. Phys., 2015, 132, 5672–5676 Search PubMed.
- G. P. Kar, S. Biswas, R. Rohini and S. Bose, J. Mater. Chem. A, 2015, 3, 7974–7985 CAS.
- A. Göldel, A. Marmur, G. R. Kasaliwal, P. Pötschke and G. Heinrich, Macromolecules, 2011, 44, 6094–6102 CrossRef.
- P. Zhao, L. Li, Y. Luo, Z. Lv, K. Xu, S. Li, J. Zhong, Z. Wang and Z. Peng, Composites, Part B, 2016, 99, 216–223 CrossRef CAS.
- Q. Cao, Y. Song, Y. Tan and Q. Zheng, Carbon, 2010, 48, 4268–4275 CrossRef CAS.
- H. H. Le, M. N. Sriharish, S. Henning, J. Klehm, M. Menzel, W. Frank, S. Wießner, A. Das, K. W. Stöckelhuber, G. Heinrich and H. J. Radusch, Compos. Sci. Technol., 2014, 90, 180–186 CrossRef CAS.
- S. Biswas, G. P. Kar and S. Bose, Nanoscale, 2015, 7, 11334–11351 RSC.
- H. H. Le, S. Wießner, A. Das, D. Fischer, M. auf der Landwehr, Q. K. Do, K. W. Stöckelhuber, G. Heinrich and H. J. Radusch, Eur. Polym. J., 2016, 75, 13–24 CrossRef CAS.
- H. H. Le, T. Pham, S. Henning, J. Klehm, S. Wießner, K. W. Stöckelhuber, A. Das, X. T. Hoang, Q. K. Do, M. Wu, N. Vennemann, G. Heinrich and H. J. Radusch, Polymer, 2015, 73, 111–121 CrossRef CAS.
- G. Wu, B. Li and J. Jiang, Polymer, 2010, 51, 2077–2083 CrossRef CAS.
- M. Arjmand, T. Apperley, M. Okoniewski and U. Sundararaj, Carbon, 2012, 50, 5126–5134 CrossRef CAS.
- T. Wang, Y. Li, S. Geng, C. Zhou, X. Jia, F. Yang, L. Zhang, X. Ren and H. Yang, RSC Adv., 2015, 49, 2875–2877 Search PubMed.
- Y. Wang, D. Chen, X. Yin, P. Xu, F. Wu and M. He, ACS Appl. Mater. Interfaces, 2015, 7, 26226–26234 CAS.
- H. Wang, D. Zhu, W. Zhou and F. Luo, RSC Adv., 2015, 5, 86656–86664 RSC.
- Y. Xu, D. Zhang, J. Cai, L. Yuan and W. Zhang, J. Magn. Magn. Mater., 2013, 327, 82–86 CrossRef CAS.
- W.-L. Song, M.-S. Cao, B. Wen, Z.-L. Hou, J. Cheng and J. Yuan, Mater. Res. Bull., 2012, 47, 1747–1754 CrossRef CAS.
- K. H. Wu, T. H. Ting, G. P. Wang, W. D. Ho and C. C. Shih, Polym. Degrad. Stab., 2008, 93, 483–488 CrossRef CAS.
- S. K. Kwon, J. M. Ahn, G. H. Kim, C. H. Chun, J. S. Hwang and J. H. Lee, Polym. Eng. Sci., 2002, 42, 2165–2171 CAS.
- J. Kim, S. Lee and C. Kim, Compos. Sci. Technol., 2008, 68, 2909–2916 CrossRef CAS.
| This journal is © The Royal Society of Chemistry 2017 |

