 Open Access Article
Study on the differences in the oxidation characters of two chinese coals†
Guolan Dou and
Xiaoxing Zhong *
*
School of Safety Engineering, China University of Mining &Technology, Xuzhou 221116, China. E-mail: zhxxcumt@126.com
First published on 27th March 2017
Abstract
The adiabatic oxidation test indicates that the self-heating rate of candle coal (YM) is higher than that of non-coking coal (DFS) in the initial stage, whereas it is lower than that of DFS coal in the later stage. These differences were analyzed based on the 1H NMR spectra of the THF extracts, obtained under ultrasonic irradiation. Some active groups were found in these two coals, and some structural models were designed according to the 1H NMR spectra of the THF extracts. The activation energies (E) and the enthalpy changes (ΔH) of the typical groups were calculated (by Gaussian 09W) to explain the differences in the oxidation characters for the two coals in this study. The results showed that the activation energy (E) for the reaction of  , of which the YM coal contained more, and ArCH2Ar and
  , of which the DFS coal contained more, was 4.33 kJ mol−1, 37.53 kJ mol−1, and 81.54 kJ mol−1 and the change in the enthalpy values was 48.03 kJ mol−1, 272.76 kJ mol−1, and 78.01 kJ mol−1, respectively, which can explain the differences in the oxidation of these two coals in the low-temperature stage. In conclusion, the differences in the self-heating rate are attributed to the different chemical structures and reactivity of the compounds present in the coals.
Introduction
Self-heating and spontaneous combustion of coal are quite common during its exploitation, storage, and transportation.1,2 This phenomenon is directly linked to the nature of the coal as an active organic material. Recently, the increased use of coal has led to a requirement for the development of a technology to prevent its spontaneous combustion during storage and transportation. Thus, it is important to understand the mechanism of the spontaneous combustion process.It is well-known that oxidation of coal involves a reaction sequence that consists of a series of steps3–6 including chemisorption of oxygen on the pore surfaces, formation of carbon–oxygen complexes, decomposition of unstable solid oxygenated intermediates into gaseous products and stable solid complexes, generation of new active sites for oxidation, etc. It has been reported that a number of parameters including mass change, heat evolution, temperature increase characteristics, oxygen consumption, and nature of the gaseous products were studied by investigators to elucidate the oxidation process.3,7–10 Winmill reported an exponential decrease in the rate of oxygen consumption with time during coal oxidation.11 Carpenter and Giddings reported that the rate of oxygen consumption is limited by the rate of oxygen transport within the coal pores,12 and Akgün F. analyzed the influence of particle size on the oxidation rate in greater depth.13 It has also been reported that water contained in coal may promote or inhibit its oxidation.14–19 Wang H. investigated the characteristics of the gaseous products formed by coal oxidation using an isothermal flow reactor and proposed to apply the molar ratio of produced CO to consumed O2 as an index for ranking the coal propensity to self-heating and for determining the onset of spontaneous combustion.20 However, there is little research on the differences in reaction rates for coal spontaneous combustion based on the chemical structure of the compounds contained in the coal.
In recent years, many researchers have studied solvent extraction of brown coal using solvents such as supercritical solvents, binary solvents, alkali aqueous solutions, and water for the analysis of the coal structure, and tetrahydrofuran (THF) was known as the best solution to dissolve aliphatic groups.21–26 However, solvent extraction has not been applied to date for the study of the spontaneous combustion of coal. Therefore, herein, we studied the differences in the self-heating process of two Chinese coals by the adiabatic self-heating test and endeavoured to explain the differences in the temperature increase according to the chemical structure and reactivity of the compounds extracted by ultrasonic irradiation from the coals.
Experimental
Coal samples
A candle coal sample was obtained from the Yima mine (YM) in Western Henan and a non-coking coal sample was obtained from the Dafosi mine (DFS) in the Bin County, Shanxi, China. The coal samples were ground to a particle size of 0.18–0.38 mm and then dried overnight in vacuum at 313 K prior to the experiments. The proximate and ultimate analyses of the coals are listed in Table 1.| Coal | Proximate analysis (dry ash free basis) | Ultimate analysis | |||||
|---|---|---|---|---|---|---|---|
| Mad (%) | Aad (%) | Vad (%) | Cdaf (%) | Hdaf (%) | Ndaf (%) | Odaf (%) | |
| YM | 7.28 | 6.95 | 40.36 | 74.99 | 4.66 | 0.96 | 19.10 |
| DFS | 4.74 | 5.77 | 28.70 | 82.44 | 4.04 | 0.70 | 12.72 |
The adiabatic oxidation study of the coal samples usually requires the samples to have a particle size of 0.18–0.38 mm; however, there is little research on the surface area of the samples. Thus, to ensure that the size range was small enough to overcome mass transfer limitation, surface area analysis of the coal samples was performed using the Quantachrome Autosorb-iQ analyzer by the N2 Brunauer–Emmett–Teller (BET) adsorption method over a partial pressure range of 0.05–0.3. The results are shown in Table 2. The results indicate that the average pore sizes of these two samples were small enough to avoid mass transfer resistance and therefore a particle size of 0.18–0.38 mm was suitable.
| Coal | Surface area (m2 g−1) | Average pore size (nm) |
|---|---|---|
| YM | 1.1724 | 1.5916 |
| DFS | 3.4329 | 8.6702 |
Adiabatic oxidation of the coal samples
Each coal sample (80 g) was charged in an adiabatic oven to ensure that there was a well air tightness of airflow within the sample. A 100 mL min−1 oxygen-free nitrogen gas flow was allowed to pass through the sample for at least 24 h to stabilize it at a predetermined initial temperature for the test and to prevent the partial oxidation of the sample. After drying, the coal sample was placed inside the adiabatic oven at 40 °C and was allowed to equilibrate. When the sample temperature had stabilized, the oven was switched to remote-monitoring mode (enabling the oven to track the temperature increase in the coal sample due to its oxidation) and the gas selection switch was turned to high-purity oxygen at the constant flow rate of 20 mL min−1. If the flow rate of oxygen is too high, the gas flow can reduce the heat and thus the coal sample is unable to efficiently retain heat. After repeated experiments, it was found that a gas flow of 20 mL min−1 was ideal. The temperature change in the coal sample with time was obtained by a data logging system for later analysis.Ultrasonic extraction of the coal samples
Typically, 5 g dried coal and 20 mL THF were mixed and charged in a flask to be extracted for 8 h under ultrasonic (40 Hz) irradiation at room temperature. The mixtures were kept overnight and then filtered. The filtrates were then concentrated. The obtained samples were then concentrated for analysis by 1H NMR (400 M, UNITY INOVA 400, Varian) in CDCl3. Chemical shifts (δ) were given in parts per million relative to TMS as the internal standard. The extracts were also characterized using a Nicolet 6700 FTIR spectrometer.Results and discussion
Adiabatic oxidation of the coal samples
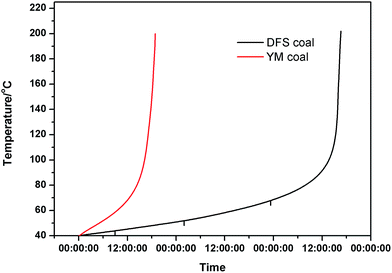
In this study, we investigated the adiabatic oxidation of YM and DFS coal samples via a self-developed adiabatic oxidation experimental system. The self-heating curves of the two coal samples are shown in Fig. 1.Moreover, repeated adiabatic experiments were conducted and the average self-heating rate for the process of coal spontaneous combustion was calculated for every 10 °C interval and can be expressed as the following formula:
| νi+5 = 10/(τi+10 − τi) | (1) |
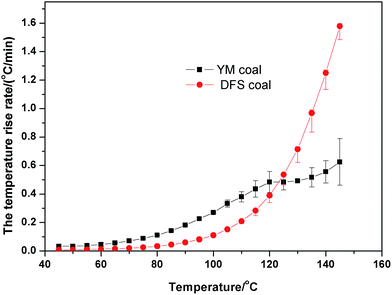
The self-heating rates of these two coals were calculated by eqn (1), and the results are shown in Fig. 2.
From the adiabatic self-heating curves, we found that the temperature of YM coal can reach 160 °C in a short time, whereas that of the DFS coal took longer to reach the same temperature. Moreover, after analyzing the self-heating rate of these two coals, we found that YM coal is more active in the initial stage, whereas the opposite applies for the DFS coal.
As observed from Fig. 2, there are two stages in the self-heating process: a slow process at temperatures lower than 100 °C and a fast process at temperatures higher than 100 °C. The proximate and ultimate analysis results of the two coal samples showed that YM coal had a higher content of volatiles, whereas DFS coal contained low content of volatiles. As it is known, volatiles are usually released at high temperatures and thus the self-heating rate of YM coal is higher than that of DFS coal in the initial stage. When the temperature is high enough, the volatile content is released, and the YM coal, as it contains more volatiles, needs more time to oxidize. This could explain the different heating rates between the two coal samples. Next, we studied the reaction rate during the coal spontaneous combustion based on the chemical structures of the compounds extracted from the coal.
Ultrasonic extraction of the coal samples
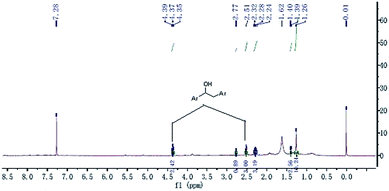
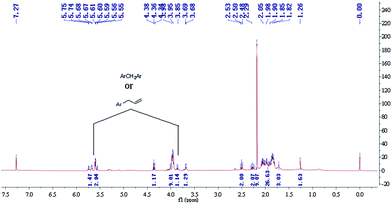
It is well-documented that coal is an organic macromolecular mixture, and the oxidation of coal involves a reaction sequence. Although the detailed structure is still under debate, it was considered that the structure of the coal plays an important role in the oxidation. However, IR spectra cannot fully detail the structure, as it only provides the characteristic group vibrations. To further study the differences between the two coals, 1H NMR was used. In this study, we tried to understand the differences in the self-heating rates of YM and DFS coals from the 1H NMR and FTIR spectra of the compounds extracted by ultrasonic irradiation in THF.It has been reported by some previous investigators that aromatic nuclei barely participate in the oxidation reactions during the process of coal low temperature oxidation,27–29 whereas some active groups play an important role in it.30 Moreover, it is well-known that tetrahydrofuran (THF) can dissolve aliphatic groups well; therefore, THF was selected as the extracting solvent in this study. The obtained samples were then concentrated and analyzed by 1H NMR in CDCl3, with chemical shifts (δ) given in parts per million relative to TMS as the internal standard. The spectra for the YM and DFS compounds are shown in Fig. 3 and 4, respectively. In addition, the extracted samples were also analyzed by FTIR (spectra available in the ESI†).
After observing the spectra, we found that there are some differences between the components of YM coal and DFS coal extracted in THF.
The 1H NMR spectrum of the extracted component of DFS coal showed extra peaks at δ 5.55–5.75 ppm and 3.68–3.98 ppm, corresponding to the protons of ArCH2Ar and  , respectively. However, in the spectrum of the extracted component of YM coal in THF, there are unit peaks at δ 4.35–4.39 ppm and 2.24–2.77 ppm corresponding to the protons of
  or alkyl groups connected with an aromatic ring. Although there are also unit peaks at δ 4.34–4.38 ppm, the content of these protons is very low. Moreover, the 1H NMR spectrum of the extracted component of DFS coal and YM coal samples also display peaks at δ 1.26–2.07 ppm and 1.26–1.40 ppm, corresponding to the protons of fatty hydrocarbons.
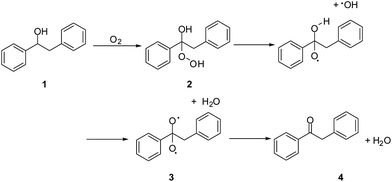
According to literature reports, some of the compounds in the 1H NMR spectra contain reactive groups in oxidation reactions. In the early spontaneous combustion of coal, the oxidation of reactive groups on the coal surface dominates; however, according to chemical laws, for oxidation to occur, an activation energy must be overcome. To study the differences between these two coals well, some structure models were designed according to the 1H NMR and FTIR spectra of the extracted components in THF. Some structural models were based on the active groups. First, we studied the model 1 (diphenyl carbinol), of which the YM coal may contain more. The structure of model 1 and the theoretical value of chemical shifts of the active sites are shown in Fig. 5.
Many researchers have proposed that hydroperoxide undergoes thermal decomposition to directly form carbonyl-containing species.31,32 Therefore, we proposed the following steps for the oxidation of compound 1 to product 4: first, a hydroperoxide 2 was formed and then converted into diradical 3, which is unstable and can rapidly evolve into the carbonyl-containing product 4 (Scheme 1).
With the use of discrete fourier transform (DFT) and the B3LYP/6-31G computer programme, a geometrical optimization of the reactants, transition states, and products was obtained. After calculating the vibration frequency of each stagnation point and carrying out a vibration analysis, the zero-point energy (ZPE) was obtained. The results are shown in Table 3. All calculations were carried out using the Gaussian 09w program package.
| Substance | H (Hartree) | G (Hartree) | E (Hartree) |
|---|---|---|---|
| MI | −767.035249 | −767.094043 | −767.036193 |
| TS | −767.045985 | −767.096108 | −767.034544 |
| Products (3) | −767.053545 | −767.106277 | −767.044489 |
| ΔH (kJ mol−1) | −48.03 | ||
| Ea (kJ mol−1) | 4.33 |
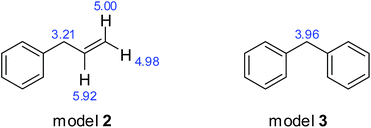
Second, we studied models 2 and 3, of which DFS coal may contain more. The structures of model 2 and 3, and the theoretical values of chemical shifts of the active sites are shown in Fig. 6.
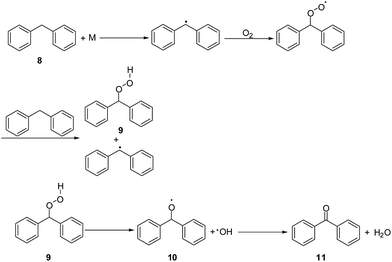
In the same way, the thermodynamic data for the oxidation of model 2 and 3, illustrated in Scheme 2 and 3, respectively, were calculated, and the results are shown in Table 4 and 5, respectively. First, methylene connected to the benzene ring and the vinyl group is very reactive and can be easily oxidized. After reacting with oxygen, the C–C bond splits to produce ethylene. Similarly, methylene connected with two benzene rings is also very reactive and can evolve to a radical that reacts with oxygen to produce a superoxide radical and the hydroperoxide 9, and finally converts to benzophenone 11 and water.
| Substance | H (Hartree) | G (Hartree) | E (Hartree) |
|---|---|---|---|
| MI | −499.073762 | −499.120980 | −499.074706 |
| TS | −499.042706 | −499.090279 | −499.043650 |
| Products (7) | −499.103414 | −499.157324 | −499.104359 |
| ΔH (kJ mol−1) | −78.01 | ||
| Ea (kJ mol−1) | 81.54 |
| Substance | H (Hartree) | G (Hartree) | E (Hartree) |
|---|---|---|---|
| MI | −652.559577 | −652.614725 | −652.789158 |
| TS | −652.552802 | −652.606888 | −652.774864 |
| Products | −652.663468 | −652.719897 | −652.664412 |
| ΔH (kJ mol−1) | −272.76 | ||
| Ea (kJ mol−1) | 37.53 |
From the abovementioned results, we found that the enthalpy changes of the reactions depicted above are negative, which means that the reactions are exothermic. The activation energies of the reactions are 4.33 kJ mol−1, 81.54 kJ mol−1, and 37.53 kJ mol−1. It is well-known that once the reaction system exceeds the activation energy and there are enough collisions between activated groups, the chemical reaction takes place. Thus, if activated groups are less, the effective collisions are less, and the chemical reaction rate is lower. Therefore, in the initial stage, the YM coal, which contains more activated groups such as  is more active than the DFS coal, which contains more ArCH2Ar or
  , and the self-heating rate of YM coal is higher than that of DFS coal. With the increase in the temperature, the heat increases, and most of the active groups in the YM coal complete the reaction. However, by now, the activation energy for the oxidation of
  and methylene ether linkage is achieved; thus, the oxidation of DFS coal is accelerated, leading to a rapid increase in the temperature rate for the DFS coal. In summary, the YM coal, which contains active groups (such as
  ), whose activation energy is low, reacted well in the initial stage and the self-heating rate was high, whereas for the DFS coal, the opposite applies.
Conclusions
The adiabatic self-heating of YM and DFS coals was studied. Upon comparing these two coals, we found that the self-heating rate of the DFS coal is lower than that of the YM coal in the initial stage, but is higher in the later stage. The differences between these two coals can be well explained from the chemical structures of their compounds and the activation energy (Ea) and enthalpy changes (ΔH) corresponding to the reactions of these compounds. The YM coal contains more , whose activation energy (Ea) is low; thus, its oxidation can easily take place and produce heat (ΔH) in the initial stage. However, as the reaction progresses, active groups such as
  complete the oxidation reaction, less heat is released, and the temperature rate decreases. On the other hand, the active groups in the DFS coal such as the olefinic bond and methylene ether linkage have higher activation energies and do not react in the early stage; thus, its initial temperature rate is low. However, as energy accumulates, the activation energies (Ea) required for DFS coal are reached and thus oxidation takes place and temperature increases. In conclusion, the differences between the chemical structures of the compounds present in the coals are considered as the main cause for the differences in the oxidation characters of these two different coals.
Acknowledgements
We are grateful for the financial support received from the Fundamental Research Funds of the Central Universities (2017XKMS001), the Foundation Research Project of the Jiangsu Province (the Natural Science Fund No. BK20141132), the New Century Excellent Researcher Award Program from the Ministry of Education of the People's Republic of China (No. NCET-13-1021), and funding from the Priority Academic Program Development of the Jiangsu Higher Education Institutions.Notes and references
- B. Ham, A review of spontaneous combustion incidents, University of Wollongong and the Australasian Institute of Mining and Metallurgy, Wollongong, Australian, 2005, p. 237 Search PubMed.
- J. Wachowicz, J. China Univ. Min. Technol., 2008, 18, 332 CrossRef.
- H. Wang and B. Z. Dlugogorski, et al., Combust. Flame, 2003, 134, 107 CrossRef CAS.
- H. Wang and B. Z. Dlugogorski, et al., Fuel, 1999, 78, 1073 CrossRef CAS.
- A. H. Clemens and T. W. Matheson, et al., Fuel, 1991, 70, 215 CrossRef CAS.
- J. S. Gethner, Fuel, 1987, 66, 1091 CrossRef CAS.
- J. N. Carras and B. C. Young, Prog. Energy Combust. Sci., 1994, 20, 1 CrossRef.
- R. Kaji and Y. Hishinuma, et al., Fuel, 1985, 64, 297 CrossRef CAS.
- R. Kaji and Y. Hishinuma, et al., Fuel, 1987, 66, 154 CrossRef CAS.
- X. D. Chen and L. V. Chong, Trans. Inst. Chem. Eng., Part A, 1995, 73, 101 CAS.
- T. F. Winmill, Trans. Inst. Min. Eng., 1913/1914, 46, 563 Search PubMed.
- D. L. Carpenter and D. G. Giddings, Fuel, 1964, 43, 247 CAS.
- F. Akgün and A. Arisoy, Combust. Flame, 1994, 99(1), 137 CrossRef.
- F. E. Huggins and G. P. Huffman, Chemistry of coal weathering, 1989, vol. 14, p. 33 Search PubMed.
- S. H. Katz and H. C. Porter, Effects of moisture on the spontaneous heating of stored coal. TP 172 US Bureau of Mines, 1917 Search PubMed.
- O. P. Mahajan and M. Komatsu, et al., Fuel, 1980, 59, 3 CrossRef CAS.
- A. H. Clemens and T. W. Matheson, Fuel, 1996, 75, 891 CrossRef CAS.
- J. Kudynska and H. A. Buckmaster, Fuel, 1996, 75, 872 CrossRef CAS.
- L. D. Schmidt, in Chemistry of coal utilization, ed. H. H. Lowry, Wiley, New York, 1945, p. 627 Search PubMed.
- H. Wang and B. Z. Dlugogorski, et al., Energy Fuels, 2002, 16, 586 CrossRef CAS.
- M. Stefanova and R. T. Bernd, et al., Fuel, 1995, 74, 768 CrossRef CAS.
- D. Tian and X. Liu, et al., Min. Sci. Technol., 2010, 20, 562 CAS.
- H. Shui and C. Lin, et al., Fuel, 2010, 89, 1647 CrossRef CAS.
- M. Stefanova and R. T. Bernd, et al., Fuel, 1995, 74, 768 CrossRef CAS.
- M. Iino and T. Takanohashi, et al., Fuel, 1988, 67, 1639 CrossRef CAS.
- T. Ishizuka and T. Takanohashi, et al., Fuel, 1993, 72, 579 CrossRef CAS.
- S. K. Krishnaswamy and S. Bhat, et al., Fuel, 1996, 75, 333 CrossRef CAS.
- S. K. Krishnaswamy and S. Bhat, et al., Fuel, 1996, 75, 344 CrossRef CAS.
- H. Wang and B. Z. Dlugogorski, et al., Fuel, 1999, 78, 1073 CrossRef CAS.
- T. Shi and X. Wang, et al., Combust. Flame, 2005, 140, 332 CrossRef CAS.
- A. H. Clemens and T. W. Matheson, et al., Fuel, 1991, 70, 215 CrossRef CAS.
- H. Wang and B. Z. Dlugogorski, et al., Prog. Energy Combust. Sci., 2003, 29, 487 CrossRef CAS.
Footnote |
| † Electronic supplementary information (ESI) available. See DOI: 10.1039/c6ra26168j |
| This journal is © The Royal Society of Chemistry 2017 |

