 Open Access Article
Activated carbon with hierarchical micro–mesoporous structure obtained from rice husk and its application for lithium–sulfur batteries
Duc-Luong Vu,
Jae-Sung Seo,
Ha-Yan Lee and
Jae-Won Lee *
*
Dankook University, 119 Dandae-ro, Dongnam-gu, Cheonan 330-714, Republic of Korea. E-mail: jwlee7@dankook.ac.kr
First published on 16th January 2017
Abstract
Rice husk is one of the most earth abundant, low-cost, and eco-friendly agricultural residues. In this study, we successfully synthesized micro/mesoporous activated carbon from rice husk (AC-RH) through carbonizing the rice husk and activating it with ZnCl2. Elemental sulfur was loaded to the micro/mesopores through a solution infiltration method to form an AC-RH/S composite. The obtained AC-RH/S composites with different sulfur-loading levels were tested as cathode materials for lithium sulfur (Li–S) batteries. The AC-RH/S composite with sulfur loading (AC-RH/S1) of 23 wt% showed an initial discharge capacity of 1352 mA h g−1 at 0.1 C-rate. After 100 cycles of charge/discharge at a current density of 335 mA g−1, the AC-RH/S1 composite retained a high specific capacity of 518 mA h g−1 with a capacity retention of 49%. The material delivered a capacity of 426 mA h g−1 at 2C rate. These results suggest that rice husk can be a sustainable resource for the large-scale production of activated carbon, which is a promising material for the cathodes of Li–S batteries.
1. Introduction
Lithium–sulfur batteries are attracting considerable attention as a promising energy storage device for electric power owing to their remarkably high theoretical energy density of 2600![[thin space (1/6-em)]](https://www.rsc.org/images/entities/char_2009.gif) W h kg−1 and specific capacity of 1672 mA h g−1 (based on overall reaction: S8 + 16Li ↔ 8Li2S) which is 3–4 times higher than the present lithium-ion battery system.1–5 Meanwhile, as a cathode, sulfur has advantages of having a low cost, widespread availability, natural abundance, and environmental friendliness.1,3,4,6 However, common use of sulfur cathodes is still impeded by many issues that need to be further resolved. Utilization of sulfur cathodes is limited due to their low coulombic efficiency and fast capacity fading. More critically, poor reversibility of sulfur due to the dissolution of lithium polysulfides (Li2Sx, 2 < x ≤ 8) and large volumetric expansion during the lithiation process results in limited cycle life of Li–S batteries.7–9
W h kg−1 and specific capacity of 1672 mA h g−1 (based on overall reaction: S8 + 16Li ↔ 8Li2S) which is 3–4 times higher than the present lithium-ion battery system.1–5 Meanwhile, as a cathode, sulfur has advantages of having a low cost, widespread availability, natural abundance, and environmental friendliness.1,3,4,6 However, common use of sulfur cathodes is still impeded by many issues that need to be further resolved. Utilization of sulfur cathodes is limited due to their low coulombic efficiency and fast capacity fading. More critically, poor reversibility of sulfur due to the dissolution of lithium polysulfides (Li2Sx, 2 < x ≤ 8) and large volumetric expansion during the lithiation process results in limited cycle life of Li–S batteries.7–9
Many researchers have attempted to solve these problems by wrapping sulfur with graphene,10 forming a composite of sulfur and carbon,11–13 doping with metal oxide nanoparticles,14–16 and coating with conductive polymer17,18 to improve the electronic conductivity of the cathode and prevent dissolution of lithium polydisulfides. Especially, a porous carbon matrix has a large surface area to trap the lithium polysulfides.19,20 Notably, activated carbons from biomass materials have shown their potential in electrochemical energy systems due to their abundance, low cost, easy regeneration, and environmental friendliness.21,22
Highly porous activated carbons have been used in various fields owing to their unique characteristics; activated carbons with high micropore volume have been considered as the most suitable materials for gas storage or adsorption of volatile organic chemicals.23 A hierarchical structure consisting of multiple levels of pore sizes is beneficial for electrochemical capacitive ability because micropores (0.7 to 2 nm) enhance the capacitance by increasing the electrode/electrolyte interfacial area.24
Rice husk is an agricultural waste with a high yield of over 130 million metric tons globally per annum and is a promising carbon precursor for producing low cost activated carbon.25,26 The major components of rice husk are cellulose (38%), hemicelluloses (18%), and lignin (22%) which yield carbon when pyrolyzed under an inert atmosphere.27 Preliminary studies have shown that rice husk is also suitable for the production of activated carbon.28–30 George et al. studied the carbon from rice husk as an anode material for lithium-ion batteries and it exhibited promising electrochemical performances.31 Wang et al. obtained carbon fiber from rice husk using hydrothermal carbonization and applied the carbon fiber as an anode in a lithium-ion battery. It delivered superior rate capability retaining 137 mA h g−1 at a C-rate of 10.32 Teo et al. applied the activated carbon derived from rice husk with high surface area as a supercapacitor electrode and achieved good electrochemical performances.33 In addition, activated carbons from rice husk have been utilized as effective adsorbents for the removal of acid dyes from aqueous solution34 and adsorbents of Cr(VI) from synthetic solutions.35
To the best of our knowledge, little attention has been paid to the feasibility of using activated carbon from rice husk as a cathode material for Li–S batteries. Most recently, the activated carbon derived from rice husk has been used for Li–S batteries.36 However, there are two distinct differences between our study and the previous literature. The activated carbon was prepared by a physical activation process in the previous study which is composed of autoclave treatment of rice husk, carbonization in Ar atmosphere and SiO2 etching while we obtained the activated carbon by a chemical activation process. In this paper, we report an easy and scalable approach for synthesizing hierarchical porous activated carbon from rice husk for Li–S batteries. The micro/mesoporous activated carbon was obtained by carbonization of rice husk and chemical activation. We used zinc chloride (ZnCl2) as an activation agent because it has high activating ability and also restricts the formation of tar.29 The composite of activated carbon from rice husk/sulfur (AC-RH/S) was obtained by impregnating melted sulfur into the pore of AC-RH.
2. Experiment
Preparation of AC-RH
The rice husk used in this study was sourced from a local rice mill in Thai Binh province, Viet Nam. First, rice husk was cleaned several times using hot deionized (DI) water to remove impurities and was then dried at 120 °C in a convection oven for 24 h. The dried rice husk was pre-carbonized in a tube furnace at 350 °C for 2 h at a heating rate of 5 °C min−1 and the sample was then ground with ZnCl2 (w/w = 1![[thin space (1/6-em)]](https://www.rsc.org/images/entities/char_2009.gif) :
:![[thin space (1/6-em)]](https://www.rsc.org/images/entities/char_2009.gif) 1.5) in a mortar. The mixture was calcined at 600 °C for 3 h at a heating rate of 3 °C min−1 under N2 atmosphere in a tubular furnace. The obtained sample was washed with DI water, 1.0 M HNO3 aqueous solution, and 1.0 M HF aqueous solution to remove inorganic impurities and SiO2 content in the rice husk. Finally, the sample was washed with DI water and dried at 100 °C for 24 h in a vacuum oven.
1.5) in a mortar. The mixture was calcined at 600 °C for 3 h at a heating rate of 3 °C min−1 under N2 atmosphere in a tubular furnace. The obtained sample was washed with DI water, 1.0 M HNO3 aqueous solution, and 1.0 M HF aqueous solution to remove inorganic impurities and SiO2 content in the rice husk. Finally, the sample was washed with DI water and dried at 100 °C for 24 h in a vacuum oven.
Preparation of AC-RH/S
The AC-RH/S composites were prepared by following a conventional melting diffusion strategy. The AC-RH and sulfur with different ratios were ground together in a mortar, transferred to a tubular furnace and heated at 155 °C for 15 h with a heating rate of 3 °C min−1 under a N2 atmosphere. After cooling to room temperature, the AC-RH/S composites were obtained. The obtained AC-RH/S composites with a mass ratio of AC-RH![[thin space (1/6-em)]](https://www.rsc.org/images/entities/char_2009.gif) :
:![[thin space (1/6-em)]](https://www.rsc.org/images/entities/char_2009.gif) S = 1
S = 1![[thin space (1/6-em)]](https://www.rsc.org/images/entities/char_2009.gif) :
:![[thin space (1/6-em)]](https://www.rsc.org/images/entities/char_2009.gif) 0.5, 1
0.5, 1![[thin space (1/6-em)]](https://www.rsc.org/images/entities/char_2009.gif) :
:![[thin space (1/6-em)]](https://www.rsc.org/images/entities/char_2009.gif) 0.7, and 1
0.7, and 1![[thin space (1/6-em)]](https://www.rsc.org/images/entities/char_2009.gif) :
:![[thin space (1/6-em)]](https://www.rsc.org/images/entities/char_2009.gif) 1 were denoted as AC-RH/S1, AC-RH/S2, and AC-RH/S3, respectively.
1 were denoted as AC-RH/S1, AC-RH/S2, and AC-RH/S3, respectively.
Materials characterization
Thermogravimetric analysis (TGA) was carried out under N2 flow with a temperature ramp of 10 °C min−1 from 30 to 700 °C using a thermogravimetric analyzer (Netzsch, TG-209C). Nitrogen adsorption–desorption isotherms were measured at 77 K on a nitrogen sorption apparatus (Micromeritics, ASAP2020) and the surface areas were calculated using the Brunauer–Emmett–Teller (BET) method. X-ray diffraction (XRD) was conducted using the Rigaku D Max/2000 PC with Cu Kα radiation (λ = 0.15418 nm) in the 2θ angular range of 10 to 60° at a scanning rate of 4° min−1. The morphology of the particles was characterized by scanning electron microscopy (SEM, Hitachi, S4700 and SEM, JEOL JSM model 820) equipped with energy dispersive spectroscopy (EDS, OXFORD 7593 H). Raman spectra were measured using a 632.8 nm laser with a JY HR800 (Horiba) under ambient conditions with a laser spot size of approximately 1 μm.Electrochemical characterization
A cathode slurry was prepared by mixing the active material AC-RH/S (60 wt%), super P carbon black (conducting agent-Timcal) (20 wt%), and a polyvinylidene fluoride (PVDF, KF 1300, KUREHA) binder (20 wt%) with dispersion and dissolution of the mixture in N-methyl-2-pyrrolidene (NMP). To prepare the electrodes, the cathode slurry was coated on aluminum foil, left to dry at 45 °C for 24 h under nitrogen atmosphere and then roll-pressed prior to use. The loading level of sulfur was in the range of 0.31 and 0.79 mg cm−2 depending on the ratio of sulfur to activated carbon. For electrochemical measurements, the coin-type battery test cells (CR2032) were fabricated with the cathode prepared as above, lithium metal as an anode, and the microporous polyethylene membrane (Celgard 2400) as a separator. We used 20 μl mg−1 of S of a 1.0 M solution of lithium bis(trifluoromethanesulfone)imide (LiTFSI) in a mixture of 1,3-dioxolane (DOL) and dimethoxymethane (DME) with a volume ratio of 1![[thin space (1/6-em)]](https://www.rsc.org/images/entities/char_2009.gif) :
:![[thin space (1/6-em)]](https://www.rsc.org/images/entities/char_2009.gif) 1 including 0.1 M LiNiO3 as an electrolyte. All of the cells were prepared in an argon-filled glove box in which oxygen and moisture contents were maintained below 1.0 ppm.
1 including 0.1 M LiNiO3 as an electrolyte. All of the cells were prepared in an argon-filled glove box in which oxygen and moisture contents were maintained below 1.0 ppm.
Galvanostatic charge and discharge tests of the cells were performed on a cycler (PNE solution, KOREA) at different current densities in the potential range of 1.5–3.0 V vs. Li+/Li. The cyclic voltammetry (CV) measurements were conducted on the same instrument in the potential range of 1.5–3.0 V vs. Li+/Li at a scanning rate of 0.1 mV s−1 using an electrochemical analyzer (France, Bio-logic, VSP). The electrochemical impedance spectra were recorded by applying an AC voltage of 5 mV amplitude in the frequency range of 1 mHz to 500 μHz. All the electrochemical tests were performed at room temperature.
3. Result and discussion
We measured the element composition of the porous carbon with an organic elemental analyzer (Thermo Scientific FLASH EA-2000) and the result is given in Table 1. The carbon content in the activated carbon is generally dependent on the precursor type and the carbon content in the precursor. The carbon content in the activated carbon from rice husk is close to the typical value of common activated carbon and similar to that from corncob or capsica (80–82%). However, the oxygen content is very low compared to the other kinds of the activated carbon (C/O = 53.3). The high value of C/O may have a favorable effect on the performance of Li–S battery.| C (%) | H (%) | N (%) | O (%) | S (%) |
|---|---|---|---|---|
| 80.0 | 0.8 | 0.9 | 1.5 | 0.1 |
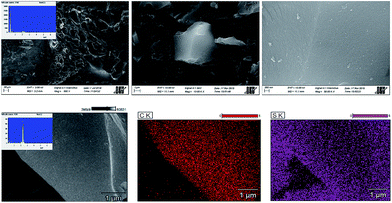
The morphologies of AC-RH and AC-RH/S1 were characterized by SEM and the results are shown in Fig. 1. As can be seen in Fig. 1(a), AC-RH has hollow tunnels over the entire surface; these tunnels are generated from the evolution of the decomposed gaseous products of volatiles upon activation. The pores have different sizes and shapes.
Many small particles less than 1 μm are non-uniformly agglomerated. The external surfaces of the activated carbons are covered in cavities which are quite irregular as a result of activation. Large quantities of flakes and slit-shaped micro/mesopores are also observed at the surface. It seems that the cavities resulted from the evaporation of ZnCl2, of which the boiling point is approximately 732 °C during carbonization.37 From the energy dispersive spectroscopy (EDS) results of the samples, silicon was not detected and we assumed that SiO2 was completely removed during the HF-etching process.
The N2 adsorption–desorption isotherms and pore size distribution of the samples are given in Fig. 2. The N2 adsorption–desorption curve provides quantitative information on the adsorption mechanism and porous structure of the carbonaceous materials.38 The isotherms typically show three steps with the increase in relative pressure. The first step is a steeply increasing region at low relative pressure of less than 0.05, which implies the adsorption or condensation in small micro/mesopores. The adsorption amount then slowly increases with relative pressure without any notable hysteresis, which demonstrates the progressive filling of large micro/mesopores. Finally, the adsorption amount increases abruptly close to the saturation pressure of nitrogen because of the active capillary condensation. The pore size distributions of the samples calculated using the density functional theory (DFT) model are presented in Fig. 2(b). The calculation was conducted assuming a slit-shaped geometry. AC-RH exhibited hierarchical pores that are composed of micropores (<5 nm), mesopores (5–50 nm), and macropores (>50 nm). We can see that most of the mesopores are filled with sulfur and the macropores reduce to mesopores upon impregnation of sulfur into the pores of AC-RH/S1 as shown in Fig. 2(b). The BET specific surface area of AC-RH is calculated to be 1199 m2 g−1 and the pore volume is 0.752 cm3 g−1, with an average pore width of 2.24 nm. The large specific surface area and pore volume offer advantages because they allow the electrolyte and Li-ions to easily access the surface of the electrode.39
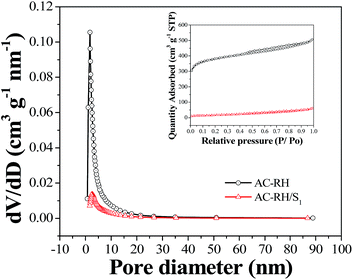 | ||
| Fig. 2 Pore structure of the activated carbon from rice husk and the composite. (a) N2 adsorption/desorption isotherms and (b) pore size distribution of AC-RH and AC-RH/S1 samples. | ||
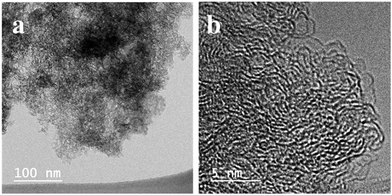
We carried out TEM analysis for the activated carbon. In Fig. 3, disordered hierarchical porous structure which contains mesopores and micropores could be observed. The large quantities of white spots between the disordered carbon layers suggests that abundant micropores and mesopores exist in the activated carbon from rice husk and these pores are expected give enough space where enough sulfur can be impregnated and dissolved polysulfides can be captured.
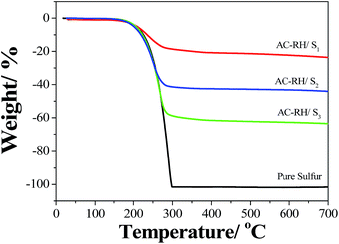
The thermal behaviors of pure sulfur and the AC-RH/S composites were examined to determine the amount of sulfur in the composite. TGA analysis was conducted for the samples from ambient temperature to 700 °C with a heating rate of 10 °C min−1 under nitrogen atmosphere. As shown in Fig. 4, a significant loss in weight between 180 °C and 300 °C was observed for elemental sulfur, which corresponds to the evaporation of sulfur. The AC-RH/S composites exhibited a weight loss from 205 °C to 300 °C, which corresponds to the removal of the sulfur remaining outside of the pores. The sulfur existing in the pores appears to evaporate gradually, even after 300 °C while no weight loss is observed with pure sulfur after 300 °C. The amounts of sulfur loaded in AC-RH/S1, AC-RH/S2, and AC-RH/S3 were estimated to be 23, 42, and 60 wt%, respectively. We observed that the sulfur in the composite evaporates at a slightly elevated temperature compared to the pure elemental sulfur. This is likely due to the strong interaction between carbon and sulfur, and good encapsulating capability of AC-RH.40
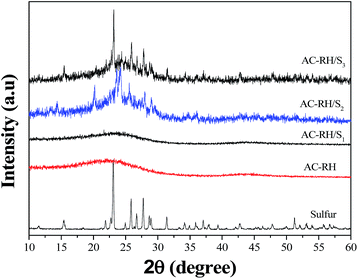
The powder X-ray diffraction (PXRD) patterns of the pure sulfur, AC-RH, and AC-RH/S samples are shown in Fig. 5. The diffraction peaks of graphitic carbon were barely recognizable in the pattern of the AC-RH sample, which indicates that the activated carbon from rice husk is amorphous. The characteristic peaks of element sulfur were not detected for AC-RH/S1. This indicates that sulfur was successfully impregnated into the pores of AC-RH. The absence of characteristic peaks for crystalline sulfur in the XRD pattern indicates a very low degree of crystallization in the AC-RH/S composite. This suggests that the impregnated sulfur is amorphous or that the sulfur particles trapped in the activated carbon are difficult to crystallize.12 Meanwhile, the diffraction peaks of sulfur were observed for the AC-RH/S2 and AC-RH/S3, indicating that these samples include the stable crystalline phase of sulfur with an orthorhombic structure outside of the pores.41
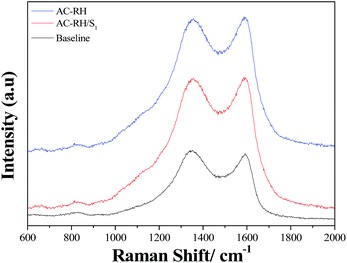
The Raman spectra of AC-RH exhibit characteristic G- and D-bands as shown in Fig. 6. The G-band of AC-RH (ca. 1580 cm−1) reveals the presence of C![[double bond, length as m-dash]](https://www.rsc.org/images/entities/char_e001.gif) C stretching vibrations (sp2 hybridization), while the D-band (ca. 1350 cm−1) is attributed to the breathing mode of six-member rings. The Raman intensity and wavenumber of both the D- and G-bands are unchanged in the spectra of the AC-RH/S composites, indicating that the carbon matrix and the impregnated sulfur do not interact in the composite materials.42 The intensity ratio (ID/IG) is essentially a measure for the zone edges of the clusters, which depend on cluster sizes and distributions.
C stretching vibrations (sp2 hybridization), while the D-band (ca. 1350 cm−1) is attributed to the breathing mode of six-member rings. The Raman intensity and wavenumber of both the D- and G-bands are unchanged in the spectra of the AC-RH/S composites, indicating that the carbon matrix and the impregnated sulfur do not interact in the composite materials.42 The intensity ratio (ID/IG) is essentially a measure for the zone edges of the clusters, which depend on cluster sizes and distributions.
In this study, the intensity ratios (ID/IG) for AC-RH and AC-RH/S are in the range of 1.00 ± 0.05. This result indicates a high number of structural defects in AC-RH, which could be related to the activation process with ZnCl2.43
The first charge and discharge curves of the AC-RH/S composite electrodes with different amounts of sulfur loading are given in Fig. 7. All of the discharge curves of the AC-RH/S composite electrodes have two voltage plateau regions which correspond to the multistep reduction of sulfur during the discharge process. The upper plateau at approximately 2.3 V represents the transformation of sulfur to higher-order lithium polysulfides (Li2Sn, 4 ≤ n ≤ 8). Meanwhile, the lower plateau at approximately 2.1 V corresponds to the transformation of the higher-order lithium polysulfides to the lower-order lithium polysulfides (Li2Sn, n < 4), which can precipitate the solid products of Li2S2 and Li2S owing to their low solubility in the electrolyte.9,41
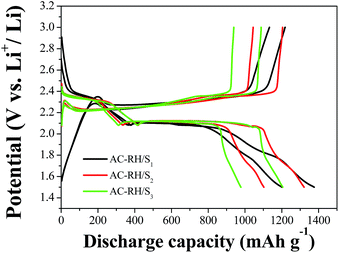 | ||
| Fig. 7 Initial charge/discharge profiles of AC-RH/S at a current density of 167.5 mA g−1 in the voltage range of from 1.5 to 3.0 V. | ||
Upper plateau reaction:
| nS + 2Li+ + 2e− → Li2S(n−1) + S (4 ≤ n ≤ 8) | (1) |
Lower plateau reaction:
| Li2Sn + 2(n − 1)Li+ + 2(n − 1)e− → nLi2S (n < 4) | (2) |
The first discharge capacities of AC-RH/Si (i = 1, 2, and 3) are 1376, 1321, and 1205 mA h g−1, respectively. The discharge capacity of the AC-RH/S1 sample shows 1196 mA h g−1 in the second cycle with a much higher capacity retention rate than AC-RH/S2 (1102 mA h g−1) and AC-RH/S3 (977 mA h g−1). This indicates that the sulfur content of 23 wt% gives the highest sulfur utilization.
The cycling performances of the cells of the AC-RH/S composites were further investigated and the results are shown in Fig. 8. The cycling performance was measured at a rate of 0.2C in the potential range of from 1.5 to 3.0 V. As clearly shown in the Fig. 8, the discharge capacity drastically decays at initial stage upon cycling for all of the samples. The main reason for the decay is the capacity loss derived from dissolution of polydisulfides into the electrolyte and decomposition of LiNO3 in the electrolyte under 1.6 V especially in the early stage.
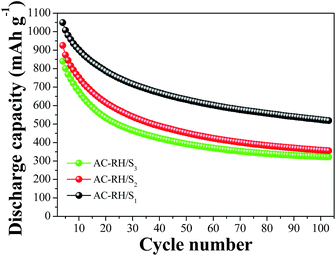 | ||
| Fig. 8 Cycling performances of AC-RH/S samples at 335 mA g−1 in the voltage range of from 1.5 to 3.0 V. | ||
The decay appears to be more severe with increasing sulfur content because the amount of sulfur existing on the surface of the activated carbon (not in the pore) which is vulnerable to dissolution increases with increasing total sulfur content. The AC-RH/S1 sample exhibits better cycling performance (518 mA h g−1 after 100 cycles: capacity retention, 49%) than AC-RH/S2 (355 mA h g−1 after 100 cycles: capacity retention, 38%) and AC-RH/S3 (321 mA h g−1 after 100 cycles: capacity retention 38%). The rapid capacity decay in the first few cycles might be caused by the volumetric expansion and re-distribution of the active sulfur during the initial lithiation process.7
An increase of the carbon content in the AC-RH/S composite electrodes leads to higher specific discharge capacities because of the facilitated electrochemical reactions of sulfur with lithium due to the high electronic conductivities of the electrodes.44
Fig. 9(a) presents the rate capability of the AC-RH/S composites at various current densities from 0.168 to 3.35 A g−1 in the potential range of from 1.5 V to 3.0 V (vs. Li+/Li) at ambient temperature.
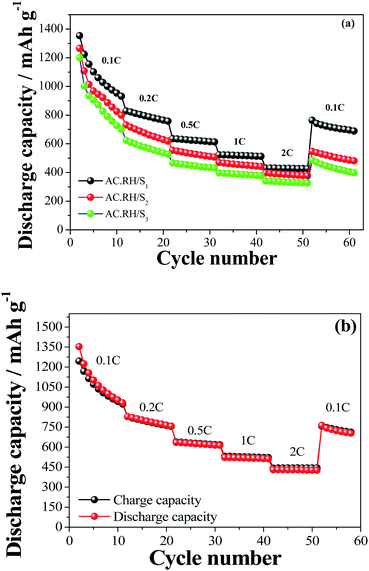 | ||
| Fig. 9 (a) Rate capability performance of AC-RH/S samples, (b) charge/discharge capacity of AC-RH/S1 sample at different C-rates in a voltage range of from 1.5 to 3.0 V. | ||
After 10 cycles at a current density of 0.168 A g−1, the AC-RH/Si (i = 1, 2, and 3) cathode showed a reversible capacity of 931, 799, and 700 mA h g−1, respectively. The discharge capacity decreased gradually, exhibiting higher overpotential with increasing current density.
At high current density of 3.35 A g−1 (2 C-rate) after 50 cycles, AC-RH/Si (i = 1, 2, and 3) cathode maintained the reversible capacity of 426, 377, and 326 mA h g−1, respectively. AC-RH/S1 showed a superior rate capability compared to that of the other samples. Returning current density to 0.1C after cycling, the specific capacity of AC-RH/Si (i = 1, 2, and 3) recovered to 763, 547, and 485 mA h g−1, respectively. This indicates good cycling stability of AC-RH/S at various current densities. Specifically, the coulombic efficiency values approached 100% after 2–3 initial cycles (Fig. 8(b)), indicating a negligible loss of active material due to the dissolution and shuttling of lithium polysulfides during cycling.
In addition, other biomass-derived carbons that have been considered as a cathode material for Li–S batteries are summarized in Table 2. Rice husk-derived activated carbon has advantages over other biomass-derived carbons. (1) The hierarchical porous structure of the activated carbon plays the role of an excellent electrode material; micropores are able to store short-chain sulfur molecules generated from the breakup of the S8 crown-like structure, and the mesoporous structure facilitates Li+ mobility and thus enhances the rate capability of the composite. (2) The high surface area larger than 1000 m2 g−1 provides enough contact area between the sulfur and carbon matrix. Especially, the chemically-activated carbon from rice husk has larger specific surface area than that from physical activation process. The higher specific capacity of the chemically activated carbon is believed to be due to the larger specific surface area than the physically-activated carbon. (3) Chemical activation at moderate temperature generally avoids the serious deterioration in the electronic conductivity of AC-RH, and gives smaller and more uniform pore size distribution than physical activation at high temperature. (4) The earth-abundant rice husk could be a sustainable resource for large-scale production of activated carbon.
| Biomass-derived carbon | Properties | ||||||
|---|---|---|---|---|---|---|---|
| SSA/m2 g−1 | Sulfur loading/mg cm−2 | Initial discharge capacity/mA h g−1 | Sulfur utilization/wt% | Sulfur content/wt% | Specific discharge capacity/mA h g−1 – C rate | Ref. | |
| Silk cocoon | 3243 | 0.2 | 1443 | 48 | 66.5 | 886 – 0.5C (80 cycles) | 24 |
| Corn cob | 1198 | — | 1600 | 44 | 69 | 554 – 0.1C (50 cycles) | 40 |
| Peapod like | 977 | — | 1106 | 66 | 84 | 350 – 0.2C (50 cycles) | 53 |
| Porous carbon from pig bone | 2157 | — | 1265 | 76 | — | 643 – 0.2C (50 cycles) | 54 |
| Porous carbon from rice husks | 655 | 1.0–2.1 | 1032 | — | 56 | 586 – 1C (200 cycles) | 36 |
| Luffa sponge (interlayer), luffa sponge (electrode) | 3211 | 1.5 | 1544.2 (0.2C), 475 (0.2C) | — | 70 | 738.1 – 1C (250 cycles), 380 – 1C (200 cycles) | 55 |
| Sisal-derived activated carbons | 818 | — | 950 | — | 60 | 56 | |
| Graphene/SWCNT hybrids | 513 | — | 1121 (0.5C) | — | 77 | 877 – 1C (150 cycles) | 57 |
| Commercial activated carbon (YP17D) | 1488 | — | 1400 | 76 | — | 450 – 0.2C (100 cycles) | 58 |
| Commercial activated carbon (BP20) | 1696 | — | 1364 (0.25C) | — | 62.15 | 493 – 2C (50 cycles), 714 – 1C (50 cycles) | 59 |
| Graphene nanosheets | 2313 | — | 1379 (0.2C) | — | 67 | 685 – 1C (100 cycles) | 60 |
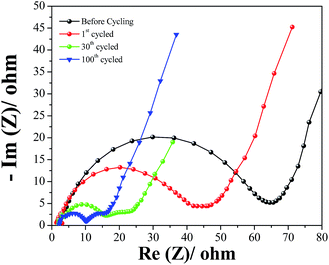
In order to investigate the reaction mechanism of the AC-RH/S composite in Li–S cell, electrochemical impedance spectra (EIS) were measured for the AC-RH/S1 electrode at different states of charge and the results are given in Fig. 10. The ohmic resistance (Ro) from the high frequency intercept on the real axis is composed of the resistance of the electrolyte, the intrinsic resistance of the active materials, and the contact resistance between the electrode and current collector.45 As the upper plateau reaction (reduction of sulfur) proceeds, sulfur transforms to soluble high-order lithium polysulfide, and thus the concentration of the dissolved lithium polysulfide in the electrolyte increases. The increased concentration of the dissolved lithium polysulfide in the electrolyte strongly affects the viscosity of the electrolyte, resulting in a decrease of the electrolyte conductivity.47–49
As shown in the figure, the EIS of the AC-RH/S1 sample is composed of a depressed semicircle in the high frequency region and a short inclined line (Warburg impedance) in the low frequency region before charge/discharge. The semicircle corresponds to the charge transfer resistance (Rct) of the electrode originating from the interactions at the interface between the electrode and electrolyte. The formation of a resistive film on the electrode surface in a non-aqueous organic solution has been reported to be a common phenomenon.46 The Warburg impedance (Wo) is associated with the lithium ion diffusion within the cathode. After 100 cycles, the EIS exhibits two depressed semicircles followed by a straight line at fully charged state.
The semicircle in the high frequency region is attributed to the resistance of the solid electrolyte interface (SEI) film and the semicircle in the middle frequency range corresponds to the charge transfer resistance (Rct). We can see the charge transfer resistance of the AC-RH/S electrode is low in the spectra, which represents the fast transfer of electrons at the interface between the electrode and electrolyte.
A cyclic voltammogram (CV) of the AC-RH/S1 composite is presented in Fig. 11. The two cathodic peaks indicate that the electrochemical reduction of elemental sulfur (S8) occurs in two stages. The first peak at 2.4 V (vs. Li+/Li) in the CV curves corresponds to the reduction of elemental sulfur to lithium polysulfide anions (Li2Sn, n = 4–8). The second peak at 2.0 V is attributed to the strong reduction of polysulfide ions to insoluble Li2S2 and Li2S.48 The oxidation process in the Li–S cell occurs in one stage. The narrow anodic peak around 2.35 V is mainly attributed to the oxidation of Li2Sn (n > 2) into polysulfides.50–52 Specifically, only slight changes for the CV peak positions or peak current from the 2nd cycle were observed, which demonstrates the electrochemical reversibility and excellent stability of the AC-RH/S composite cathode. From these results, we conclude that the hierarchically porous activated carbon structure is quite effective in preventing the loss of lithium-polysulfide in the electrolyte and in maintaining high utilization of sulfur in the redox reactions.50
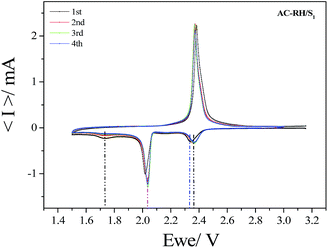 | ||
| Fig. 11 Cyclic voltammetry curves of AC-RH/S1 electrode during the initial 4 cycles at a scan rate of 0.1 mV s−1 in the voltage range of from 1.5 to 3.0 V. | ||
4. Conclusions
We proposed a simple method to synthesize a composite of sulfur and carbon with a hierarchical micro/mesoporous structure from rice husk. The hierarchical porous carbon (AC-RH) was prepared via a simple carbonization process in combination with a chemical activation technique using ZnCl2. The AC-RH almost showed an amorphous phase and exhibited a high surface area (SBET) of 1199 m2 g−1. The AC-RH/S composites were prepared by impregnating melted sulfur into the pores of the AC-RH. The composites were evaluated as cathode materials for a lithium–sulfur battery and showed superior electrochemical performances including high discharge capacity, good rate capability, and good cycling stability. We believe that the good performances are attributed to the hierarchical porous structure of the composites which enables sulfur to be effectively stored in the micropores and facilitates Li+ mobility through the mesopores while providing a reasonable surface area for electrochemical reaction. We expect that rice husk can be a good candidate for the carbon source as a cathode material for Li–S batteries considering its good cell performance and abundance.Acknowledgements
This work was supported by the World Class 300 Project (R&D) (S2367787) of the SMBA (Korea) and the Leading Human Resource Training Program of Regional Neo industry through the National Research Foundation of Korea (NRF) funded by the Ministry of Science, ICT and future Planning (NRF-2016H1D5A1910545).Notes and references
- L. Ma, K. E. Hendrickson, S. Wei and L. A. Archer, Nano Today, 2015, 10, 315–338 CrossRef CAS.
- Y. S. Su, Y. Fu, B. Guo, S. Dai and A. Manthiram, Chem.–Eur. J., 2013, 19, 8621–8626 CrossRef CAS PubMed.
- J. Kim, D. J. Lee, H. G. Jung, Y. K. Sun, J. Hassoun and B. Scrosati, Adv. Funct. Mater., 2013, 23, 1076–1080 CrossRef CAS.
- A. Manthiram, Y. Fu, S. Chung, C. Zu and Y. Su, Chem. Rev., 2014, 114, 11751–11787 CrossRef CAS PubMed.
- A. Manthiram, S.-H. Chung and C. Zu, Adv. Mater., 2015, 27, 1980–2006 CrossRef CAS PubMed.
- H. Chen, C. Wang, W. Dong, W. Lu, Z. Du and L. Chen, Nano Lett., 2015, 15, 798–802 Search PubMed.
- Y. X. Yin, S. Xin, Y. G. Guo and L. J. Wan, Angew. Chem., Int. Ed., 2013, 52, 13186–13200 CrossRef CAS PubMed.
- F. Wu, J. Qian, R. Chen, J. Lu and L. Li, ACS Appl. Mater. Interfaces, 2014, 6, 15542–15549 CAS.
- R. Xu, I. Belharouak, X. Zhang, R. Chamoun, C. Yu, Y. Ren, A. Nie, R. Shahbazian-yassar, J. Lu, J. C. M. Li and K. Amine, ACS Appl. Mater. Interfaces, 2014, 6, 21938–21945 CAS.
- S. Wu, R. Ge, M. Lu, R. Xu and Z. Zhang, Nano Energy, 2015, 15, 379–405 CrossRef CAS.
- J.-J. Kim, H. S. Kim, J. Ahn, K. J. Lee, W. C. Yoo and Y.-E. Sung, J. Power Sources, 2016, 306, 617–622 CrossRef CAS.
- K. A. See, Y. Jun, J. K. Sprafke, F. Wudl, G. D. Stucky and R. Seshadri, ACS Appl. Mater. Interfaces, 2014, 6, 10908–10916 CAS.
- J. Schuster, G. He, B. Mandlmeier, T. Yim, K. T. Lee, T. Bein and L. F. Nazar, Angew. Chem., Int. Ed., 2012, 51, 3591–3595 CrossRef CAS PubMed.
- Z. Li, J. Zhang and X. W. Lou, Angew. Chem., Int. Ed., 2015, 54, 12886–12890 CrossRef CAS PubMed.
- R. Ponraj, A. G. Kannan, J. H. Ahn and D. W. Kim, ACS Appl. Mater. Interfaces, 2016, 8, 4000–4006 CAS.
- Z. Zhang, Q. Li, S. Jiang, K. Zhang, Y. Lai and J. Li, Chem.–Eur. J., 2015, 21, 1343–1349 CrossRef CAS PubMed.
- S. Lim, R. Lilly Thankamony, T. Yim, H. Chu, Y.-J. Kim, J. Mun and T.-H. Kim, ACS Appl. Mater. Interfaces, 2015, 7, 1401–1405 CAS.
- H. Chen, W. Dong, J. Ge, C. Wang and X. Wu, Sci. Rep., 2013, 3, 1910 Search PubMed.
- H. Sohn, M. L. Gordin, T. Xu, S. Chen, D. Lv, J. Song, A. Manivannan and D. Wang, ACS Appl. Mater. Interfaces, 2014, 6, 7596–7606 CAS.
- J. Wang, H. L. Xin and D. Wang, Part. Part. Syst. Charact., 2014, 31, 515–539 CrossRef CAS.
- W. Gu and G. Yushin, Wiley Interdiscip. Rev.: Energy Environ., 2014, 3, 424–473 CrossRef CAS.
- J. Zhang, J. Xiang, Z. Dong, Y. Liu, Y. Wu, C. Xu and G. Du, Electrochim. Acta, 2014, 116, 146–151 CrossRef CAS.
- A. Jain, R. Balasubramanian and M. P. Srinivasan, Chem. Eng. J., 2016, 283, 789–805 CrossRef CAS.
- B. Zhang, M. Xiao, J. S. Wang, M. D. Han, S. Song, G. Chen and Y. Meng, ACS Appl. Mater. Interfaces, 2014, 6, 13174–13182 CAS.
- E.-P. Ng, G. K. Lim, G.-L. Khoo, K.-H. Tan, B. S. Ooi, F. Adam, T. C. Ling and K.-L. Wong, Mater. Chem. Phys., 2015, 155, 30–35 CrossRef CAS.
- E.-P. Ng, H. Awala, K.-H. Tan, F. Adam, R. Retoux and S. Mintova, Microporous Mesoporous Mater., 2015, 204, 204–209 CrossRef CAS.
- S. Mor, K. Chhoden and R. Khaiwal, J. Cleaner Prod., 2016, 129, 673–680 CrossRef CAS.
- D. Kalderis, S. Bethanis, P. Paraskeva and E. Diamadopoulos, Bioresour. Technol., 2008, 99, 6809–6816 CrossRef CAS PubMed.
- N. Yalçın and V. Sevinç, Carbon, 2000, 38, 1943–1945 CrossRef.
- T.-H. Liou and S.-J. Wu, J. Hazard. Mater., 2009, 171, 693–703 CrossRef CAS PubMed.
- G. T.-K. Fey and C.-L. Chen, J. Power Sources, 2001, 97–98, 47–51 CrossRef CAS.
- L. Wang, Z. Schnepp and M. M. Titirici, J. Mater. Chem. A, 2013, 1, 5269–5273 CAS.
- E. Y. L. Teo, L. Muniandy, E.-P. Ng, F. Adam, A. R. Mohamed, R. Jose and K. F. Chong, Electrochim. Acta, 2016, 192, 110–119 CrossRef CAS.
- P. K. Malik, Dyes Pigm., 2003, 56, 239–249 CrossRef CAS.
- N. R. Bishnoi, M. Bajaj, N. Sharma and A. Gupta, Bioresour. Technol., 2004, 91, 305–307 CrossRef CAS PubMed.
- M. K. Rybarczyk, H.-J. Peng, C. Tang, M. Lieder, Q. Zhang and M.-M. Titirici, Green Chem., 2016, 18, 5169–5179 RSC.
- F. Caturla, M. Molina-Sabio and F. Rodríguez-Reinoso, Carbon, 1991, 29, 999–1007 CrossRef CAS.
- K. V. Kumar, C. Valenzuela-Calahorro, J. M. Juarez, M. Molina-Sabio, J. Silvestre-Albero and F. Rodriguez-Reinoso, Chem. Eng. J., 2010, 162, 424–429 CrossRef CAS.
- J.-G. Wang, K. Xie and B. Wei, Nano Energy, 2015, 15, 413–444 CrossRef CAS.
- J. Guo, J. Zhang, F. Jiang, S. Zhao, Q. Su and G. Du, Electrochim. Acta, 2015, 176, 853–860 CrossRef CAS.
- T. Xu, J. Song, M. L. Gordin, H. Sohn, Z. Yu, S. Chen and D. Wang, ACS Appl. Mater. Interfaces, 2013, 5, 11335–11362 Search PubMed.
- T. X. Shang, R. Q. Ren, Y. M. Zhu and X. J. Jin, Electrochim. Acta, 2015, 163, 32–40 CrossRef CAS.
- Z. Lyu, D. Xu, L. Yang, R. Che, R. Feng, J. Zhao, Y. Li, Q. Wu, X. Wang and Z. Hu, Nano Energy, 2015, 12, 657–665 CrossRef CAS.
- E. Peled, D. Golodnitsky and G. Ardel, J. Electrochem. Soc., 1997, 144, L208–L210 CrossRef CAS.
- Y.-J. Choi, Y.-D. Chung, C.-Y. Baek, K.-W. Kim, H.-J. Ahn and J.-H. Ahn, J. Power Sources, 2008, 184, 548–552 CrossRef CAS.
- Y. Li, H. Zhan, S. Liu, K. Huang and Y. Zhou, J. Power Sources, 2010, 195, 2945–2949 CrossRef CAS.
- W. Ahn, K.-B. Kim, K.-N. Jung, K.-H. Shin and C.-S. Jin, J. Power Sources, 2012, 202, 394–399 CrossRef CAS.
- C. Li and L. Yin, Part. Part. Syst. Charact., 2015, 756–763 CrossRef CAS.
- H.-L. Wu, L. A. Huff and A. A. Gewirth, ACS Appl. Mater. Interfaces, 2015, 7, 1709–1719 CAS.
- G. Zhou, Y. Zhao, C. Zu and A. Manthiram, Nano Energy, 2015, 12, 240–249 CrossRef CAS.
- D. Li, F. Han, S. Wang, F. Cheng, Q. Sun and W. C. Li, ACS Appl. Mater. Interfaces, 2013, 5, 2208–2213 CAS.
- S. Wei, H. Zhang, Y. Huang, W. Wang, Y. Xia and Z. Yu, Energy Environ. Sci., 2011, 4, 736–740 CAS.
- H. Yao, G. Zheng, W. Li, M. T. McDowell, Z. Seh, N. Liu, Z. Lu and Y. Cui, Nano Lett., 2013, 13, 3385–3390 CrossRef CAS PubMed.
- S. Zhao, C. Li, W. Wang, H. Zhang, M. Gao, X. Xiong, A. Wang, K. Yuan, Y. Huang and F. Wang, J. Mater. Chem. A, 2013, 1, 3334–3339 CAS.
- J. Yang, F. Chen, C. Li, T. Bai, B. Long and X. Zhou, J. Mater. Chem. A, 2016, 4, 14324–14333 CAS.
- M. Raja, N. Angulakshmi and A. M. Stephan, RSC Adv., 2016, 6, 13772–13779 RSC.
- H. J. Peng, J. Q. Huang, M. Q. Zhao, Q. Zhang, X. B. Cheng, X. Y. Liu, W. Z. Qian and F. Wei, Adv. Funct. Mater., 2014, 24, 2772–2781 CrossRef CAS.
- J. T. Lee, Y. Zhao, H. Kim, W. Il Cho and G. Yushin, J. Power Sources, 2014, 248, 752–761 CrossRef CAS.
- H. S. Ryu, J. W. Park, J. Park, J.-P. Ahn, K.-W. Kim, J.-H. Ahn, T.-H. Nam, G. Wang and H.-J. Ahn, J. Mater. Chem. A, 2013, 1, 1573–1578 CAS.
- B. Ding, C. Yuan, L. Shen, G. Xu, P. Nie, Q. Lai and X. Zhang, J. Mater. Chem. A, 2013, 1, 1096–1101 CAS.
| This journal is © The Royal Society of Chemistry 2017 |

