 Open Access Article
Creative Commons Attribution 3.0 Unported Licence
Effect of graphene incorporation in carbon nanofiber decorated with TiO2 for photoanode applications†
Hoik Leea,
Tomoki Nagaishia,
Duy-Nam Phana,
Myungwoong Kimb,
Ke-Qin Zhangc,
Kai Wei*c and
Ick Soo Kim*a
aNano Fusion Technology Research Lab, Division of Frontier Fibers, Institute for Fiber Engineering (IFES), Interdisciplinary Cluster for Cutting Edge Research (ICCER), Shinshu University, 3-15-1, Tokida, Ueda, Nagano 386-8567, Japan. E-mail: kim@shinhsu-u.ac.jp
bDepartment of Chemistry, Inha University, Incheon 22212, Korea
cNational Engineering Laboratory for Modern Silk (NESLab), College of Textile and Clothing Engineering, Soochow University, Suzhou, 215123, China. E-mail: sudaweikai@hotmail.com
First published on 20th January 2017
Abstract
The photovoltaic performance of dye-sensitized solar cells (DSSCs) using a photoanode fabricated with graphene incorporated carbon nanofibers with a TiO2 layer on their surfaces is reported. The composite nanofibers were prepared through a process consisting of electrospinning and sol–gel process. The distribution of TiO2 particles on the surface of the graphene-incorporated carbon nanofiber was characterized by scanning electron microscopy (SEM), and transmission electron microscopy (TEM). From the microscopic studies, we found that graphene plays a significant role to form TiO2 particles on carbonaceous materials. Further studies on chemical composition using X-ray photoelectron spectroscopy reveal that different oxidation states of Ti in the synthesized titanium oxide were achieved by incorporating graphene in the nanofibers. Furthermore, TiO2 synthetic conditions in the sol–gel process largely affected photovoltaic performance, particularly short circuit current; acidic conditions for the sol–gel process were more effective compared to neutral conditions. The incorporated graphene facilitates conducting charge carriers in TiO2 by coordination with carbon, and increasing the adsorption of dye molecules owing to homogeneous distribution of TiO2 along the nanofibers. This study further highlights the advantages of hybridizing different materials with 1D nanofiber geometry, offering a promising route to improving the resulting efficiency in light harvesting applications.
Introduction
Dye sensitized solar cells (DSSC) have attracted considerable attention as important alternatives to conventional silicon-based solar cells due to a simple fabrication process, high energy conversion efficiency and low cost.1–7 A DSSC is based on the cooperative interplay of subsystems such as a sensitized photoanode, electron mediators containing a redox couple (I−/I3−), and a catalytic counter electrode.8 When dye molecules adsorbed onto a TiO2 surface are exposed to sunlight, photoelectrons are generated and injected into the photoanode; subsequently, the electrons move to the counter electrode through an external circuit. The photoanode acts as the scaffold for dye molecules and the transporter for photoinjected electron in DSSC device. A thin layer transparent conducting oxide on a glass substrate is a core component, and it is typically coated with a porous film of semiconductor materials such as TiO2, ZnO and SnO2.9 Especially, anatase–TiO2 nanoparticles have been widely applied in DSSC due to their excellent photocatalytic and photovoltaic performances compared with other inorganic semiconductors due to their wide band gap, non-toxicity, environmental compatibility, high chemical stability and low price.10 However, there are many grain boundaries in these TiO2 nanoparticles, leading to faster charge recombination at the TiO2/electrolyte interface.11,12 Different strategies have been proposed to increase charge collection; particularly low dimensional nanostructures have attracted attentions as a promising platform.13,14 Incorporating low dimensional carbon nanostructures such as carbon nanotubes (CNTs) and graphene sheets into semiconductor electrodes was proposed to improve the charge collection and photovoltaic performance of DSSC.15,16 They are suitable for the combination with TiO2 thanks to electron bands aligning properly with the bands of TiO2 and the F-doped tin oxide (FTO) conducting glass, offering a more efficient pathway for collection and transport of photogenerated electrons.16,17 Also, the photoanode should provide a large surface area for dye loading, and the ability to transfer excited electrons from sensitizer to external circuit effectively. In addition, the use of flexible materials for photoanode, sensitizers, electrolytes and substrates is also an important issue for further applications of DSSC such as portable and wearable electronic devices.18–20 Typically, TiO2 mesoporous films for photoanode are prepared at high temperature (∼500 °C) where it gives an effective interparticular connection with the removal of organic additives in the TiO2 paste. However, plastic substrate cannot physically maintain such a high temperature annealing. One of possible ways to address this issue is using flexible nanofibers as a substrate, e.g. carbon nanofiber (CNF), one of fascinating one dimensional (1D) materials, showing outstanding properties for use as a template for supporting TiO2 as photoanode, for example, high accessible surface area, superior electronic conductivity and excellent mechanical strength, to define TiO2 layer on the nanofiber substrate.21,22 Also, the use of a 1D carbon based nanostructure photoanode offers a route to provide high surface area, effective pathway of photogenerated electrons and high flexibility.23,24 Several reports have demonstrated that carbon nanofibers efficiently capture and transport photogenerated electrons through long charge carrier pathway.25 Additionally, considering the efficient electron transfer characteristics of carbon nanofiber, its combination with TiO2 is expected to be useful to avoid recombination of electrons and holes. Furthermore, due to outstanding physical and electronic properties, graphene can be used as an efficient nanofiller to enhance mechanical strength and conductivity in composite materials.26–31 Also, graphene potentially provides additional conducting pathways of electrons, reduces recombination rate of e−/h+, and increases dye absorption area, hence ultimately improving the efficiency of DSSC.Herein, we report the fabrication of graphene-incorporated carbon nanofiber decorated with TiO2 as a flexible photoanode, which shows enhanced conductivity and efficiency in DSSC device. Though DSSC devices fabricated with graphene/TiO2 composite have been reported in literature,32 to the best of our knowledge, DSSC devices achieved using graphene/CNF composite system have not been demonstrated yet. In fabrication process, graphene plays a significant role to synthesize TiO2 on the surface of carbon nanofibers. Consequently, optimization of processing parameters in proposed fabrication process affected final performance of DSSC devices. This work highlights the potential of the conductive polymer based nanofibrous materials that can be combined with functional inorganic materials to create photoanode for new types of photo-electrochemical devices.
Experimental
Materials
Polyacrylonitrile (PAN, Mw = 150 kg mol−1) was purchased from Sigma-Aldrich. N,N-Dimethylformamide (99.5%, DMF), sulfuric acid, nitric acid, isopropanol, ethanol (99.5%), acetone (99.5%), sodium hydroxide (97%, NaOH), acetonitrile (99.5%), iodine (99%), titanium tetraisopropoxide (TTIT, 99.7%) and hydrochloric acid (HCl) were obtained from Wako Pure Chemical Industries, Ltd. (Japan). Graphene samples were purchased from Sigma-Aldrich (USA). Di-tetrabutylammonium cis-bis(isothiocyanato)bis(2,2′-bipyridyl-4,4′-dicarboxylato)ruthenium(II) (N719 dye, 95%), 1-methy-3-propylimidazolium iodide (98%, PMII), lithium iodide (99%), 4-tert-butyl pyridine (96%, TBP) (used as an electrolyte) and TiO2 paste were obtained from Sigma-Aldrich (USA). All chemicals were used without further purification unless otherwise noted.Preparation of nanofibers
Graphene powder was dispersed in mixture of H2SO4 and HNO3 (3![[thin space (1/6-em)]](https://www.rsc.org/images/entities/char_2009.gif) :
:![[thin space (1/6-em)]](https://www.rsc.org/images/entities/char_2009.gif) 1 v/v) with sonication for 3 h.33,34 The solution was neutralized with aqueous NaOH solution, followed by filtration and drying. Carbon nanofiber (CNF) and graphene-incorporated carbon nanofiber (GCNF) were synthesized using PAN polymer sample. PAN was mixed with DMF and mechanically stirred at 65 °C for 2 h to make 10 wt% concentration. For GCNF, oxidized graphene (GO) powder was dispersed in PAN solution (3 wt% to the amount of PAN). Prepared solutions were subjected to electrospinning process; a high-voltage power supply (Har-100*12, Matsusada Co., Tokyo, Japan) capable of generating voltage up to 100 kV was used as the source of the electric field.35 The polymer solutions were supplied through a plastic syringe to a capillary tip with an inner diameter of 0.6 mm. A cooper wire connected to a positive electrode was attached to an ejection needle, and a negative electrode was linked to a metallic collector. A supplied voltage was 10 kV, and the tip-to-collector distance was 12 cm in a room-temperature environment with the humidity of 30–40% for all electrospinning process. Resulting PAN or GO-incorporated PAN (GPAN) nanofibers were stabilized by annealing at 300 °C for 2 h under nitrogen atmosphere (heating rate: 1 °C min−1) using an electric furnace (NHV-1515D, Motoyama, Co.). To prevent thermal shrinking, nanofiber sheets were tied up with alumina frame at the end of sheet. Stabilized nanofibers were further subjected to a carbonization process at 900 °C for 1 h under nitrogen atmosphere (heating rate: 5 °C min−1) using electric heat-treating furnace (AMF-9P-III THV, Asahi Rika Seisakujo), resulting in CNF and GCNF.
1 v/v) with sonication for 3 h.33,34 The solution was neutralized with aqueous NaOH solution, followed by filtration and drying. Carbon nanofiber (CNF) and graphene-incorporated carbon nanofiber (GCNF) were synthesized using PAN polymer sample. PAN was mixed with DMF and mechanically stirred at 65 °C for 2 h to make 10 wt% concentration. For GCNF, oxidized graphene (GO) powder was dispersed in PAN solution (3 wt% to the amount of PAN). Prepared solutions were subjected to electrospinning process; a high-voltage power supply (Har-100*12, Matsusada Co., Tokyo, Japan) capable of generating voltage up to 100 kV was used as the source of the electric field.35 The polymer solutions were supplied through a plastic syringe to a capillary tip with an inner diameter of 0.6 mm. A cooper wire connected to a positive electrode was attached to an ejection needle, and a negative electrode was linked to a metallic collector. A supplied voltage was 10 kV, and the tip-to-collector distance was 12 cm in a room-temperature environment with the humidity of 30–40% for all electrospinning process. Resulting PAN or GO-incorporated PAN (GPAN) nanofibers were stabilized by annealing at 300 °C for 2 h under nitrogen atmosphere (heating rate: 1 °C min−1) using an electric furnace (NHV-1515D, Motoyama, Co.). To prevent thermal shrinking, nanofiber sheets were tied up with alumina frame at the end of sheet. Stabilized nanofibers were further subjected to a carbonization process at 900 °C for 1 h under nitrogen atmosphere (heating rate: 5 °C min−1) using electric heat-treating furnace (AMF-9P-III THV, Asahi Rika Seisakujo), resulting in CNF and GCNF.
Resulting CNF or GCNF nanofiber samples were immersed in a TiO2 precursor solution (1.6 M TTIP in isopropanol), followed by heating at 60 °C for 1 h with mechanical stirring. Then, DI water or 1 M HCl aqueous solution (5% to total solution) was slowly added to solution. Afterward, the nanofiber sheet samples were washed copiously with DI water for four to five times to remove unreacted reactants and unattached TiO2 particles to nanofibers. Finally, annealing at 500 °C for 1 h (heating rate 5 °C min−1) was carried out as a calcination process.
Fabrication of DSSC device for J–V measurements
DSSC devices operated with carbon-based photoanode were fabricated with following procedure: FTO substrate (Sigma-Aldrich, USA) was dipped and sonicated in NaOH aqueous solution for several times to clean the surface. TiO2 paste was coated slightly on FTO glass, then fabricated CNFs were applied on FTO glass, followed by drying at 80 °C for 24 h. Finally, the sample was subjected to a calcination process at 150 °C for 2 h (heating rate: 5 °C min−1). The resulting FTO glass was immersed in 0.03 mM N719 dye solution in ethanol at 30 °C for 24 h. To make a counter electrode, 20 nm of Pt thin film was deposited to cleaned surface of FTO glass substrate. The counter electrode and dye-anchored photoanode were assembled to sandwich structure with 6 × 6 mm active area using ∼50 μm thick tape (3 M) as a spacer. The active space of the cell was filled with a liquid electrolyte, which consists of 0.6 M PMII, 0.05 M LiI, 0.05 M I2 and 0.5 M TBP solution in acetonitrile. To limit the effective irradiation area, 5 × 5 mm photomask was applied on photoanode. The schematic illustration of an assembled DSSC device and its digital photograph are provided in Fig. S1.† The plots of current density vs. voltage (J–V curves) of fabricated DSSC devices was measured using potentiostat with four electrodes under 1 sun using solar simulator.The power conversion energy efficiency was calculated using the following equation;
| FF = Jmax·Vmax/Jsc·Voc |
| η = FF·Voc·Jsc/Ein·A |
Characterization
Morphologies of nanofibers were examined by field emission-scanning electron microscopy (FE-SEM, S-5000, Hitachi) and transmission electron microscopy (TEM, 2010FasTEM, JEOL). X-ray photoelectron spectroscopy (XPS, AXIS-ULTRADLD, Shimadzu), Fourier transform infrared spectrometer (FT-IR, IR Prestige-21, Shimadzu) and Raman spectrometer with excitation wavelength of 532 nm (Hololab 5000, Kaiser Optical Systems, Inc., USA) were utilized to characterize chemical compositions of nanofibers. Electrochemical analysis was carried out using Versastat-4 potentiostat at a scan rate ranging from 5 mV s−1 to 100 mV s−1. X-ray diffraction (XRD) experiments were performed at room temperature using R-AXIPSD3C (Rigaku Co., Japan) operating at 40 kV and 150 mA. Nickel-filtered Cu Kα radiation was used as X-ray source and diffraction was detected with an angular range of 20° to 80°. Electrical measurement was performed using four-point probe instrument (Loresta GP MCP-T610, Mitsubisi chemical analytech).Incident photon-current conversion efficiency (IPCE) spectra were measured with a digital multimeter (Advantest AD7461A) at zero bias, under monochromatic light irradiation from a light source (Bunko Keiki SM-25A). The intensity of the monochromatic light at each wavelength was measured with a calibrated silicon photodiode (Hamamatsu Photonics S1337-1010BQ). A source meter (Keithley 2410) was used to obtain the current density versus voltage (J–V) curves both with and without 100 mW cm−2 artificial solar light irradiation of airmass 6 1.5 global (AM1.5 G) from a Newport Oriel solar simulator (Model 91160) with an AM1.5G filter (Newport Oriel 81088) and a light-intensity stabilizer (Newport Oriel, Model 68945).
Results and discussion
Morphology and chemical properties of CNF and GCNF
Graphene was oxidized by strong acid to generate polar groups on graphene surface before blending with PAN solution, leading to well-dispersed GO/PAN solution. Electrospinning of this solution also resulted in well-dispersed graphene oxide in CNF, as confirmed from Fig. 1 showing typical SEM and TEM images of CNF and GCNF. At a glance, in SEM images, both nanofibers clearly exhibit a randomly oriented, bead-free structure, and smooth surface similarly, with average diameters of CNF and GCNF of 160 ± 29 nm and 180 ± 34 nm, respectively. An addition of GO led to the increase of solution viscosity, hence average diameter slightly increased. After carbonization process of GO/PAN, GO is simultaneously reduced to graphene, resulting in reduced graphene oxide (rGO) incorporation in CNF. In TEM images (Fig. 1c and d), significant difference in surface morphology between CNF and GCNF can be found; GCNF has a rougher surface than CNF. The red circle in Fig. S2a† indicates rGO platelet in CNF, indicating successful incorporation of rGO in CNF through our fabrication process.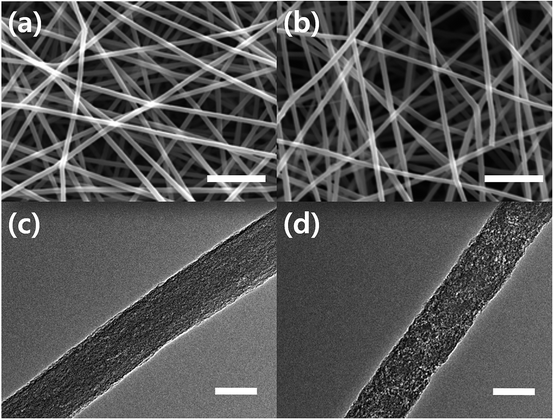 | ||
| Fig. 1 Morphology of CNF and GCNF examined by (a, b) SEM and (c, d) TEM images. (a, c) and (b, d) are corresponding to CNF and GCNF, respectively (SEM scale bar = 5 μm, TEM scale bar = 100 nm). | ||
Graphene incorporation was further evidenced with Raman spectroscopy studies as presented in Fig. 2a. The Raman spectra of both CNF and GCNF exhibit two well-known bands of carbon at ∼1345 cm−1 and 1595 cm−1, D band and G band, respectively.36 The G band arises from the phonons propagating along the graphitic structure, and the D band is related to the disordered turbostratic structures or defects in the graphitic structure.37 The intensity ratio of the D band to the G band (ID/IG) is often used to estimate the defect concentration in carbon materials. The ID/IG ratio of GCNF was 1.02 higher than 0.84 of CNF, indicating more ordered graphite crystalline structure and lower degree of defects in CNF compared to GCNF due to not fully reduced graphene oxide under a given processing condition and composite material system.38 Also, it is feasible that the addition of GO into PAN enhances the defect ratio of CNF due to the integration of defects from not fully reduced graphene oxide.39 Zhao et al. reported40 that thermal reduction of graphene oxide at temperature in range of 200–900 °C for 2 h produced rGO with different reduction level, indicating that rGO still has oxygen containing functionalities under the conditions. Enhanced D peak in GCNF spectrum suggests that GO reduction through carbonization of PAN is not complete, resulting in the functional groups on graphene surface. In addition, interestingly, the rGO having functional groups also exhibits relatively high electrical conductivity in their report.40 This is also in good agreement of our experimental results on conductivity measurements of GCNF; GCNF exhibited two times higher conductivity than CNF due to incorporation of conductive graphene (Fig. 2b). After carbonization, the defects in carbon materials are considerably reduced, leading to enhancement of conductivity in the composite.40 Therefore, graphene was successfully incorporated into CNF without aggregation of graphene, also the conductivity was highly improved.
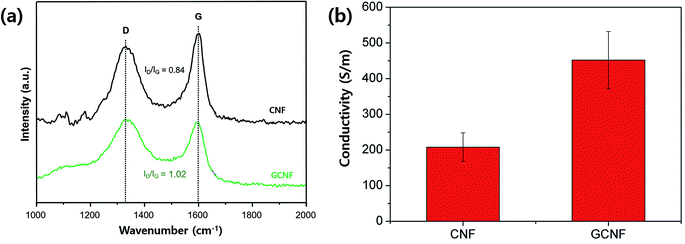 | ||
| Fig. 2 (a) Raman spectra of CNF (black) and GCNF (green), and (b) their conductivity values measured by four prove measurement. | ||
Growth of TiO2 on CNF and GCNF
TiO2 particles were grown on the surface of CNF or GCNF by simple sol–gel process under acidic condition and subsequent calcination at 500 °C. The SEM images of TiO2 decorated CNF (TCNF) and GCNF (TGCNF) are shown in Fig. 3. Low magnification images of TCNF and TGCNF in Fig. 3a and b shows TiO2 particles decorated on the surface of CNF or GCNF. It is noted that TiO2 particles with uniform size were evenly distributed along GCNF surface, whereas much larger and aggregated TiO2 particles were formed on CNF. The precursor, TTIP, is a well-known inorganic alkoxide compound which is an ideal chemical precursor for sol–gel synthesis of TiO2 due to its reactivity with water and further reaction toward polymerization.41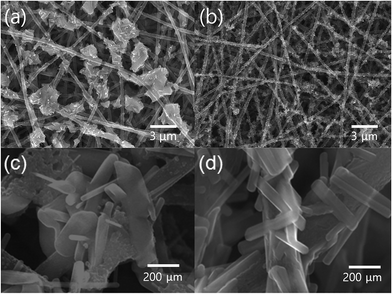 | ||
| Fig. 3 Low magnification SEM images of (a) TCNF and (b) TGCNF and high magnification SEM images of (c) TCNF and (d) TGCNF. | ||
When Ti metals are introduced to graphene, the TiO2/graphene composite can be easily formed due to the high binding energy between graphene and Ti.42,43 The electronic structure in graphene is strongly perturbed when it interacts with Ti metal,44 in particular, the characteristic conical points of graphene at K point. Graphene pz orbitals hybridize (relatively) strongly with the metal d states and the corresponding bands acquire a mixed graphene–metal character, resulting in the chemisorbed TiO2 on graphene.44 Thus, by introducing graphene in CNF, the strong chemisorption of TiO2 is expected, resulting in the uniform distribution of initiation sites for sol–gel process as presented in Fig. 3b, whereas TiO2/CNF showed the highly aggregated TiO2 as presented in Fig. 3a. In addition, it is worth noting that TiO2 particles on GCNF show uniform rectangular shape; however, the particles on CNF surface exhibit irregular shape (Fig. 3c and d).45
The crystallinity of synthesized TiO2 on both CNF and GCNF was studied with XRD experiments as shown in Fig. 4a. Specifically, the diffraction pattern from the TGCNF sample exhibited two crystalline phases, anatase and rutile, with sharper and more intense peaks compared to CNF sample. The peaks at 25.5°, 48°, 54° and 55° are assigned to (101), (200), (105) and (211) facets of anatase TiO2,46 and other peaks at 28°, 36°, 41.3°, 54.5°, 63° and 69° are corresponding to (110), (101), (111), (211), (220) and (301) reflections in the rutile TiO2 phase, respectively.47 In other hands, TCNF showed tenuous peaks indicating low crystallinity of TiO2. However, in Raman spectra shown in Fig. 4b, the peak intensity ratio of D and G band was not changed much in both nanofibers compared to before sol–gel process; the ID/IG of TCNF and TGCNF were 0.84 and 1.02, respectively. Those values are almost identical to ID/IG of CNF and GCNF, indicating that the TiO2 particles on the surface of nanofibers do not significantly affect the chemical structure of both nanofibers as D and G bands are solely originated from graphitic structure of carbon materials.
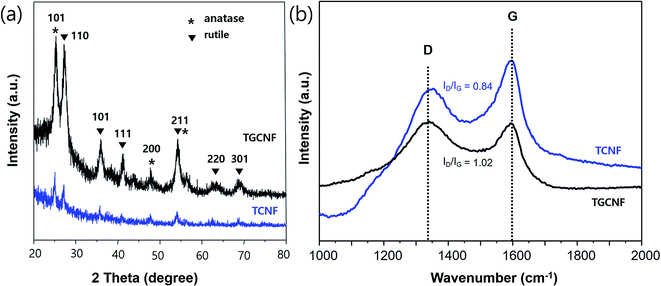 | ||
| Fig. 4 (a) XRD spectra of TCNF (blue) and TGCNF (black) and (b) Raman spectra of TCNF (blue) and TGCNF (black). | ||
The chemical composition of nanofibers was further investigated using XPS. Since XPS typically is used to gain the information on energy state of core electrons in elements of sample surface, we are able to further analyze oxidation state and chemical environment of metallic element, for example, titanium.48 As shown in full survey spectra in the range 0–1100 eV (Fig. 5a), both TCNF and TGCNF samples exhibit Ti, C and O characteristic peaks, indicating titanium compounds were formed on their surfaces. Among them, multiplex spectra of Ti 2p region at ∼460 eV was further measured to study oxidation state of titanium. Two prominent peaks (2p1/2 and 2p3/2 due to spin–orbit splitting) were observed in the XPS spectrum of Ti 2p. In the spectrum of TCNF sample, those two peaks were observed at 457.2 eV and 459.1 eV, assigned to Ti3+; however, two peaks in the spectrum of TGCNF sample appeared at higher positions of 463.1 eV and 464.9 eV, indicating Ti4+, which is the oxidation state of titanium in TiO2.49,50 Therefore, XRD and XPS studies strongly suggest that crystalline TiO2 is formed in GCNF due to interaction between functional groups of graphene and TiO2 precursor, which is not the case in CNF. Therefore, the result strongly suggests that graphene-incorporated in CNF plays a significant role to hold titanium precursor molecules on the surface, leading to an effective formation of TiO2.
 | ||
| Fig. 5 XPS spectra of (a) TGCNF (black) and TCNF (blue), and (b) Ti 2p core levels in TGCNF (black) and TCNF (blue). | ||
Effect of acid treatment on TiO2 formation on nanofibers
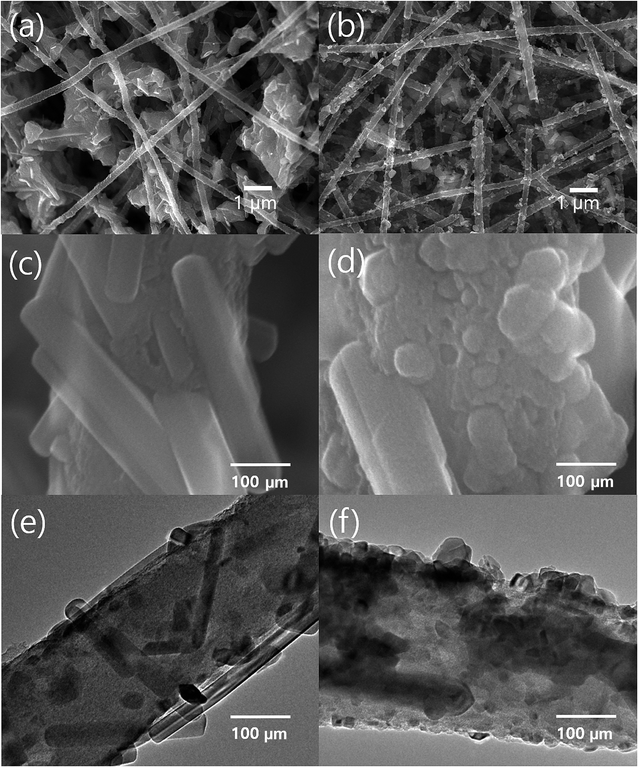
The sol–gel reaction to form TiO2 can be controlled by adjusting the pH of TTIP solution. During the sol–gel process, the hydrolysis of alkoxy group in TTIP occurs by the reaction of water molecules in solution with TTIP, subsequently, the addition reaction undergoes by attacking to another titanium in hydroxyl Ti or alkoxy Ti to produce Ti–O–Ti linkage. Also, the byproduct of condensation reaction (water) can act as an additional reactant for further hydrolysis and subsequent condensation reactions. Moreover, the acid is well-known catalyst for hydrolysis reaction in sol–gel process. Under acidic condition, Ti–OR group is easily protonated compared to under neutral condition, resulting in more facile condensation of TiO2 precursor.To understand the pH effect in our system, a certain amount of 1 M HCl solutions instead of water was added to each TTIP solution containing CNF and GCNF samples, which are denoted as TCNF-H and TGCNF-H, respectively. In case of TCNF (Fig. 3a) and TCNF-H (Fig. S3†), any big differences in morphologies were not observed in SEM analysis; both TCNF and TCNF-H exhibited a large TiO2 particles or aggregates without specific shape, which non-uniformly cover CNFs or locate besides the CNFs. However, TGCNF-H sample showed quite homogeneously distributed particles on nanofibers compared to TCNF samples, and almost all TiO2 particles are located on the surface of nanofibers (Fig. 6b). High resolution SEM and TEM micrographs in Fig. 6c–f further show the effect of additional acid on the particle morphology. Particles of TGCNF are rectangular as shown in Fig. 3d, however, particles of TGCNF-H exhibit irregular or more spherical shape with full coverage on TGCNF surface. These results suggest that protonation of Ti precursor under acidic condition may induce strong interaction with GCNF, resulting in well-distributed precursor molecules on nanofiber surface.
Fig. 7a shows the XPS survey spectra of TGCNF and TGCNF-H. As presented in both spectra, the two peaks of core level of Ti4+ emerge as interpreted above,51 indicating the formation of TiO2 particles. However, upon sol–gel process with acid, both peaks at Ti 2p1/2 and Ti 2p3/2 in TGCNF-H slightly upshifted from 464.9 to 465.2 eV, and from 459.1 to 459.5 eV, respectively. Typically, the position of Ti 2p3/2 peak in crystalline TiO2 is at ∼459 eV.52 Therefore, the upshift of Ti 2p3/2 peak in TGCNF-H may indicate the changes in its crystal structure. This result implies that the samples shown in Fig. 6 do not have an identical crystal structure, and also reaction condition might affect resulting crystalline structure during the formation of TiO2 particle. One possible scenario on this phenomenon is that the interaction between the protonated alkoxy groups and functional groups of graphene under acidic condition induces the reaction at the surface of the nanofiber, and alcohol byproduct may be captured on the surface upon further reaction, possibly allowing carbon doping in TiO2 and consequent distortion of its lattice structure and hence crystallinity.
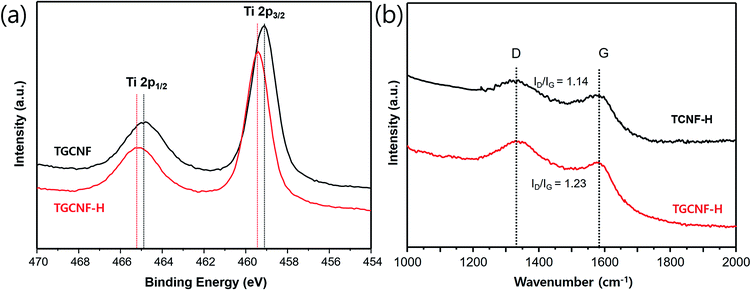 | ||
| Fig. 7 (a) XPS spectra of Ti 2p core level of TGCNF (black) and GCNF-H (red), and (b) Raman spectra of TCNF-H and TGCNF-H. | ||
Raman studies were also conducted to understand the effect of acid to CNF chemical structure (Fig. 7b). The ID/IG ratio values of TCNF-H and TGCNF-H were increased from 0.84 to 1.14 and from 1.02 to 1.23, respectively, compared to TCNF and TGCNF samples. Since TiO2 formation without acid did not significantly affect D and G bands of CNF samples as discussed above, the increase of ID/IG ratio indicates the change in oxidation state of nanofibers in acidic solution. This further suggests the increase of sites on CNF where the precursor molecules can interact, leading to more efficient formation of TiO2 on nanofiber surfaces.
Photovoltaic performance of fabricated nanofibers
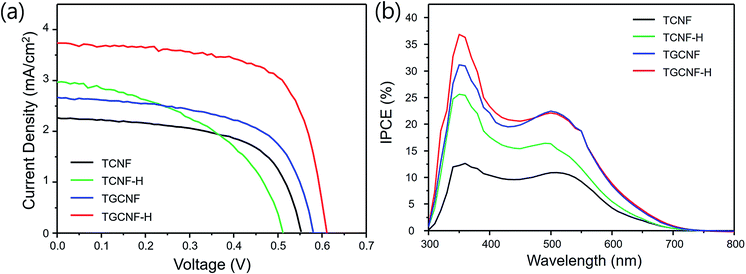
Fabricated nanofibers were further utilized for DSSC devices. The resulting J–V curves and extracted important parameters are shown in Fig. 8 and Table 1. The efficiencies of TCNF and TCNF-H cells were 0.7% and 0.75%; however, TGCNF and TGCNF-H cells exhibited higher efficiencies of 0.93 and 1.54%, respectively, indicating higher power conversion efficiency when graphene was incorporated. As mentioned in XPS studies above, the oxidation states of titanium in titanium oxide formed on CNF and GCNF were +3 and +4, respectively. That is, TiO2 formed on graphene incorporation is more desirable for higher efficiency of photovoltaic devices. Also, the increase the surface area is another possible reason for the enhancement to facilitate penetration of the redox I−/I3− couples to the TiO2 interface.| Material | Thickness (μm) | Voc [V] | Jsc [mA cm−2] | FF [-] | PCE [%] |
|---|---|---|---|---|---|
| TCNF | 23 | 0.51 | 2.97 | 0.4 | 0.71 |
| TCNF-H | 22 | 0.55 | 2.26 | 0.6 | 0.75 |
| TGCNF | 23 | 0.58 | 2.67 | 0.6 | 0.93 |
| TGCNF-H | 24 | 0.61 | 3.73 | 0.68 | 1.54 |
As seen in Table 1, Jsc value is the most critical factor for final efficiency values among all parameters. In detail, TGCNF-H exhibited Jsc of 3.73 mA cm−2 while the TCNF and TCNF-H devices exhibits only 2.97 mA cm−2 and 2.26 mA cm−2, and also validated in incident photon to current conversion efficiency (IPCE) action spectra in Fig. 8b. The current density increase typically interpreted to high absorption and improved charge transfer, possibly TGCNF has more favourable surface to adsorb a larger amount of dye, leading to more effective charge carrier transfer upon light excitation.53,54 IPCE data also have a similar trend to Jsc of DSSC; the efficiency of TGCNF-H is the highest compared to that of other nanofibers over whole measurement range between 300 nm and 700 nm (maximum at 360 nm). The power conversion efficiency presented here might not be high enough for the purpose of real solar cell device applications as fabricated device is not fully transparent to sunlight, resulting in relatively low efficiency; however, the chemical and physical principles of fabricated graphene incorporated CNF with TiO2 decoration toward DSSC application will be invaluable fundamentals to improve the efficiency. Also it is further feasible to improve the efficiency by involving the use of better dopants, catalytic counter electrode, and cell assembly.
Conclusions
In summary, TiO2 particles were synthesized on graphene incorporated CNF which was fabricated by electrospinning and further annealing, chemical treatment processes. The incorporation of graphene significantly affects the formation of TiO2 particle due to the strong interaction with Ti precursors, resulting in formation of homogeneously distributed crystalline TiO2 (4+ oxidation state of titanium) particles along nanofibers, as confirmed by morphology studies using electron microscope analysis and spectroscopic studies using XPS, XRD and Raman. Highest efficiency in DSSC device was observed in TiO2 decorated GCNF-H, indicating its ability to interact with DSSC dyes, resulting in high absorption and improve charge transfer process. The enhancement can be ascribed to improve short circuit current density (Jsc) to 3.73 mA cm−2. We found that graphene incorporation in CNFs and TiO2 synthesis under acidic condition is effective to enhance the efficiency of resulting DSSC, suggesting graphene plays a significant role in overall process and final target application. The material platform presented in this work may offer a new way to fabricate conductive polymer based nanofibrous materials which can be hybridized with functional inorganic materials for creating photoanode for new types of photo-electrochemical devices.Funding sources
This research did not receive any specific grant from funding agencies in the public, commercial, or not-for-profit sectors.Acknowledgements
H. L. gratefully acknowledges the support from Division of Frontier Fibers, Institute for Fiber Engineering (IFES), Interdisciplinary Cluster for Cutting Edge Research (ICCER) at Shinshu University. M. K. acknowledges the support from Basic Science Research Program through the National Research Foundation of Korea (NRF) funded by the Ministry of Education (2015R1C1A1A01053266). K. W. acknowledges the support of Industry University Research joint innovation fund – prospective joint research project, Science and Technology Department of Jiangsu Province, China. (BY2014059-01). We acknowledge support from the staff and the use of equipment at Shinshu University.Notes and references
- J.-Z. Chen, C. Wang, C.-C. Hsu and I. C. Cheng, Carbon, 2016, 98, 34–40 CrossRef CAS.
- Z. Chai, J. Gu, J. Khan, Y. Yuan, L. Du, X. Yu, M. Wu and W. Mai, RSC Adv., 2015, 5, 88052–88058 RSC.
- B. Dudem, J. W. Leem, J. H. Lim, S. H. Lee and J. S. Yu, RSC Adv., 2015, 5, 90103–90110 RSC.
- H. Bi, H. Cui, T. Lin and F. Huang, Carbon, 2015, 91, 153–160 CrossRef CAS.
- T. Liu, J. Hou, B. Wang, F. Bai, H. Chen, L. Gao, Y. Cao, H. He, J. Wang, N. Wang, G. Cao and Z. Guo, J. Mater. Chem. A, 2016, 4, 10794–10800 CAS.
- H. He, C. Zhang, T. Liu, Y. Cao, N. Wang and Z. Guo, J. Mater. Chem. A, 2016, 4, 9362–9369 CAS.
- H. Chen, T. Liu, J. Ren, H. He, Y. Cao, N. Wang and Z. Guo, J. Mater. Chem. A, 2016, 4, 3238–3244 CAS.
- B. O′regan and M. Grfitzeli, Nature, 1991, 353, 737–740 CrossRef.
- T. W. Hamann, A. B. Martinson, J. W. Elam, M. J. Pellin and J. T. Hupp, J. Phys. Chem. C, 2008, 112, 10303–10307 CAS.
- A. S. Nair, Z. Peining, V. J. Babu, Y. Shengyuan and S. Ramakrishna, Phys. Chem. Chem. Phys., 2011, 13, 21248–21261 RSC.
- J. van de Lagemaat, N.-G. Park and A. Frank, J. Phys. Chem. B, 2000, 104, 2044–2052 CrossRef CAS.
- M. Cass, A. B. Walker, D. Martinez and L. Peter, J. Phys. Chem. B, 2005, 109, 5100–5107 CrossRef CAS PubMed.
- B. Liu and E. S. Aydil, J. Am. Chem. Soc., 2009, 131, 3985–3990 CrossRef CAS PubMed.
- S. H. Kang, S. H. Choi, M. S. Kang, J. Y. Kim, H. S. Kim, T. Hyeon and Y. E. Sung, Adv. Mater., 2008, 20, 54–58 CrossRef CAS.
- N. Yang, J. Zhai, D. Wang, Y. Chen and L. Jiang, ACS Nano, 2010, 4, 887–894 CrossRef CAS PubMed.
- C.-Y. Yen, Y.-F. Lin, S.-H. Liao, C.-C. Weng, C.-C. Huang, Y.-H. Hsiao, C.-C. M. Ma, M.-C. Chang, H. Shao and M.-C. Tsai, Nanotechnology, 2008, 19, 375305 CrossRef PubMed.
- J. Durantini, P. P. Boix, M. Gervaldo, G. M. Morales, L. Otero, J. Bisquert and E. M. Barea, J. Electroanal. Chem., 2012, 683, 43–46 CrossRef CAS.
- Y. Hou, F. Zuo, A. Dagg and P. Feng, Angew. Chem., 2013, 125, 1286–1290 CrossRef.
- X. Huang, S. Huang, Q. Zhang, X. Guo, D. Li, Y. Luo, Q. Shen, T. Toyoda and Q. Meng, Chem. Commun., 2011, 47, 2664–2666 RSC.
- L. Xiang, Z. Wang, Z. Liu, S. E. Weigum, Q. Yu and M. Y. Chen, IEEE Sens. J., 2016, 16, 8359–8364 Search PubMed.
- J. Liu, Y.-T. Kuo, K. J. Klabunde, C. Rochford, J. Wu and J. Li, ACS Appl. Mater. Interfaces, 2009, 1, 1645–1649 CAS.
- D. Sebastian, V. Baglio, M. Girolamo, R. Moliner, M. Lazaro and A. Arico, J. Power Sources, 2014, 250, 242–249 CrossRef CAS.
- K. L. Kleina, M. A. Guillorn, D. H. Lowndes and M. L. Simpsona, Appl. Phys. Lett., 2004, 84, 3972–3974 CrossRef.
- H. E. Unalan, D. Wei, K. Suzuki, S. Dalal, P. Hiralal, H. Matsumoto, S. Imaizumi, M. Minagawa, A. Tanioka and A. J. Flewitt, Appl. Phys. Lett., 2008, 93, 133116 CrossRef.
- J. Liu, J. Li, A. Sedhain, J. Lin and H. Jiang, J. Phys. Chem. C, 2008, 112, 17127–17132 CAS.
- J. Gu, X. Yang, Z. Lv, N. Li, C. Liang and Q. Zhang, Int. J. Heat Mass Transfer, 2016, 92, 15–22 CrossRef CAS.
- J. Gu, X. Yang, C. Li and K. Kou, Ind. Eng. Chem. Res., 2016, 55, 10941–10946 CrossRef CAS.
- H. Gu, C. Ma, J. Gu, J. Guo, X. Yan, J. Huang, Q. Zhang and Z. Guo, J. Mater. Chem. C, 2016, 4, 5890–5906 RSC.
- J. Gu, N. Li, L. Tian, Z. Lv and Q. Zhang, RSC Adv., 2015, 5, 36334–36339 RSC.
- J. Gu, C. Liang, J. Dang, W. Dong and Q. Zhang, RSC Adv., 2016, 6, 35809–35814 RSC.
- J. Zhu, M. Chen, H. Qu, Z. Luo, S. Wu, H. A. Colorado, S. Wei and Z. Guo, Energy Environ. Sci., 2013, 6, 194–204 CAS.
- S. Sun, L. Gao and Y. Liu, Appl. Phys. Lett., 2010, 96, 3113 Search PubMed.
- Y. Song, H. Lee, J. Ko, J. Ryu, M. Kim and D. Sohn, Bull. Korean Chem. Soc., 2014, 35, 2009–2012 CrossRef CAS.
- S. Lee, H. Lee, J. H. Sim and D. Sohn, Macromol. Res., 2014, 22, 165–172 CrossRef CAS.
- H. Lee, J. M. Koo, D. Sohn, I.-S. Kim and S. S. Im, RSC Adv., 2016, 6, 40383–40388 RSC.
- M. Kim, N. S. Safron, E. Han, M. S. Arnold and P. Gopalan, ACS Nano, 2012, 6, 9846–9854 CrossRef CAS PubMed.
- V. Barranco, M. Lillo-Rodenas, A. Linares-Solano, A. Oya, F. Pico, J. Ibañez, F. Agullo-Rueda, J. M. Amarilla and J. Rojo, J. Phys. Chem. C, 2010, 114, 10302–10307 CAS.
- A. Jänes, H. Kurig and E. Lust, Carbon, 2007, 45, 1226–1233 CrossRef.
- B. You, L. Wang, L. Yao and J. Yang, Chem. Commun., 2013, 49, 5016–5018 RSC.
- B. Zhao, P. Liu, Y. Jiang, D. Pan, H. Tao, J. Song, T. Fang and W. Xu, J. Power Sources, 2012, 198, 423–427 CrossRef CAS.
- M. Niederberger, M. H. Bartl and G. D. Stucky, Chem. Mater., 2002, 14, 4364–4370 CrossRef CAS.
- G. Williams, B. Seger and P. V. Kamat, ACS Nano, 2008, 2, 1487–1491 CrossRef CAS PubMed.
- T.-D. Nguyen-Phan, V. H. Pham, E. W. Shin, H.-D. Pham, S. Kim, J. S. Chung, E. J. Kim and S. H. Hur, Chem. Eng. J., 2011, 170, 226–232 CrossRef CAS.
- P. A. Khomyakov, G. Giovannetti, P. C. Rusu, G. Brocks, J. van den Brink and P. J. Kelly, Phys. Rev. B: Condens. Matter Mater. Phys., 2009, 79, 195425 CrossRef.
- W. Li, F. Wang, S. Feng, J. Wang, Z. Sun, B. Li, Y. Li, J. Yang, A. A. Elzatahry, Y. Xia and D. Zhao, J. Am. Chem. Soc., 2013, 135, 18300–18303 CrossRef CAS PubMed.
- J. T. Park, J. H. Koh, J. K. Koh and J. H. Kim, Appl. Surf. Sci., 2009, 255, 3739–3744 CrossRef CAS.
- N. G. Park, G. Schlichthörl, J. van de Lagemaat, H. M. Cheong, A. Mascarenhas and A. J. Frank, J. Phys. Chem. B, 1999, 103, 3308–3314 CrossRef CAS.
- Z. Jin, H. Gao and L. Hu, RSC Adv., 2015, 5, 88520–88528 RSC.
- M. C. Biesinger, L. W. Lau, A. R. Gerson and R. S. C. Smart, Appl. Surf. Sci., 2010, 257, 887–898 CrossRef CAS.
- M. A. Stranick, M. Houalla and D. M. Hercules, J. Catal., 1987, 106, 362–368 CrossRef CAS.
- S. Södergren, H. Siegbahn, H. Rensmo, H. Lindström, A. Hagfeldt and S.-E. Lindquist, J. Phys. Chem. B, 1997, 101, 3087–3090 CrossRef.
- N. C. Saha and H. G. Tompkins, J. Appl. Phys., 1992, 72, 3072–3079 CrossRef CAS.
- R. Kavitha and L. G. Devi, J. Environ. Chem. Eng., 2014, 2, 857–867 CrossRef CAS.
- L. Zhang and R. V. Koka, Mater. Chem. Phys., 1998, 57, 23–32 CrossRef CAS.
Footnote |
| † Electronic supplementary information (ESI) available: DSSC device fabrication, TEM image of rGO incorporated CNF, SEM images of TCFN-H. See DOI: 10.1039/c6ra26301a |
| This journal is © The Royal Society of Chemistry 2017 |

