 Open Access Article
Peptide nucleic acid-ionic self-complementary peptide conjugates: highly efficient DNA condensers with specific condensing mechanism†
Meiwen Cao *,
Wenjing Zhao,
Peng Zhou,
Zilong Xie,
Yawei Sun and
Hai Xu*
State Key Laboratory of Heavy Oil Processing, Centre for Bioengineering and Biotechnology, China University of Petroleum (East China), 66 Changjiang West Road, Qingdao 266555, P. R. China. E-mail: mwcao@upc.edu.cn; xuh@upc.edu.cn
First published on 16th January 2017
Abstract
A new type of conjugated molecule including T′3–(AKAE)2, T′3–(IKIE)2, and A′3–(AKAE)2 was designed by linking short peptide nucleic acid (PNA) segments with short ionic self-complementary peptide (ISCP) sequences. These short conjugates showed high hybridization affinity and specificity for λ-DNA. They can induce efficient DNA condensation at low micromole concentrations via a specific mechanism that involves the base pair recognition between DNA and the PNA segment and the self-aggregation of the bound PNA–ISCP molecules. Atomic force microscopy (AFM) and dynamic light scattering (DLS) measurements indicated that λ-DNA took an elongated conformation while it compacted into globules when interacting with the PNA–ISCP conjugates. The ethidium bromide displacement assay indicated that the PNA–ISCP conjugates induced DNA condensation in a way different from conventional cationic condensers such as polyethyleneimine (PEI) and hexadecyltrimethylammonium bromide (CTAB). The interaction between T′3–(AKAE)2 and a single chain oligonucleotide, d(A)36, was further studied and the results revealed that the PNA–ISCP conjugates bound with DNA mainly via base pairing recognition. The volume ratio of λ-DNA and the λ-DNA/PNA–ISCP globules was calculated based on AFM measurements, which was near 1![[thin space (1/6-em)]](https://www.rsc.org/images/entities/char_2009.gif) :
:![[thin space (1/6-em)]](https://www.rsc.org/images/entities/char_2009.gif) 1, suggesting that the condensation was an intramolecular folding process for λ-DNA, which was prompted by the self-aggregation of the bound PNA–ISCP molecules.
1, suggesting that the condensation was an intramolecular folding process for λ-DNA, which was prompted by the self-aggregation of the bound PNA–ISCP molecules.
1. Introduction
Condensation of elongated DNA strands into compact structures is a crucial step in gene transfection, which facilitates the transfer of genes into targeted cells and protects them from endonucleases. Development of effective DNA condensing agents is an active research area in gene therapy.1 Current non-viral DNA condensers are mostly cationic species including small multivalent ions,2,3 lipids,4 surfactants,5,6 polymers,7,8 dendrimers,9–11 and peptides,12,13 which all offer potential routes for DNA condensation. The mechanism of condensation varies according to the structural characteristics of the condensers.14 Small cationic agents can induce DNA condensation through purely electrostatic interactions. Their condensing capacity and routes are largely dependent on the number of positive charges. Cations with valency of 3 or more appear to be effective in DNA condensation. Cations with valency between 3 and 10 (e.g., trivalent Co(NH3)63+ and tetravalent spermine) can induce an all-or-none DNA compaction process without intermediate states,2,3 while polycations with valency greater than 10 (e.g., polyethyleneimine and polylysine) usually produce a progressive compaction route.15,16 The condensation mechanism of cationic lipids and surfactants is some complex.4–6 Besides positive charges, these amphiphiles also contain hydrophobic moieties and thus tend to self-aggregate in aqueous solution. Therefore, hydrophobic interactions and their aggregation behaviors have to be taken into account. Virtually, it has been well established that cationic surfactants bind to DNA via a highly cooperative way, which results in complex condensation behaviors with both all-or-none and progressive characteristics.5,15–17 It appears that increasing surfactant aggregation favors the cooperative binding of the surfactant molecules with DNA and thus enhances their condensation ability.14The recognition of nucleic acids by other molecules involves more than electrostatic and hydrophobic interactions, and other non-covalent forces (e.g. hydrogen-bonding and π–π stacking) can also be exploited for DNA binding. Grinstaff and coworkers have modified cationic lipids by introducing uridine to generate a cationic nucleoside lipid.18,19 They found that the functional uridine group introduced hydrogen bonding and aromatic π–π stacking when interacting with DNA, which facilitated lipid/DNA binding and then efficient gene transfection. There are also reports of DNA vector design by covalently linking an antisense DNA sequence to a peptide vehicle, which proved successful in enhanced gene hybridization and delivery.20 These reports all reveal the possibility of combining different structural features in one molecular structure through rational molecular engineering in a way that enhances the binding ability to DNA and that can generate novel DNA/condenser complexes.
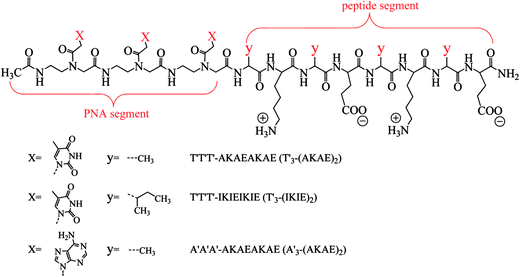
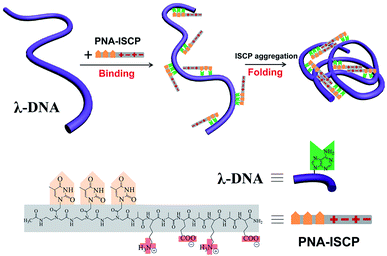
Peptide nucleic acid (PNA) is a DNA mimic with nucleobases attached to a pseudo-peptide backbone (polyamide).21 Such a structural characteristic endows PNA molecules with improved hybridization affinity and specificity for DNA as well as enhanced chemical and enzymatic stability.22 Ionic self-complementary peptides (ISCPs) are a class of short peptides with an alternating distribution of hydrophobic and hydrophilic residues along the sequence.23,24 These peptides exhibit excellent self-assembling ability driven by the cooperative effects of intermolecular ionic, hydrogen bonding, and hydrophobic interactions. Taking advantage of these structural features, we here design a series of short PNA–ISCP conjugates by covalently coupling a short PNA segment to a short ISCP sequence for using in DNA condensation, as shown in Fig. 1. Our recent study showed that T′3–(AKAE)2 could co-assemble with single-strand oligoadenines (d(A)x) to form virus-like supramolecular structures because that the short PNA segment offered specific binding to d(A)x via base pair recognition (e.g. hydrogen-bonding and base π–π stacking), and the short ISCP segment introduced a strong self-aggregating ability through ionic, hydrogen bonding, and hydrophobic interactions.25 Here, we demonstrate that the short PNA–ISCP conjugates can induce efficient DNA condensation via the same cooperative mechanism that involves PNA–DNA base pair recognition and ISCP self-aggregation, highlighting the capability of PNA–ISCP conjugates being used as highly efficient DNA condensers. Having a net charge of zero, the PNA–ISCP conjugates may avoid the drawback of high cytotoxicity that comes from the higher positive charge density of other DNA condensers. Moreover, the DNA/PNA–ISCP complexes can be viewed as supramolecular systems with defined molecular binding stoichiometry, which resemble artificial virus structures.
2. Experimental details
2.1. Materials
λ-DNA (M = 3.15 × 10⁷, ca. 48.5 kbp) was purchased from New England BioLabs (Beijing, China). The single chain DNA d(A′)36 was bought from Shanghai Sangon Biotech Co., Ltd. The PNA molecule T′T′T′ and the PNA–ISCP conjugated molecules including T′3–(AKAE)2, T′3–(IKIE)2, and A′3–(AKAE)2 were obtained from Alpha Biotech Co., Ltd. (Chengdu, China) with purity ≥96%. The peptide molecule AKAEAKAE was synthesized in our laboratory on a CEM Liberty microwave synthesizer, with both termini capped. All other chemicals were obtained from Sinopharm Chemical Reagent Company (SCRC) with purity >99.0%. All reagents were used as received without further purification. Water used in this study was processed from a Millipore system with a minimum resistivity of 18 MΩ cm. All solutions were prepared with phosphate buffer (10 mM, pH 7.0) and stored at 277.2 ± 1.0 K if not specified.2.2. Atomic force microscopy (AFM)
A Multimode Nanoscope IVa AFM (Digital Instruments, Santa Barbara, CA) was used for AFM measurements under ambient conditions. The probes used were TESP silicon probes (Digital Instruments) with a nominal spring constant of 42 N m−1. For sample preparation, 10–15 μL of sample solution was deposited onto a freshly cleaved mica surface and incubated for 10–60 s at 277.2 ± 1.0 K. The sample was then dried with a gentle stream of pure nitrogen gas. Tapping mode images were obtained with a scan speed of 1.0–1.5 Hz, a tip resonance frequency of 230–300 kHz, and a drive amplitude of 20–100 mV. Topographic data were regularly recorded as 512 × 512 pixel images simultaneously in trace and retrace to check for scan artifacts. Image processing was carried out using the Digital Instruments Nanoscope software (version V531r3). All images are shown without any treatment except the first order flattening to remove any tilt in the surface.2.3. Dynamic light scattering (DLS)
The hydrodynamic diameters of λ-DNA and λ-DNA/PNA–ISCP complexes were measured using a Malvern Zetasizer Nano-ZS instrument (ZEN3600, Malvern Instruments, Worcestershire, UK) at 277.2 K. During experiments, the sample solution was injected into a clear disposable capillary cell (DTS1060C) and equilibrated for at least 5 min before data collection. The measurement was repeated three times to verify the data consistence.2.4. Ethidium bromide (EtBr) exclusion assay
For the EtBr displacement assay, 100 μL of λ-DNA (1.6 × 10⁻⁵ μM) and 5.0 μL of EtBr (2.5 μM) were added into each well of a black 96-well plate. After shaking gently, the plate was incubated in dark for 30 min at 277.2 K. Then, 20 μL of T′3–(AKAE)2 or PEI or CTAB solution with varying concentration was added per well of the plate, followed by further incubation for 10 min in dark. The fluorescence emission at 610 nm was measured using a fluorescence microplate reader (Molecular Instrument, M2e) with an excitation wavelength of 520 nm. The DNA solution with EtBr in the absence of competition for binding was taken as control and its fluorescence was taken as maximum, i.e., 100%. The fluorescence in the presence of condensing agents was expressed as the percentage of the maximum fluorescence.2.5. Circular dichroism (CD)
CD spectra were recorded on a spectrophotometer (MOS-450/AF-CD, BioLogic) at 277.2 K using a quartz cell. Scans were obtained in a range between 190 and 360 nm by taking points at 0.5 nm, with an integration time of 0.5 s. The spectra were smoothed using the noise reducing option in the software supplied by the vendor. The spectroscopic scan was repeated at least three times and their average results were presented.2.6. UV-vis measurements
UV-vis absorption spectra were obtained using a Shimadzu UV-2450 spectrophotometer with a 1.0 mm quartz cell at 277.2 ± 1.0 K. Scans were obtained in a range between 200 and 350 nm.3. Results and discussion
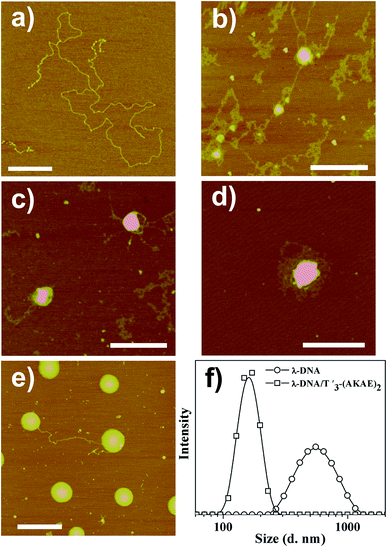
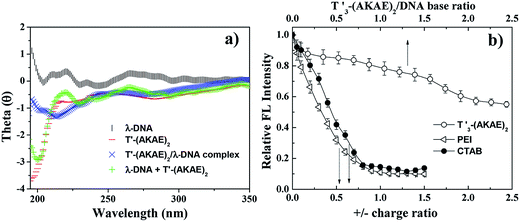
AFM measurements were firstly performed to follow the morphological change of λ-DNA molecules before and after mixing with T′3–(AKAE)2, as shown in Fig. 2. For λ-DNA itself, an elongated thread-like structure with a larger contour length was observed (Fig. 2a), which corresponded to a linear duplex DNA and indicated that DNA was in the coil state.26 DNA takes such an extended conformation due to the high charge density and molecular rigidity in solution.6 However, upon addition of T′3–(AKAE)2 into the DNA solution, we observed significant morphological changes (Fig. 2b–e) with time elapsed. After mixing for 5 min, loose aggregates prevailed, some of which accumulated locally to form globules with varied size, suggesting the onset of DNA condensation by T′3–(AKAE)2. At 10 min and 30 min, the amount of loose aggregates decreased gradually while the local globules grew to be larger and larger. These supramolecular structures are most likely to be intermediates during the DNA condensation process. After mixing for 4 h, larger globular stacks with a height of 4.09 ± 0.24 nm and a width of 217.4 ± 17.4 nm dominated, and they showed little morphological change with prolonged incubation time. Furthermore, these globular stacks were rather uniform in size, reminiscent of living polymerization. In fact, the major difference between the height and the width from AFM measurements was expected for globular nanostructures composed of soft matters, due to the structural deformation and/or the flattening effect caused by the substrate interference and/or the AFM tip compression, as well as the convolution of the AFM tip during measurements. The results virtually indicated that DNA was in the globule state after complexing with T′3–(AKAE)2. Additionally, the DLS measurements clearly showed the DNA condensation process. As shown in Fig. 2d, we observed an size change from 600 ± 200 nm, which would be the λ-DNA itself,6 to a much smaller value of 150 ± 50 nm, which would be the λ-DNA/T′3–(AKAE)2 complexes (Fig. 2f). Note that the lowest working concentration of T′3–(AKAE)2 for the DNA condensation was on the order of 10−7 M, which is one or two orders of magnitude lower than those of conventional condensing agents such as surfactants and polyamines,6,15,16,27 indicating the excellent DNA condensation ability of T′3–(AKAE)2. However, in the control experiments, the PNA segment of T′3 and the peptide segment of (AKAE)2 were unable to induce DNA condensation (Fig. S1, ESI†), implying a cooperative and complex mechanism for the DNA condensation induced by T′3–(AKAE)2.CD measurements were performed to investigate the interaction between λ-DNA and T′3–(AKAE)2. As shown in Fig. 3a, the curve of λ-DNA itself had a positive band between 260 and 280 nm and a negative band between 240 and 250 nm, typical of the B-form double-stranded conformation.6 T′3–(AKAE)2 showed a predominant negative peak at around 200 nm, indicative of random coiled conformation. The “λ-DNA + T′3–(AKAE)2” curve is produced by simply merging the λ-DNA curve and the T′3–(AKAE)2 curve, which was distinctly different from the curve of λ-DNA/T′3–(AKAE)2 complexes. The results indicated that the two species interacted with each other to result in conformational change. Moreover, for the λ-DNA/T′3–(AKAE)2 complexes, the negative peak at about 218 nm indicates that the peptide segment formed β-sheet secondary structure when interacting with DNA.
Unlike conventional cationic condensation agents, T′3–(AKAE)2 is overall neutral with two cationic lysine and two anionic glutamic acid residues along the peptide backbone. It is most likely that other non-covalent interactions rather than electrostatic interactions are primarily responsible for the initial binding of T′3–(AKAE)2 onto DNA during the DNA compaction process. The ethidium bromide (EtBr) displacement assay was further used to assess the relative binding affinity of various condensation agents to DNA.28–31 Upon mixing EtBr with DNA, the fluorescence of EtBr enhances dramatically, as a result of its intercalation into DNA. The binding of condensation agents to DNA usually displaces the intercalated EtBr and causes a decrease in the fluorescence emission intensity of EtBr at 610 nm.32 As shown in Fig. 3b, the EtBr displacement assay indicated that T′3–(AKAE)2 and conventional cationic DNA condensing agents (polyethyleneimine (PEI) and hexadecyltrimethylammonium bromide (CTAB)) displayed completely different behaviors in leading to the decrease in the EtBr fluorescence, suggesting their different binding modes. For both PEI and CTAB, a sharp decrease in the EtBr fluorescence at 610 nm was found with an increase in the positive/negative charge ratio, and the equilibrated fluorescence intensity was well below 20% of the initial value obtained in the absence of condensers. While for T′3–(AKAE)2, there was a slow decrease in the fluorescence intensity with increasing T′3–(AKAE)2 concentrations, and the equilibrated fluorescence intensity was some 57% of the initial value. Positively charged PEI and CTAB can interact with DNA via electrostatic interactions and displace most of the bound EtBr molecules, thus resulting in a significant fluorescence reduction with increasing concentration.33 T′3–(AKAE)2 bears net charge of zero but it contains three consecutive thymine (T′) bases, it is thus deduced that T′3–(AKAE)2 binds with DNA predominantly via base pairing interactions, e.g., hydrogen bonding and base π–π stacking. Because these interactions are non-ionic, they are not so efficiently strong in displacing the bound EtBr molecules from DNA, therefore, the addition of T′3–(AKAE)2 only resulted in a slow and limited fluorescence reduction. Moreover, the DNA condensates induced by CTAB and PEI were also characterized by AFM for comparison. In the two cases, the condensates were irregular in morphology, unlike the spherical condensates caused by T′3–(AKAE)2 (Fig. S2, ESI†). The results also indicate different binding and condensation mechanisms for the three condensing agents.
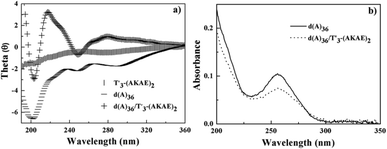
In order to confirm the above hypothesized binding mode, we studied the interaction of T′3–(AKAE)2 with a single chain oligonucleotide, d(A)36. Fig. 4 presents the CD and UV-vis spectra of d(A)36, T′3–(AKAE)2, and their complexes. For T′3–(AKAE)2 and d(A)36, the CD spectra all had negative values in the measured wavelength range of 190–360 nm. However, the d(A)36/T′3–(AKAE)2 complexes exhibited a quite different CD spectrum, with two positive peaks at some 220 nm and 278 nm and two negative peaks at some 205 nm and 250 nm. The CD spectral characteristics are well consistent with those of the PNA–DNA duplexes formed via Watson–Crick base pairing as demonstrated by Nielsen and coworkers.22,34 In Fig. 4b, the absorbance at 260 nm was significantly decreased for the d(A)36/T′3–(AKAE)2 mixed system, in comparison with that of pure d(A)36. For d(A)36, the adenines were exposed to water and had strong absorbance, but when d(A)36 formed complexes with T′3–(AKAE)2, a large proportion of adenines were buried in the complex, resulting in an absorbance decrease through a hypochromic effect. Moreover, the polyacrylamide gel electrophoresis (PAGE) results (Fig. S3, ESI†) showed that the T′3–(AKAE)2/d(A)36 complexes moved faster than the d(A)36 molecules in the gel, indicating that T′3–(AKAE)2 interact with d(A)36 to produce condensates with smaller sizes. Overall, the above results all give clues that T′3–(AKAE)2 can form complexes with DNA via base pairing recognition.
Although the T′T′T′ segment can offer specific binding affinity to DNA, it was unable to induce DNA condensation unless it was conjugated to the (AKAE)2 sequence. Simultaneously, the (AKAE)2 segment was also unable to induce the DNA condensation individually (Fig. S1, ESI†), although ISCPs can self-aggregate through hydrogen bonding, electrostatic interactions and hydrophobic interactions above critical aggregation concentrations.23,24 Therefore, the excellent DNA condensation ability of T′3–(AKAE)2 arises from the cooperative effect of the specific binding of T′T′T′ to DNA and the self-aggregating capacity of (AKAE)2. At the working concentration of 0.2 μM, T′3–(AKAE)2 adopted a random coil conformation (Fig. 4a). When the concentration was increased to 10.0 μM, however, two characteristic peaks of β-sheet conformations occurred at ∼198 and ∼216 nm, respectively (Fig. S4, ESI†), indicating that the hybrid molecule tended to adopt a β-sheet secondary structure. It is known that for ISCPs, the formation of β-sheet conformations signifies the onset of their self-aggregation.23,24 Based on these results, we suggested that T′3–(AKAE)2 molecules accumulated onto a DNA chain via specific base paring interactions, and once reaching locally a critical concentration, the bound T′3–(AKAE)2 molecules tended to self-aggregate, driven by hydrophobic interactions between Ala side chains and β-sheet hydrogen bonding, thus causing the DNA chain to pack together and eventually resulting in DNA condensation.
Given the above cooperative effect of the specific binding of the PNA segment and the self-aggregation of the peptide segment in driving DNA condensation, we expected that the other two PNA–ISCP molecules with the same length, i.e., T′3–(IKIE)2 and A′3–(AKAE)2 can also induce effective DNA condensation. The former has the same nucleoside sequence but a different peptide sequence while the latter has the same peptide sequence but a different nucleoside sequence, in comparison with T′3–(AKAE)2. As shown in Fig. S5,† both T′3–(IKIE)2 and A′3–(AKAE)2 condensed λ-DNA into large and uniform globules after 4 h mixing at a concentration of 0.2 μM, in the same way as T′3–(AKAE)2 did. Based on the measured heights and widths from AFM, the volumes of the formed DNA/PNA–ISCP globules were similar for the three hybrid molecules (Table 1). In fact, because Ile has higher hydrophobicity and stronger propensity for β-sheet hydrogen bonding than Ala, the (IKIE)2 segment should have an enhanced self-aggregating ability. Possibly owing to such a reason, T′3–(IKIE)2 led to a more reduction in the EtBr fluorescence in comparison with T′3–(AKAE)2 while A′3–(AKAE)2 showed a similar fluorescence reduction with T′3–(AKAE)2 (Fig. S6, ESI†).
| Species | Measured height (H) (nm) | Measured width (2W) (nm) | Calculated volume (nm3) |
|---|---|---|---|
| λ-DNA | 0.79 ± 0.10 | 19.2 ± 1.8 | 16.4 × 10³π |
| λ-DNA/T′3–(AKAE)2 | 4.09 ± 0.24 | 217.4 ± 17.4 | (22.7 ± 6.4) × 103π |
| λ-DNA/T′3–(IKIE)2 | 10.10 ± 1.09 | 128.2 ± 13.4 | (15.5 ± 6.1) × 103π |
| λ-DNA/A′3–(AKAE)2 | 8.76 ± 1.46 | 138.0 ± 10.4 | (16.9 ± 5.9) × 103π |
To test whether the DNA condensation induced by the designed small PNA–ISCPs was an intramolecular process or an intermolecular one for DNA, we calculated the volumes of the formed λ-DNA/PNA–ISCP globules based on AFM measurements. Table 1 lists the measured heights (H) and widths (2W), which were derived from the statistical results shown in Fig. S7.† In AFM measurements, a correct height but an overestimated width is usually produced due to the convolution of AFM tips.35 Furthermore, soft nano-objects such as DNA chains and their condensed globules tend to collapse due to the substrate interference, resulting in the formation of significantly deformed structures with a quasi-arched section (Scheme 1). As a result, the correlation between the measured width (2W) and the real one (2W′) of a deformed λ-DNA chain or a deformed DNA globule in AFM imaging can be described based on the following equations (eqn (1)–(4)):
| W = ΔW + W′ | (1) |
 | (2) |
W′ = r![[thin space (1/6-em)]](https://www.rsc.org/images/entities/char_2009.gif) sin sin![[thin space (1/6-em)]](https://www.rsc.org/images/entities/char_2009.gif) θ θ
| (3) |
 | (4) |
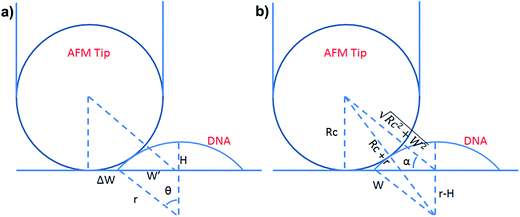 | ||
| Scheme 1 (a) Schematic illustration of the geometrical dimensions of a deformed DNA chain or a deformed DNA globule in AFM imaging. (b) Schematic illustration of the geometrical correlations between the radius of the AFM tip and the dimension of a deformed DNA chain or a deformed DNA globule. W′ is half of the real width of the deformed nano-objects. ΔW is half of the difference between the measured width (2W) and the real one (2W′), which arises from the convolution of the AFM tip.35 H represents the measured height and r the arch radius. Rc denotes the radius of the AFM tip. | ||
The λ-DNA chain is taken as a cylinder with a diameter of ∼2 nm,6 therefore, its cross section area (S) is π nm2. Taken the length of λ-DNA of 16.4 μm,6 the volume (V0) of a λ-DNA chain is 16.4 × 10³π nm3. In AFM experiments, the circular section transformed into a quasi-arched one but with the area unchanged. Based on the known section area and the measured height (H) and width (2W) of the λ-DNA chain from AFM (Table 1), the radius (r) and the real width (2W′) of the formed λ-DNA arch were calculated to be 5.86 ± 2.32 and 2.94 ± 1.88 nm, respectively.
Based on Scheme 1b, we can correlate the radius of the AFM tip (Rc) with that of the arch (r) via eqn (5)–(7). By combing eqn (5)–(7), the direct relationship between Rc and r was derived, as shown in eqn (8). Because the W, H, and r values of the formed λ-DNA arch were well determined, the value of Rc was calculated to be 52.8 ± 1.7 nm from eqn (8).
 | (5) |
cos(α + 90°) = −sin![[thin space (1/6-em)]](https://www.rsc.org/images/entities/char_2009.gif) α α
| (6) |
 | (7) |
 | (8) |
 | (9) |
Because Rc did not change when the same AFM tip was used for scanning, the radius (r) of the quasi-arched section of the deformed λ-DNA/PNA–ISCP globules was calculated based on eqn (8), in which other two parameters (W and H) were determined from AFM measurements (Table 1). Finally, the volumes (V) of λ-DNA/PNA–ISCP globules were calculated based on eqn (9), being (22.7 ± 6.4) × 103π, (15.5 ± 6.1) × 103π, and (16.9 ± 5.9) × 103π nm3 for λ-DNA/T′3–(AKAE)2, λ-DNA/T′3–(IKIE)2, and λ-DNA/A′3–(AKAE)2, respectively. The V/V0 ratio was 1.39 ± 0.39, 0.95 ± 0.37, and 1.03 ± 0.36 for these three systems, respectively. The results indicated that only one λ-DNA molecule was compacted into a single λ-DNA/PNA–ISCP globule. Therefore, the DNA condensation here is most likely an intramolecular process rather than an intermolecular one that should involve several DNA molecules during condensation.
From the above experimental results and discussion, we can delineate how the DNA condensation was induced by the PNA–ISCP conjugated molecules (Scheme 2). The conjugated molecule firstly binds to λ-DNA via base pairing recognition between its PNA segment and the complementary bases on the DNA chain. Such a binding leads to the accumulation of PNA–ISCP molecules on the DNA chain, thus increasing their local concentration. Once a critical concentration is reached, the self-aggregation of the ISCP segments will occur under help of ionic bonding, hydrogen bonding, and hydrophobic interactions. This self-aggregation process finally causes the DNA chain fold into a condensed form. Therefore, the DNA condensation induced by the PNA–ISCP molecules is a highly cooperative process that involves several noncovalent forces, and the DNA condensates here resemble PNA–ISCP/DNA supramolecular assemblies. In such a condensing mechanism, the accumulation of PNA–ISCP molecules on DNA allows their local concentration to rapidly rise above the critical concentration for initiating their self-aggregation. This is why the PNA–ISCP conjugates can compact DNA with an intramolecular profile at low micromole concentrations.
As known, besides DNA condensation, high transfection efficiency needs also other key elements including both easy cellular uptake of the condensates and efficient release of the gene inside cells. Usually more positive charges of the DNA condensers are suggested to facilitate the cellular uptake, though the increased positive charge density may lead to high cytotoxicity. In the present case, the PNA–ISCP molecules have a net charge of zero and their complexes with DNA are negatively charged, which is supposed to be unfavorable for cellular uptake. Currently, research is undergoing to introduce a certain amount of positive charges into the PNA–peptide conjugates, aiming to find a system with optimized transfection efficiency and low cytotoxicity. Moreover, efforts are also made to understand the disaggregating behavior of the DNA/PNA–ISCP condensates as well as the condensation reversibility so as to get control over the gene release inside cells.
4. Conclusion
In summary, we have developed a new type of DNA condenser with a PNA–ISCP conjugated structure. Such a structural design combines the high hybridization affinity and specificity of PNA for DNA as well as the high self-aggregation propensity of ISCPs, causing efficient DNA condensation at low micromole concentrations. The condensation was demonstrated to be a cooperative process that involves the base pair recognition between DNA and the PNA segment and the self-aggregation of the peptide segment. The conjugated molecules firstly bind to DNA via Watson–Crick hydrogen bonding and π–π stacking between the PNA segment and the complementary bases of a DNA chain. Driven by ionic bonding, hydrogen bonding, and hydrophobic interactions between the ISCP segments, the self-aggregation of the bound PNA–ISCP molecules then causes the DNA chain to compact into a condensed form. Such a specific condensing mechanism opens a window for developing novel DNA condensing agents. Moreover, the nature of the condensing agents affects DNA condensing routes and the physicochemical properties of the condensates,36,37 and consequently determines the cell uptake of the condensates and transfection efficiency.12 There are also reports that demonstrate improved delivery and antisense effects for PNA–peptide conjugates.38,39 These effects are suggested to be well explored using the PNA–ISCP/DNA complexes.Conflict of interest
The authors declare no competing financial interest.Acknowledgements
The authors give great thanks to Prof. Jian R. Lu for his great help in materials preparation and experimental design. This work was supported by the National Natural Science Foundation of China (21473255, 21003160), and the Fundamental Research Funds for the Central Universities (14CX05040A).References
- M. A. Mintzer and E. E. Simanek, Chem. Rev., 2008, 109, 259–302 CrossRef PubMed.
- J. Widom and R. L. Baldwin, J. Mol. Biol., 1980, 144, 431–453 CrossRef CAS PubMed.
- D. Baigl and K. Yoshikawa, Biophys. J., 2005, 88, 3486–3493 CrossRef CAS PubMed.
- V. Floch, S. Loisel, E. Guenin, A. C. Hervé, J. C. Clément, J. J. Yaouanc, H. des Abbayes and C. Férec, J. Med. Chem., 2000, 43, 4617–4628 CrossRef CAS PubMed.
- R. Dias, S. Mel'nikov, B. Lindman and M. G. Miguel, Langmuir, 2000, 16, 9577–9583 CrossRef CAS.
- M. W. Cao, M. L. Deng, X. L. Wang and Y. L. Wang, J. Phys. Chem. B, 2008, 112, 13648–13654 CrossRef CAS PubMed.
- Y. Zhu, G.-P. Tang and F.-J. Xu, ACS Appl. Mater. Interfaces, 2013, 5, 1840–1848 CAS.
- H. Petersen, K. Kunath, A. L. Martin, S. Stolnik, C. J. Roberts, M. C. Davies and T. Kissel, Biomacromolecules, 2002, 3, 926–936 CrossRef CAS PubMed.
- K. Luo, C. Li, L. Li, W. She, G. Wang and Z. Gu, Biomaterials, 2012, 33, 4917–4927 CrossRef CAS PubMed.
- K. Fant, E. K. Esbjörner, P. Lincoln and B. Nordén, Biochemistry, 2008, 47, 1732–1740 CrossRef CAS PubMed.
- A. M. Carnerup, M.-L. Ainalem, V. Alfredsson and T. Nylander, Langmuir, 2009, 25, 12466–12470 CrossRef CAS PubMed.
- R. Sharma, S. Shivpuri, A. Anand, A. Kulshreshtha and M. Ganguli, Mol. Pharmaceutics, 2013, 10, 2588–2600 CrossRef CAS PubMed.
- P. Saccardo, A. Villaverde and N. González-Montalbán, Biotechnol. Adv., 2009, 27, 432–438 CrossRef CAS PubMed.
- A. Estevez-Torres and D. Baigl, Soft Matter, 2011, 7, 6746–6756 RSC.
- S. M. Mel'nikov, V. G. Sergeyev and K. Yoshikawa, J. Am. Chem. Soc., 1995, 117, 2401–2408 CrossRef.
- S. M. Mel'nikov, V. G. Sergeyev and K. Yoshikawa, J. Am. Chem. Soc., 1995, 117, 9951–9956 CrossRef.
- R. Dias, M. Rosa, A. C. Pais, M. Miguel and B. Lindman, J. Chin. Chem. Soc., 2004, 51, 447–469 CrossRef CAS.
- L. Moreau, P. Barthelemy, Y. Li, D. Luo, C. A. H. Prata and M. W. Grinstaff, Mol. BioSyst., 2005, 1, 260–264 RSC.
- P. Chabaud, M. Camplo, D. Payet, G. Serin, L. Moreau, P. Barthélémy and M. W. Grinstaff, Bioconjugate Chem., 2006, 17, 466–472 CrossRef CAS PubMed.
- E. Henke, J. Perk, J. Vider, P. de Candia, Y. Chin, D. B. Solit, V. Ponomarev, L. Cartegni, K. Manova, N. Rosen and R. Benezra, Nat. Biotechnol., 2008, 26, 91–100 CrossRef CAS PubMed.
- P. Nielsen, M. Egholm, R. Berg and O. Buchardt, Science, 1991, 254, 1497–1500 CAS.
- S. K. Kim, P. E. Nielsen, M. Egholm, O. Buchardt, R. H. Berg and B. Norden, J. Am. Chem. Soc., 1993, 115, 6477–6481 CrossRef CAS.
- S. Zhang, T. Holmes, C. Lockshin and A. Rich, Proc. Natl. Acad. Sci. U. S. A., 1993, 90, 3334–3338 CrossRef CAS.
- H. Yokoi, T. Kinoshita and S. Zhang, Proc. Natl. Acad. Sci. U. S. A., 2005, 102, 8414–8419 CrossRef CAS PubMed.
- M. Cao, N. Wang, P. Zhou, Y. Sun, J. Wang, S. Wang and H. Xu, Sci. China: Chem., 2016, 59, 310–315 CrossRef CAS.
- W.-B. Fu, X.-L. Wang, X.-H. Zhang, S.-Y. Ran, J. Yan and M. Li, J. Am. Chem. Soc., 2006, 128, 15040–15041 CrossRef CAS PubMed.
- V. Vijayanathan, T. Thomas, A. Shirahata and T. J. Thomas, Biochemistry, 2001, 40, 13644–13651 CrossRef CAS PubMed.
- C. A. H. Prata, X.-X. Zhang, D. Luo, T. J. McIntosh, P. Barthelemy and M. W. Grinstaff, Bioconjugate Chem., 2008, 19, 418–420 CrossRef CAS PubMed.
- T. T. Do, V. J. Tang, J. A. Aguilera, C. C. Perry and J. R. Milligan, Biomacromolecules, 2011, 12, 1731–1737 CrossRef CAS PubMed.
- C. Ceballos, C. A. H. Prata, S. Giorgio, F. Garzino, D. Payet, P. Barthélémy, M. W. Grinstaff and M. Camplo, Bioconjugate Chem., 2009, 20, 193–196 CrossRef CAS PubMed.
- R. Sarkar and S. K. Pal, Biomacromolecules, 2007, 8, 3332–3339 CrossRef CAS PubMed.
- J. B. Lepecq and C. Paoletti, J. Mol. Biol., 1967, 27, 87–106 CrossRef CAS PubMed.
- Z. Dai and C. Wu, Macromolecules, 2012, 45, 4346–4353 CrossRef CAS.
- M. Egholm, O. Buchardt, L. Christensen, C. Behrens, S. M. Freier, D. A. Driver, R. H. Berg, S. K. Kim, B. Norden and P. E. Nielsen, Nature, 1993, 365, 566–568 CrossRef CAS PubMed.
- M. Anderson, O. V. Bocharova, N. Makarava, L. Breydo, V. V. Salnikov and I. V. Baskakov, J. Mol. Biol., 2006, 358, 580–596 CrossRef CAS PubMed.
- C. Plank, M. X. Tang, A. R. Wolfe and F. C. Szoka Jr, Hum. Gene Ther., 1999, 10, 319–332 CrossRef CAS PubMed.
- M. X. Tang and F. C. Szoka, Gene Ther., 1997, 4, 823–832 CAS.
- M. Eriksson, P. E. Nielsen and L. Good, J. Biol. Chem., 2002, 277, 7144–7147 CrossRef CAS PubMed.
- M. Pooga, U. Soomets, M. Hallbrink, A. Valkna, K. Saar, K. Rezaei, U. Kahl, J.-X. Hao, X.-J. Xu, Z. Wiesenfeld-Hallin, T. Hokfelt, T. Bartfai and U. Langel, Nat. Biotechnol., 1998, 16, 857–861 CrossRef CAS PubMed.
Footnote |
| † Electronic supplementary information (ESI) available: Fig. S1–S7 including AFM images of λ-DNA in the presence of T′T′T′ and (AKAE)2, AFM images of λ-DNA condensates induced by CTAB and PEI, polyacrylamide gel electrophoresis of d(A)36 and the T′3–(AKAE)2/d(A)36 complexes, CD spectrum of T′3–(AKAE)2 (10.0 μM), AFM images of λ-DNA in the presence of T′3–(IKIE)2 and A′3–(AKAE)2, EtBr displacement results by A′3–(AKAE)2 and T′3–(IKIE)2, and the size distribution of λ-DNA and PNA–ISCP/DNA globules from AFM measurements. See DOI: 10.1039/c6ra26329a |
| This journal is © The Royal Society of Chemistry 2017 |

