 Open Access Article
Creative Commons Attribution 3.0 Unported Licence
CuZrO3 nanoparticles catalyst in aerobic oxidation of vanillyl alcohol
Subrata Saha and
Sharifah Bee Abd Hamid *
*
Nanotechnology and Catalysis Research Center (NANOCAT), University of Malaya, Kuala Lumpur 50603, Malaysia. E-mail: sharifahbee@um.edu.my; Fax: +60 379676956; Tel: +60 379676959
First published on 3rd February 2017
Abstract
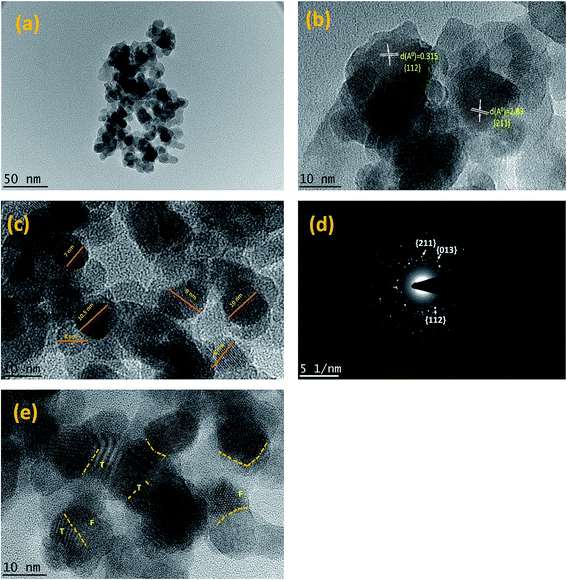
A highly crystalline, mesoporous and perovskite type CuZrO3 nanoparticles catalyst was prepared via a simple and facile one pot solvent evaporation method. The crystal planes (112) and (211) of CuZrO3 were evidenced in HRTEM and SAED imagery by their lattice parameters, 2.83 and 3.15 Å. Also, the crystallite size of synthesized catalyst was measured in a range of 7–10 nm. The catalyst was superior as it possessed many physiochemical properties to perform a liquid phase aerobic oxidation of vanillyl alcohol to selectively produce vanillin under base free conditions. Catalytic activity of the synthesized perovskite type CuZrO3 catalyst was substantially improved by the presence of surface oxygen vacancies speculated in O 1s spectra. Furthermore, a O2-TPD technique was applied to understand the role of surface oxygen vacancy in enhancing catalytic activity. Moreover, numerous partial and full lattice dislocated grain boundaries were observed as a form of structural defects between different planes in HRTEM imagery. The redox capability of this superior catalyst was significantly enriched by the high content of Zr loading and confirmed by low temperature reduction in H2-TPR analysis. Excellent catalytic behavior of CuZrO3 (Cu:2Zr) catalyst (91% conversion and 76% selectivity to vanillin) in liquid phase aerobic oxidation was well correlated with the structural and chemical properties of the catalyst. Moreover, the catalyst was stable for four consecutive oxidation reactions without appreciable loss of catalytic activity.
Introduction
Catalytic upgradation of lignocellulosic biomass is a recent great challenge due to its complexity associated with structure and recalcitrance to transformation.1 Extensive research has been explored in past decades for valorization of carbon-based biomass constituents.2–7 Lignin is one of the less used biomass constituents due to its polymeric complex structure which limits potential applications of it in a wide range of applications. In order to create sustainable bio refineries, it is very crucial to develop a suitable catalyst system to transform the lignin fraction of biomass into selective value added products because 30% carbon and 40% of the energy content of lignocellulosic biomass constituents are lignin.8Since lignin contains a large concentration of hydroxyl groups, it is viable to oxidize or cause oxidative polymerization of targeted products with environmental friendly oxidants such as H2O2 or O2. Vanillyl alcohol is often considered to be one of the model compounds representing lignin since its structure is similar to one of the building block units of lignin.9–13 Selective oxidative products of vanillyl alcohol are important platform chemicals in pharmaceutical and perfume industries and it is also used as a food grade flavor.14,15
Ma et al. summarized the homogeneous catalysts investigated for lignin valorization.16 Also, another group of researchers reviewed using unconventional media such as ionic liquids for lignin reactions.17 However, using ionic liquids or homogeneous catalysts has disadvantages of product separation and low selectivity although they offer good yields. Behling outlined in detail heterogeneous catalysts up to the present for oxidizing lignin and its model compounds.13 Numerous heterogeneous catalytic systems were investigated for such applications. Recently, Ajay jha et al. reported that three catalytic combinations of Co3O4, Mn–Co mixed oxide, and reduced graphene oxide promoted a Co–Mn catalyst for aerobic oxidation of vanillyl alcohol.18–20 This Co3O4 catalyst was found to be inactive without presence of the base NaOH. Using NaOH for oxidizing the alcohol caused formation of a hydroxyl bridged catalyst leading towards catalyst deactivation and production of large scale inorganic waste. Two other catalysts showed moderate catalytic activity with 62% conversion. Mariom et al. reported CoTiO3 catalyst using H2O2 resulted in catalytic activity of 66% with a 6 h reaction time.9 Recently, Balachandra et al. reported preparation of nano Fe3O4@APTES@Ni (OH)2 catalyst with 73% conversion in a 8 h reaction time.21 Also, another group of researchers reported a carbon supported iron oxide catalyst with 86% selectivity for vanillyl alcohol oxidation.22 Though a few catalysts showed promising catalytic activity, longer reaction times using such oxidation reactions is an unfriendly economic process. Therefore, a genuine need exists for a catalyst with high yields under mild reaction conditions with base free reactions and a simplified synthesis protocol.
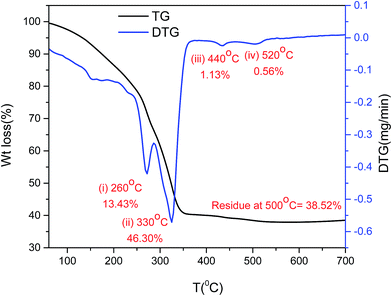
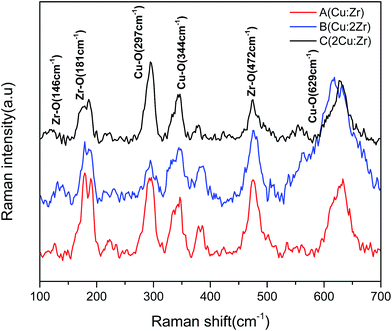
Mixed metal oxide catalysts are used with a wide range of potential applications owing to their electronic properties and unique redox properties.23 Cooperative oxide-based catalysts showed superior catalytic activity to their counterparts with single phase. Cu-based mixed oxide catalysts showed promising catalytic activity in various oxidation reactions such as oxidation of the volatile organic compounds ethanol and toluene, plus CO oxidation24–27 and also oxidation of lignin.13 Perovskite structured oxides especially have been widely and effectively used in hydrogenations of hydrocarbons, and also for oxidation purposes such as CO oxidation, ammonia oxidations, and catalytic combustion.28–36 A large number of literature references previously reported the intimate relation of defect chemistry introduced by perovskite type oxide catalysts to their catalytic activity.37–42 Thus, catalytic activity of a perovskite structured mixed oxide catalyst was notably improved by creating a large concentration of surface defect oxygens in its structure, which benefited the oxidation process. Therefore, in this study we designed a perovskite type CuZrO3 catalyst prepared via a one pot simple and facile solvent evaporation method. Also, to enrich the concentration of surface oxygen vacant sites in the catalyst, we introduced trifluoroacetic acid (TFA) to the synthesis protocol. Emy et al. reported addition of TFA in a TiO2 lattice during calcination notably improved the concentration of surface oxygen vacancies by charge neutrality.43 Ali Ehsan et al. previously reported a CuZrO3–CuO composite phase on thin films.44 Moreover, catalytic activity of the CuZrO3 catalysts was tested in liquid phase oxidation of vanillyl alcohol using an environmentally benign oxygen source. To the best of our knowledge, that is the pioneer report for using a perovskite type CuZrO3 catalyst to oxidize vanillyl alcohol using green oxidant air. Various characterization techniques such as TG, XRD, RAMAN, XPS, FESEM, HRTEM, SAED, H2-TPR, and O2-TPD were employed to examine formation of the CuZrO3 phase, physiochemical and textural properties such as the phase, crystallinity, electronic state, morphology, and redox properties and their influence in the catalytic action in the vanillyl alcohol oxidation. In addition, reusability of the CuZrO3 catalyst was also studied in a vanillyl alcohol aerobic oxidation.
Experimental
All chemicals were purchased from various commercial sources and used without further purification. These include copper(II) acetate monohydrate (Sigma-Aldrich, 98%) zirconium(IV) butoxide (80 wt% in 1-butanol), vanillyl alcohol (Sigma-Aldrich, 98%), vanillin (Sigma-Aldrich, 97%), vanillic acid (Sigma-Aldrich, 97%), guaiacol (Sigma-Aldrich, 98%) hydrogen peroxide (30% in H2O) (Sigma-Aldrich solution 30% in water), and acetic acid (Merck, 96%), tetrahydrofuran (Sigma-Aldrich, 99.8%), and NaOH (Merck).Catalyst preparation
Three different catalysts with three different ratios of Cu and Zr precursors were synthesized by following a simple one pot solution method. First, copper(II) acetate (0.79 g, 4 mmol) was dissolved in 30 mL tetrahydrofuran in a 100 mL Schenk flask. After cupper(II) acetate was completely dissolved, 1.15 g (4 mmol) of zirconium butoxide {Zr(dmae)4} was added dropwise followed by addition of a few drops of trifluoroacetic acid to lower the pH (<3.5). Then, the reaction mixture was kept for 4 h to complete the reaction and the color of the solution turned from blue to light blue. The solvent was removed from the reaction mixture under vacuum. The material was ground to a powder and followed by calcination at 500 °C in air at a heating rate of 2 °C min−1. The prepared catalyst was labeled as catalyst A (Cu![[thin space (1/6-em)]](https://www.rsc.org/images/entities/char_2009.gif) :
:![[thin space (1/6-em)]](https://www.rsc.org/images/entities/char_2009.gif) Zr). Two other catalysts labeled as Catalyst B (Cu:2Zr) and C (2Cu:Zr) were also synthesized following a similar synthesis technique by changing the concentration of zirconium butoxide (8 mmol) and copper acetate (8 mmol) respectively, in each catalytic system. Furthermore, a catalyst with composition of (Cu:2Zr) was also prepared without addition of trifluoroacetic acid.
Zr). Two other catalysts labeled as Catalyst B (Cu:2Zr) and C (2Cu:Zr) were also synthesized following a similar synthesis technique by changing the concentration of zirconium butoxide (8 mmol) and copper acetate (8 mmol) respectively, in each catalytic system. Furthermore, a catalyst with composition of (Cu:2Zr) was also prepared without addition of trifluoroacetic acid.
Characterization of CuZrO3 catalyst
Thermal analysis was carried out in a ceramic crucible on a PerkinElmer TGA 4000 Thermogravimetric Analyzer connected with a computer interface. Pure air with a flow rate of 30 cm3 min−1 was passed continuously at a heating rate of 10 °C min−1 under atmospheric pressure. The X-ray diffractograms of prepared catalysts were recorded on a D8 Advance X-ray diffraction-Bruker AXS using Cu Kα radiation (d = 1.54 Å) in range of Bragg angle 5° to 90° with a step size of 0.026/min. During the analysis, the voltage and the current density were maintained at 40 kV and 40 mA respectively, at ambient temperature. Surface morphology analysis was performed by field emission scanning microscopy (FESEM Quanta FEI 200F) and elemental composition analysis was measured by energy dispersive X-ray spectroscopy (INCA Software) attached to the FESEM. Nitrogen adsorption desorption measurements were carried out on a Micrometric ASAP 2010 instrument at −196 °C. The catalysts were first degassed at 150 °C for 5 h before analysis. Lattice spacing and selected area electron diffraction (SAED) patterns were collected using high-resolution transmission electron microscopy (HR-TEM, JEM 2100-F) at a constant voltage of 200 keV.Temperature programmed reductions and oxidations were performed on a Micrometrics Chemisorb 1100 series instrument. Before analysis, surface moisture from 0.2 g catalyst was removed via pretreatment at 180 °C for 1 h by N2 gas (20 mL min−1). Then, the analysis was carried out under process conditions until 900 °C under gas flow of 5% H2 with 95% N2 mixtures at a heating rate of 10 °C min−1 and was held for 10 min. The reduced sample also was further re-oxidized to investigate the oxidation steps of the catalyst at the same temperature programme. ICP-MS analysis of the reaction mixture was performed before and after a catalytic reaction following the method ASTM-D5185 using a PerkinElmer NexION 350S series.
Catalytic activity measurement
Liquid phase aerobic oxidation was performed in a high pressure 200 mL autoclave reactor supplied by Parr Co. In a typical aerobic oxidation reaction, 3 mmol vanillyl alcohol was dissolved in 60 mL acetonitrile with a catalyst loading of 0.0025 g cm−3 while the reactor temperature and pressure were kept at 120 °C and 21 bar air pressure, respectively. The oxidative products were collected by a syringe filter after every half an hour interval and analyzed by an Agilent Technology HPLC Chromatography 1100 series instrument connected to a UV detector and computer interface. A mixture of solvent (85% water + 15% acetonitrile) with 1% acetic acid was used as the mobile phase with a Zobrax RP-C18 column. The products and substrate were successfully detected by a UV detector at ƛmax = 270 nm. The column temperature was stable at 28 °C with a flow rate of 1 mL min−1.Results and discussions
Catalyst characterizations
![[1 with combining macron]](https://www.rsc.org/images/entities/char_0031_0304.gif) ) and (111) of CuO. Hence, the catalyst was synthesized as a highly crystalline perovskite shaped CuZrO3 catalyst with a minor phase of CuO and with no other impurities. In addition, the orthorhombic shape having the cell parameters (a = 6.4465 Å, b = 7.4008 Å, and c = 8.3128 Å) varied from the typical cubic shape of a perovskite structure (a = 3.905 Å). This fact indicates displacement of the B cation (Zr) introducing distortions in the domain of the perovskite crystal.45 This phenomenon would imply appreciable surface defects in the material which is one of the clues to the significant catalytic activity of the perovskite type mixed CuZrO3 catalyst.
) and (111) of CuO. Hence, the catalyst was synthesized as a highly crystalline perovskite shaped CuZrO3 catalyst with a minor phase of CuO and with no other impurities. In addition, the orthorhombic shape having the cell parameters (a = 6.4465 Å, b = 7.4008 Å, and c = 8.3128 Å) varied from the typical cubic shape of a perovskite structure (a = 3.905 Å). This fact indicates displacement of the B cation (Zr) introducing distortions in the domain of the perovskite crystal.45 This phenomenon would imply appreciable surface defects in the material which is one of the clues to the significant catalytic activity of the perovskite type mixed CuZrO3 catalyst.
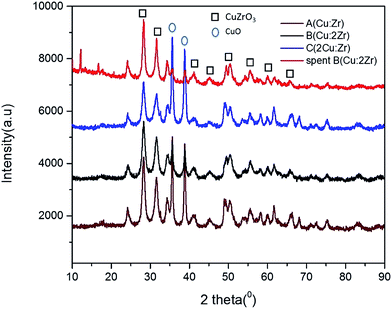 | ||
| Fig. 2 The XRD pattern of catalyst A (Cu:Zr), catalyst B (Cu:2Zr), catalyst C (2Cu:Zr) and spent catalyst B (Cu:2Zr). | ||
The reused catalyst B (Cu:2Zr) was also characterized by XRD to detect any change in the phase, chemical composition, and crystallinity. There was no change observed in the phase and chemical composition as the recorded XRD fingerprints for spent catalyst showed the same pattern as the fresh catalyst based on peak location at Bragg angle. However, the crystallinity was slightly reduced relative to the fresh catalyst after performing the catalytic reaction.
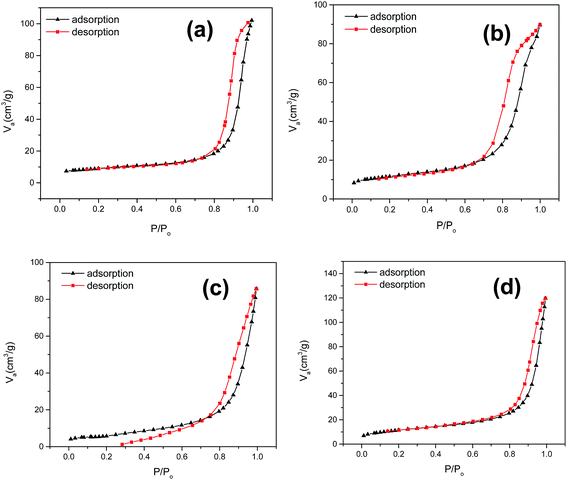 | ||
| Fig. 4 N2 adsorption–desorption curve for (a) catalyst A (Cu:Zr); (b) catalyst B (Cu:2Zr); (c) catalyst C (2Cu:Zr); (d) spent catalyst B (Cu:2Zr). | ||
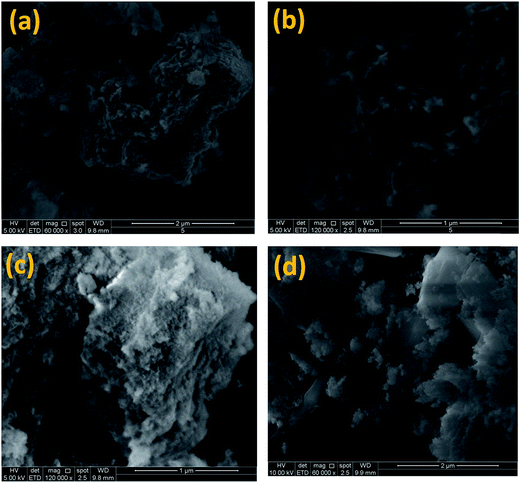 | ||
| Fig. 5 Topography of CuZrO3 catalysts. (a) Catalyst A (Cu:Zr); (b) catalyst B (Cu:2Zr); (c) catalyst C (2Cu:Zr); (d) spect catalyst B. | ||
Furthermore, high resolution TEM equipped with SAED was used to observe presence of the CuZrO3 crystal phase in terms of d spacing (Å) for catalyst B (Cu:2Zr) (Fig. 6). Image (Fig. 6b) of the catalyst B (Cu:2Zr) confirms the miller planes of (112) and (211) of the CuZrO3 nanocrystalline domain with d spacing of 2.83 Å and 3.15 Å, respectively. In addition, the image shows presence of numerous grain boundaries between the lattice planes accommodated by the lattice dislocations (Fig. 6b). Grain boundaries dislocations observed in CuZrO3 catalyst consist of two types: full dislocation (labelled as F) and partial dislocation (labelled as T) which lead to stalking faults (Fig. 6e).50 It was postulated that grain boundaries in the form of surface defects can increase the catalytic activity substantially because it acts as a trapping site in the catalyst.51–54 Moreover, the average crystallite sizes of the CuZrO3 catalyst (Cu:2Zr) were measured from the observed images and determined to be in the range of 7 to 10 nm (Fig. 7c). The selective area electron diffraction pattern (SAED) was applied to further support the lattice parameters (d spacing) of the CuZrO3 catalyst (Cu:2Zr) (Fig. 6d). Diffused rings with bright spots in the SAED pattern revealed that the catalyst was polycrystalline. In addition, the bright spots observed in the SAED pattern correspond to the plane index of (112), (211), and (013) of a CuZrO3 nanocrystalline catalyst.
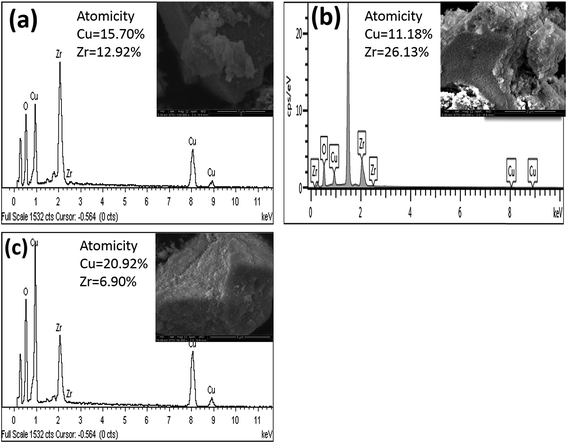
Additionally, the EDX spectrum of synthesized CuZrO3 catalysts with different metal loadings was acquired to confirm the elemental composition (Fig. 7). The observed percentage of atomicity tentatively confirms the elemental ratio of Cu and Zr loaded in the catalyst synthesis protocol.
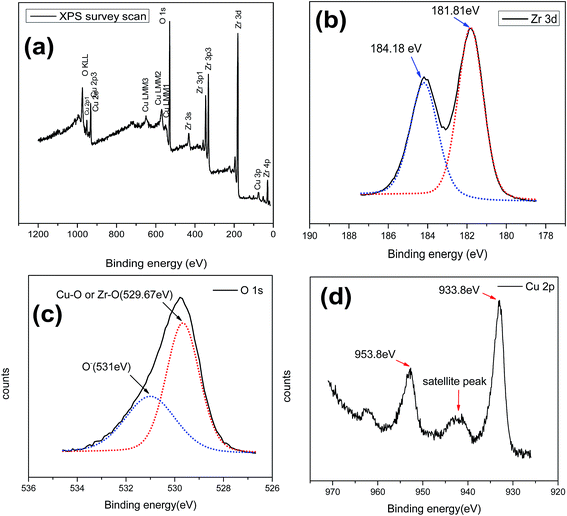 | ||
| Fig. 8 XPS spectra of mixed oxide CuZrO3 catalyst (Cu:2Zr). (a) Survey spectrum of CuZrO3 (b) Zr 2p (c) O 1s (d) Cu 2p. | ||
| Cu (%) | Zr (%) | O (%) |
|---|---|---|
| 8.06 | 25.41 | 66.39 |
| Lattice oxygen (%) | Surface oxygen (%) |
|---|---|
| 60.30 | 39.70 |
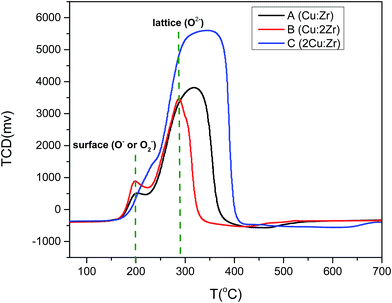
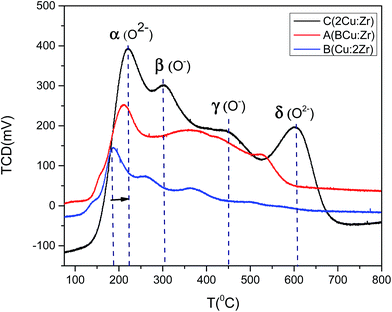
To further evaluate catalyst activation and O2 desorption behavior, O2-TPD was investigated (Fig. 10). We speculated that oxidation of the catalyst took place in four distinctive steps denoted by α, β, γ, and δ. The oxidation peak at the lower temperature around 180–210 °C was possibly due to the desorption of physiosorbed (O2−) species at the present surface oxygen vacant sites as suggested by O 1s XPS spectra. Hence, the α peak in the TPD profile was attributed to O2−. Oxygen desorption at (O−) species occurred at comparatively higher temperatures (>400 °C) than O2− species (<300 °C). So, it was reasonable to assign β and γ peaks to O− species. The δ desorption peak could be attributed to the lattice oxygen species as it required a high temperature (>800 °C). It is worthwhile mentioning that the oxygen desorption peak at low temperature for catalyst B with high content of Zr was greatly shifted towards a lower temperature. That was indicative of enhancement of the oxygen mobility on the surface of the catalyst which facilitated the redox ability. This phenomenon could considerably enhance the catalytic activity observed for catalyst B (Fig. 15). In addition, the oxygen uptake at lower temperatures for catalyst B was greater (566 μmol g−1) than catalyst C (522 μmol g−1) and catalyst A (285 μmol g−1). Based on the amount of oxygen desorption, we conclude that catalyst B contains the highest degree of physiosorbed (O2−) species associated with surface defects at low temperature which notably improved the catalytic activity. Therefore, the oxygen adsorption occurs in the following sequence based on the O2-TPD profile:
| O2(ad) → O2−(ad) → O−(ad) → O2−(lattice) |
Catalytic activity
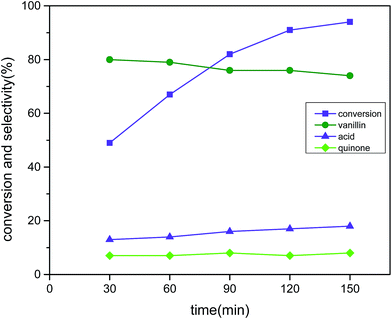
The catalyst CuZrO3 (Cu:2Zr) was considered to optimize reaction parameters such as catalyst loading, time, temperature, and pressure in aerobic oxidation of vanillyl alcohol in base-free conditions. Acetonitrile was chosen as the solvent as it showed promising catalytic activity for other catalysts in an aerobic oxidation of vanillyl alcohol.20 We prepared two other catalysts labeled as catalyst A (Cu:Zr) and catalyst C (2Cu:Zr) which were also experimented with at determined suitable reaction conditions. A blank reaction was also carried out without the presence of a catalyst and no conversion was observed. This implied that the oxidation reaction does not proceed in absence of a catalyst.The progress of the reaction was recorded after every half an hour time interval until the reaction time reached 2.5 hours and the results are displayed in Fig. 11 (reaction conditions: 3 mmol vanillyl alcohol, 21 bar air pressure, 0.0025 g cm−3 catalyst B (Cu:2Zr), 120 °C). The catalytic activity was improved as expected at a precipitous rate with the increase of time until 2 hours of reaction time. The conversion was measured as 91% conversion with 76% selectivity with a reaction time of 2 h. Thereafter, the reaction progress was not significant as only enrichment of 2% in conversion was produced due to the formation of 2-methoxy benzoquinone, which is a well-known radical trapping agent that can decrease the rate of reaction. Thus, 2 hours was chosen as the optimum reaction time. It is noteworthy that vanillic acid (17%) and quinone (7%) were found as the only detected side products by HPLC analysis. The perovskite type CuZrO3 catalyst was outstanding for improving catalytic conversion by aerobic oxidation of vanillyl alcohol as compared with other previously reported literature references under short reaction times.21,22
To examine the obvious influence of catalyst loading, catalyst (Cu:2Zr) mass in a range 0.0012 g cm−3 to 0.0050 g cm−3 was considered (reaction conditions: 3 mmol vanillyl alcohol, 21 bar air pressure, 120 °C, 2 h) (Fig. 12). A steep improvement in the catalytic conversion to 91% from 63% was observed while the catalyst loading was changed to 0.0025 g cm−3 from 0.0012 g cm−3. However, further increments in the catalyst loading up to 0.0050 g cm−3 was observed not to promote noticeable catalytic conversion. This was due to the earlier mentioned fact of mass transfer resistance.61 Noteworthy, the selectivity (76%) was not affected by changes in the catalyst loading.
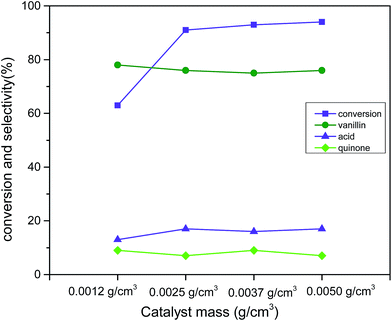 | ||
| Fig. 12 Effect of catalyst loading (Cu:2Zr) on conversion and selectivity in aerobic oxidation. Reaction conditions: 3 mmol vanillyl alcohol, 60 mL acetonitrile, 21 bar air pressure, 120 °C, 2 h. | ||
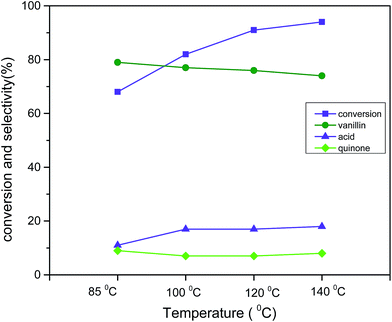
The apparent response in catalytic activity with respect to temperature was investigated in range of 85 °C to 140 °C (reaction condition: 3 mmol vanillyl alcohol, 21 bar air pressure, 0.0025 g cm−3 catalyst B (Cu:2Zr), 2 h) (Fig. 13). The catalytic conversion was substantially improved to 94% from 68% when the temperature was elevated from 85 °C to 140 °C. However, the selectivity slightly decreased by 5% from the initial selectivity (79%) with that increment of temperature. This was possibly due to next step-oxidation of the product vanillin to its corresponding acid at higher temperatures. It was worthwhile mentioning that char formation was observed at the high temperature 140 °C. Therefore, 120 °C was considered the best temperature for liquid phase aerobic oxidation of vanillyl alcohol. The obtained reaction temperature 120 °C with 91% conversion was comparatively lower than in other reports.20 This clearly evidenced that a perovskite type CuZrO3 catalyst prepared via the solvent evaporation technique was superior in terms of catalytic activity at mild reaction conditions.
Air pressure was found to be the vital determinant to obtain superior catalytic activity from 7 bar to 28 bar (reaction condition: 3 mmol vanillyl alcohol, 0.0025 g cm−3 catalyst B (Cu:2Zr), 120 °C, 2 h) (Fig. 14). The pressure was changed from 7 bar to 14 bar, and the conversion was enriched to 79% from 66%, but a drop in the selectivity to 78% from 81% resulted for vanillin. When the pressure was increased to 21 bar air pressure, excellent catalytic activity was measured at 91% conversion with 76% selectivity to vanillin. Further rise in the air pressure was found to be detrimental to the selectivity (71%) but to the contrary, conversion was further improved up to 96%. The slight drop in the selectivity was associated with the over-oxidation of vanillin to vanillic acid in presence of excess desorbed oxygen in the solvent. Based on the experimental data, 21 bar air pressure was selected as the optimum pressure for liquid phase aerobic oxidation of vanillyl alcohol.
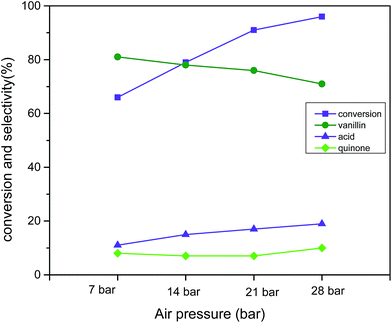 | ||
| Fig. 14 Effect of air pressure on conversion and selectivity in aerobic oxidation. Reaction conditions: 3 mmol vanillyl alcohol, 60 mL acetonitrile, 120 °C, catalyst mass (Cu:2Zr) 0.0025 g cm−3, 2 h. | ||
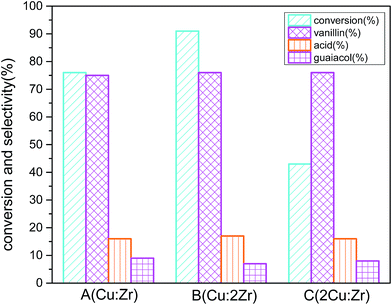
The prepared catalysts A (Cu:Zr), B (Cu:2Zr), and C (2Cu:Zr) were tested for oxidation of vanillyl alcohol at the obtained reaction conditions (Fig. 15). To rationalize, commercially available pure CuO, ZrO2, and catalyst (Cu:2Zr) prepared without TFA were also used as catalysts at the same conditions as catalyst B (Cu:2Zr). Isolated CuO catalyst showed 4% conversion with 72% selectivity and 6% conversion with 68% selectivity for ZrO2. And, catalysts synthesized without the addition of trifluoroacetic acid showed catalytic conversion of 41% with 71% selectivity. Interestingly, the synthesized catalysts showed more improved catalytic action than their counterpart single oxide catalysts. For catalyst A (Cu:Zr), conversion (67%) with selectivity (75%) was achieved. When catalyst B (Cu:2Zr) was used, the best conversion (91%) with selectivity (76%) was obtained. The least conversion (43%) with selectivity (76%) was observed in the case of catalyst C (2Cu:Zr). It is worth noting that the selectivity towards vanillin in the case of all prepared catalysts was almost the same because the same XRD fingerprint was identified in the catalysts with different ratios. Comparison of catalytic activity of synthesized catalyst B (Cu:2Zr) with and without TFA indicated that introduction of TFA in the synthesis step induced formation of more surface oxygen vacancies as evident in O 1s XPS spectra and O2-TPD. Thus, catalytic conversion was substantially enriched when the surface oxygen vacant sites were present in large concentrations on the catalyst. Surface oxygen vacant sites could hold various weakly bonded oxygen species on the surface which could possibly accelerate oxygen mobility from the catalyst surface to substrate. It is worth mentioning that the highest catalytic activity was obtained by catalyst B (Cu:Zr) and was due to the high content of ZrO2. High loading of ZrO2 could cause a large concentration of acidic sites on the surface to strongly interact with Cu2+ ion on the surface. Consequently, formation of a high degree of Cu–O–Zr active phase occurred in the catalyst and it was presumed that Cu–O–Zr was the active phase for oxidation of vanillyl alcohol. The catalytic activity of synthesized CuZrO3 catalyst could be due to presence of Cu+/Cu2+ and Zr3+/Zr4+ ion pairs generated by one electron transfer between these ions during O2 activation. These ions could form a metal superoxo intermediate (M–O–O·) reactive species by oxygen reduction on the catalyst for the selective oxidation of alcohol.62 Also, high dispersion of Cu on the ZrO2 in catalyst B (Cu:2Zr) minimizes the grain size to less than 10 nm and exposed numerous grain boundaries which were observed in the HRTEM micrograph (Fig. 6e). Furthermore, the order of catalytic performance (Cu:2Zr > Cu:Zr > 2Cu:Zr) was in good agreement with that of the above-mentioned BET surface area as a large surface area could offer exposure to many active sites to partake in the reaction.
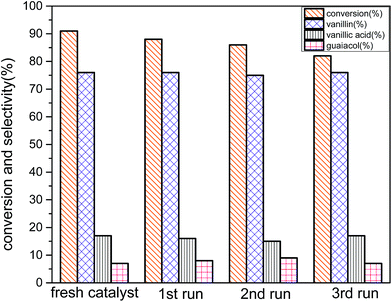
Stability of the catalyst was also examined using the reused catalyst for oxidation of vanillyl alcohol at the optimum reaction conditions (reaction conditions: 3 mmol vanillyl alcohol, 0.0025 g cm−3 catalyst B (Cu:2Zr), 21 bar air pressure, 85 °C, 4 h) (Fig. 16). After catalytic reaction, the catalyst was recovered by filtration and washed several times with acetonitrile to remove desorbed oxygenated products on the surface. The spent catalyst was dried at 80 °C for 4 hours. The subsequent reactions were carried out at the optimum reaction conditions following the similar recovery procedure. There was a slight loss of the catalytic activity in the recycled catalysts. However, the selectivity remained almost unchanged at 76% for all consecutive reactions. That indicated that similar reaction pathways were governed with all recycling experiments. Crystal phase was well preserved as in the fresh catalyst during a recycling procedure, so there was no obvious change in the amount of selectivity. But, the amount of conversion was decreased possibly owing to transformation of uneven surface to a plain surface after the catalytic reaction (Fig. 5d) and blockage on the active sites by un-desorbed oxygenated products.
Moreover, a leaching test was also conducted using ICP-MS analysis to investigate any leaching of metal ions into the reaction. Prior to starting the reaction, 0.5 dm3 reaction mixture was collected and the same procedure was followed after completing the reaction. The results indicated that there was no significant change (<0.01 ppm) in the presence of metal ions in the reaction mixture after the catalytic reaction; this suggested that there was no leeching of metal ions in the reaction. In summary, the one pot solvent evaporation technique was compared with other available techniques for preparation of Cu–Zr mixed oxides in Table 4.63–65
| Methods | Applications | Problems of available methods | Advantages of current method |
|---|---|---|---|
| Sol–gel nanocasting | Steam reforming of methanol | Complicated | One pot |
| Multiple steps | Facile | ||
| Co-precipitation | Partial oxidation of methane | Separate phase | Superior crystallinity |
| Low reducing ability | Small crystallite size | ||
| Chemical vapor deposition | Methanol oxidation | Thin films | Homogeneity of metals |
| Low catalytic activity | |||
| Current method (solvent evaporation) | Vanillyl alcohol oxidation | High catalytic activity | |
| Stable phase |
Conclusion
A simple and facile solvent evaporation method was effective for preparing a highly crystalline and mesoporous CuZrO3 nanoparticle catalyst with promising catalytic activity in liquid phase oxidation of vanillyl alcohol. The catalyst possessed a great amount of surface oxygen vacancies which improved the catalytic activity as testified by O 1s spectra and O2-TPD analysis. Moreover, higher loading of ZrO2 in the bulk phase of the catalyst contributed to formation of a large concentration Cu–O–Zr linkage as an active phase by the highest interaction of Cu with the ZrO2 lattice thus leading to the improved redox property of the catalyst in a H2-TPR profile. The highest catalytic activity was measured at 91% conversion and 76% selectivity to vanillin for catalyst CuZrO3 (Cu:2Zr) in liquid phase aerobic oxidation of vanillyl alcohol under mild reaction conditions.Acknowledgements
The authors are cordially grateful to Universiti Malaya grant GC001A-14AET for their financial support to accomplish this work. Also, the authors would like to thank Emy Marlina Samsudin for assistance in analysis of Raman spectrum.References
- C. Xu, R. A. D. Arancon, J. Labidi and R. Luque, Chem. Soc. Rev., 2014, 43, 7485–7500 RSC.
- A. Halilu, T. H. Ali, A. Y. Atta, P. Sudarsanam, S. K. Bhargava and S. B. Abd Hamid, Energy Fuels, 2016, 30, 2216–2226 CrossRef CAS.
- L. Hu, G. Zhao, W. Hao, X. Tang, Y. Sun, L. Lin and S. Liu, RSC Adv., 2012, 2, 11184–11206 RSC.
- J. N. Chheda, G. W. Huber and J. A. Dumesic, Angew. Chem., Int. Ed., 2007, 46, 7164–7183 CrossRef CAS PubMed.
- V. Nair and R. Vinu, J. Anal. Appl. Pyrolysis, 2016, 119, 31–39 CrossRef CAS.
- S. K. Hanson and R. T. Baker, Acc. Chem. Res., 2015, 48, 2037–2048 CrossRef CAS PubMed.
- P. J. Deuss and K. Barta, Coord. Chem. Rev., 2016, 306, 510–532 CrossRef CAS.
- P. T. Patil, U. Armbruster, M. Richter and A. Martin, Energy Fuels, 2011, 25, 4713–4722 CrossRef CAS.
- M. Shilpy, M. A. Ehsan, T. H. Ali, S. B. A. Hamid and M. E. Ali, RSC Adv., 2015, 5, 79644–79653 RSC.
- J. Pan, J. Fu and X. Lu, Energy Fuels, 2015, 29, 4503–4509 CrossRef CAS.
- S. Saha and S. B. A. Hamid, RSC Adv., 2016, 6, 96314–96326 RSC.
- S. Saha, S. B. A. Hamid and T. H. Ali, Appl. Surf. Sci., 2017, 394, 205–218 CrossRef CAS.
- R. Behling, S. Valange and G. Chatel, Green Chem., 2016, 18, 1839–1854 RSC.
- H. Priefert, J. Rabenhorst and A. Steinbüchel, Appl. Microbiol. Biotechnol., 2001, 56, 296–314 CrossRef CAS PubMed.
- G. Ravishankar, B. Suresh, P. Giridhar, S. R. Rao and T. S. Johnson, Capsicum: The genus Capsicum, 2003, pp. 96–128 Search PubMed.
- R. Ma, Y. Xu and X. Zhang, ChemSusChem, 2015, 8, 24–51 CrossRef CAS PubMed.
- G. Chatel and R. D. Rogers, ACS Sustainable Chem. Eng., 2013, 2, 322–339 CrossRef.
- A. Jha and C. V. Rode, New J. Chem., 2013, 37, 2669–2674 RSC.
- A. Jha, K. R. Patil and C. V. Rode, ChemPlusChem, 2013, 78, 1384–1392 CrossRef CAS.
- A. Jha, D. Mhamane, A. Suryawanshi, S. M. Joshi, P. Shaikh, N. Biradar, S. Ogale and C. V. Rode, Catal. Sci. Technol., 2014, 4, 1771–1778 CAS.
- P. B. Bhat and B. R. Bhat, New J. Chem., 2015, 39, 273–278 RSC.
- L. Geng, M. Zhang, W. Zhang, M. Jia, W. Yan and G. Liu, Catal. Sci. Technol., 2015, 5, 3097–3102 CAS.
- M. B. Gawande, R. K. Pandey and R. V. Jayaram, Catal. Sci. Technol., 2012, 2, 1113–1125 CAS.
- D. A. Aguilera, A. Perez, R. Molina and S. Moreno, Appl. Catal., B, 2011, 104, 144–150 CrossRef CAS.
- M. R. Morales, B. P. Barbero, T. Lopez, A. Moreno and L. E. Cadús, Fuel, 2009, 88, 2122–2129 CrossRef CAS.
- W. Li, M. Zhuang and J. Wang, Catal. Today, 2008, 137, 340–344 CrossRef CAS.
- J. Zhu and Q. Gao, Microporous Mesoporous Mater., 2009, 124, 144–152 CrossRef CAS.
- R. J. Voorhoeve, J. Remeika, P. Freeland and B. Matthias, Science, 1972, 177, 353–354 CAS.
- R. Voorhoeve, J. P. Remeika and D. Johnson, Science, 1973, 180, 62–64 CAS.
- R. Voorhoeve, J. Remeika and L. Trimble, Mater. Res. Bull., 1974, 9, 1393–1404 CrossRef CAS.
- R. Voorhoeve, L. Trimble and C. Khattak, Mater. Res. Bull., 1974, 9, 655–666 CrossRef CAS.
- P. Gallagher, D. Johnson and F. Schrey, Mater. Res. Bull., 1974, 9, 1345–1352 CrossRef CAS.
- K. Tabata and M. Misono, Catal. Today, 1990, 8, 249–261 CrossRef CAS.
- N. Guilhaume and M. Primet, J. Catal., 1997, 165, 197–204 CrossRef CAS.
- H. Tanaka, Catal. Surv. Asia, 2005, 9, 63–74 CrossRef CAS.
- S. Keav, S. K. Matam, D. Ferri and A. Weidenkaff, Catalysts, 2014, 4, 226–255 CrossRef.
- R. Voorhoeve, J. Remeika and L. Trimble, Ann. N. Y. Acad. Sci., 1976, 272, 3–21 CrossRef CAS.
- M. Islam, M. Cherry and L. Winch, J. Chem. Soc., Faraday Trans., 1996, 92, 479–482 RSC.
- Y. Teraoka, H.-M. Zhang and N. Yamazoe, Chem. Lett., 1985, 14, 1367–1370 CrossRef.
- Z. Yu, L. Gao, S. Yuan and Y. Wu, J. Chem. Soc., Faraday Trans., 1992, 88, 3245–3249 RSC.
- M. O'Connell, A. Norman, C. Hüttermann and M. Morris, Catal. Today, 1999, 47, 123–132 CrossRef.
- Y. Teraoka, M. Yoshimatsu, N. Yamazoe and T. Seiyama, Chem. Lett., 1984, 13, 893–896 CrossRef.
- E. M. Samsudin, S. B. A. Hamid, J. C. Juan, W. J. Basirun, A. E. Kandjani and S. K. Bhargava, Appl. Surf. Sci., 2016, 365, 57–68 CrossRef CAS.
- M. A. Ehsan, H. Khaledi, Z. Arifin and M. Mazhar, Polyhedron, 2015, 98, 190–195 CrossRef CAS.
- A. Reller and T. Williams, Chem. Br., 1989, 25, 1227–1230 CAS.
- M. Li, Z. Feng, P. Ying, Q. Xin and C. Li, Phys. Chem. Chem. Phys., 2003, 5, 5326–5332 RSC.
- H. Hagemann, H. Bill, E. Walker and M. François, Solid State Commun., 1990, 73, 447–451 CrossRef CAS.
- C. Perry, D. W. Liu and R. P. Ingel, J. Am. Ceram. Soc., 1985, 68, C-184–C-187 CrossRef.
- H. Tanaka and M. Misono, Curr. Opin. Solid State Mater. Sci., 2001, 5, 381–387 CrossRef CAS.
- L. Wang, J. Teng, P. Liu, A. Hirata, E. Ma, Z. Zhang, M. Chen and X. Han, Nat. Commun., 2014, 5, 4402 CAS.
- S. Royer, D. Duprez and S. Kaliaguine, J. Catal., 2005, 234, 364–375 CrossRef CAS.
- J.-G. Choi, J. R. Brenner, C. W. Colling, B. G. Demczyk, J. L. Dunning and L. T. Thompson, Catal. Today, 1992, 15, 201–222 CrossRef CAS.
- R. Vidruk, M. V. Landau, M. Herskowitz, M. Talianker, N. Frage, V. Ezersky and N. Froumin, J. Catal., 2009, 263, 196–204 CrossRef CAS.
- W. Choo and J. Y. Lee, Metall. Trans. A, 1982, 13, 135–140 CrossRef.
- J. Wang, T. J. Shi and X. Jiang, Nanoscale Res. Lett., 2009, 4, 240–246 CrossRef CAS PubMed.
- I.-H. Tseng, J. C. Wu and H.-Y. Chou, J. Catal., 2004, 221, 432–440 CrossRef CAS.
- T. Mathew, N. Shiju, K. Sreekumar, B. S. Rao and C. S. Gopinath, J. Catal., 2002, 210, 405–417 CrossRef CAS.
- M. Roberts, Chem. Soc. Rev., 1989, 18, 451–475 RSC.
- H. Deng, L. Lin and S. Liu, Energy Fuels, 2010, 24, 4797–4802 CrossRef CAS.
- T. Nitadori, T. Ichiki and M. Misono, Bull. Chem. Soc. Jpn., 1988, 61, 621–626 CrossRef CAS.
- R. Klaewkla, M. Arend and W. F. Hoelderich, A review of mass transfer controlling the reaction rate in heterogeneous catalytic systems, INTECH Open Access Publisher, 2011 Search PubMed.
- I. Fernández, J. R. Pedro, A. L. Roselló, R. Ruiz, I. Castro, X. Ottenwaelder and Y. Journaux, Eur. J. Org. Chem., 2001, 2001, 1235–1247 CrossRef.
- H. Purnama, F. Girgsdies, T. Ressler, J. H. Schattka, R. A. Caruso, R. Schomäcker and R. Schlögl, Catal. Lett., 2004, 94, 61–68 CrossRef CAS.
- M. Schmal, C. A. Perez, V. T. da Silva and L. F. Padilha, Appl. Catal., A, 2010, 375, 205–212 CrossRef CAS.
- M. A. Ehsan, A. S. Hakeem, H. Khaledi, M. Mazhar, M. M. Shahid, A. Pandikumar and N. M. Huang, RSC Adv., 2015, 5, 103852–103862 RSC.
| This journal is © The Royal Society of Chemistry 2017 |

