 Open Access Article
Creative Commons Attribution 3.0 Unported Licence
High sensitivity chlorogenic acid detection based on multiple layer-by-layer self-assembly films of chitosan and multi-walled carbon nanotubes on a glassy carbon electrode†
Wenxue Chengac,
Jianzhi Huanga,
Cheng Liua,
Qiang Zeng *a,
Yanli Tong*b,
Lishi Wanga and
Faliang Cheng*c
aSchool of Chemistry and Chemical Engineering, South China University of Technology, Guangzhou 510641, People's Republic of China. E-mail: ceqzeng@scut.edu.cn; chengfl@dgut.edu.cn; Tel: +86 20 87112906
bGuangdong No. 2 Provincial People's Hospital, Guangzhou 510317, People's Republic of China. E-mail: tongh2008@126.com
cGuangdong Engineering and Technology Research Center for Advanced Nanomaterials, Dongguan University of Technology, Dongguan 523808, People's Republic of China
First published on 20th January 2017
Abstract
A chlorogenic acid sensor based on a chitosan (CS) and multi-walled carbon nanotubes (MWCNTs) modified glassy carbon electrode (GCE) was fabricated via a layer-by-layer (LBL) self-assembly method. The prepared electrode exhibited excellent catalytic performance for chlorogenic redox reactions compared to the bare GCE. The effects of the number assembly layers, scan rate, pH of the supporting electrolyte and accumulation time on chlorogenic acid detection were optimized. Under the optimal conditions, the proposed sensor was significantly sensitive for the detection of chlorogenic acid and showed wide linear detection ranges at low concentrations from 2 × 10⁻⁸ to 1 × 10⁻⁷ mol dm−3 and at high concentrations from 1 × 10⁻⁷ to 2.25 × 10⁻⁴ mol dm−3. The detection limit was estimated to be 1.16 × 10⁻⁸ mol dm−3 (S/N = 3). Furthermore, the chlorogenic acid sensor exhibited excellent selectivity and stability and was utilized in practical applications, in particular, for the determination of human real samples.
1. Introduction
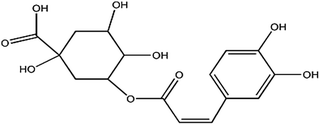
Chlorogenic acid is an ester of dihydroxycinnamic acid and quinic acid (Chart 1),1 and has been used widely in the food, pharmaceutical and health care industries, particularly for cancer treatment2,3 because of its positive effects on antibiotics, cholagogue, physiology of hemostasis, and anti-inflammatory and anti-virus activities.3 However, overdoses (7 mg kg−1 body weight) cause some side-effects, such as nausea, sensitization, vomiting, oxidative stress, inflammation reactions and dermatitis.4 To strictly control the dosage and quality of chlorogenic acid application, a highly sensitive and reliable method for the determination of chlorogenic acid is required.Various methods, such as high performance liquid chromatography (HPLC),5,6 liquid chromatography-mass spectrometry (LC-MS),7 electrospray ionization mass spectrometry (EIS-MS),8 capillary electrophoresis,9 NMR spectrometry,10 and electrochemical methods, have been used for the determination of chlorogenic acid.11–13 Throughout these reported methods, spectroscopic and chromatographic methods are usually time-consuming and require expensive equipment and complicated working conditions. By contrast, electrochemical methods exhibit definite advantages of higher sensitivity, lower measurement cost, faster response times and more convenient operations. According to these admirable properties, electrochemical chlorogenic acid sensors have been developed successfully based on various materials, such as poly aminosulfonic acid,1 tetranuclear copper(II) complex,11 ionic liquid-containing iridium nanoparticles polyphenol oxidase,12 and bean sprout homogenate chitosan microspheres and silica13 due to their catalytic ability toward chlorogenic acid.
Multi-walled carbon nanotubes (MWCNTs) have garnered strong interest in the applications of electrochemistry because of the unique electronic properties.14–18 In particular, MWCNTs have been utilized widely in the development of various electrochemical sensors as an electrode material to efficiently accelerate electron transfer between experimental substances and electrodes.15,19,20 To improve the stability of MWCNTs on an electrode surface, chitosan (CS), which is known as a linear natural biopolymer, is usually introduced as a film material to disperse MWCNTs by forming nanocomposites,21,22 which show good adhesion and high mechanical strength for sensor construction.22–24 This method is not only limited to MWCNTs, but is also available for other nanomaterials, such as graphene,23 metal oxide nanosphere,24 graphite,25 metal nanoparticles,26 and boron nitride nanotubes.27 In the following process of film formation, the immobilization of these nanocomposites on an electrode surface is mostly based on the drop cast method, but it is difficult to obtain a uniform film with the desired thickness. By contrast, the sensor construction by a layer-by-layer (LBL) self-assembly method can provide an approach with the advantages of high stability, homogeneity and controllable film characters, e.g., thickness and roughness.28–31 For example, Yang and co-workers reported a hydrogen peroxide biosensor by LBL self-assembly of stable Pt/MWCNTs/CS layers, which resulted in high electrocatalytic activity when the assembled layers reached seven.32 Zou and co-workers prepared multiple self-assembly layers of porous homogeneous and controllable CS/MWNTs/glucose oxidase for the determination of glucose with the maximum catalytic ability at six layers of CS/MWCNTs/glucose oxidase.33
In this contribution, a chlorogenic acid electrochemical sensor was fabricated successfully. Compared to previously reported sensors in this field, the sensor based on (CS/MWCNTs)n/GCE is probably more promising and attractive for several reasons. First, the sensor preparation is much easier via a simple LBL self-assembly method based on the electrostatic interaction34,35 between negatively charged MWCNTs and positively charged CS (NH3+) layers on a glassy carbon electrode ((CS/MWCNTs)n/GCE). Second, the sensor materials are easily prepared and no specific synthetic processes are required. Third, superior catalytic ability of this sensor toward chlorogenic acid is benefited from both MWCNTs and CS and can be adjusted by varying the number of assembled CS/MWCNTs layers. Finally, the resulting sensor is more sensitive to chlorogenic acid and possesses a wider detection range and a lower detection limit. Moreover, the proposed sensor is also available for the determination of chlorogenic acid in real practice with higher stability, and the results are as reliable as to those obtained by a conventional HPLC method.
2. Experimental
2.1 Reagents and materials
Chlorogenic acid (analytical grade) and MWCNTs were purchased from Aladdin Chemical Reagent Co. Ltd. (Shanghai, China). Chitosan (CS, 99%) was obtained from Sigma-Aldrich Chemical Co. Normal human serum samples were received from Huayueyang Biotechnology Co. Ltd (Beijing, China). All other reagents used in the experiment were of A.R. Grade and used without any further purification.Prior to use, 0.005 g of MWCNTs were dispersed in 10 mL of double-distilled water and sonicated for 1 hour. An acetic acid (2.0%) solution was prepared by diluting 2 mL of acetic acid in 100 mL of double-distilled water. A CS solution (in acetic acid) was obtained by dissolving 0.05 g of CS in 10 mL of the prepared acetic acid solution. The chlorogenic acid stock solution (1 × 10⁻³ mol dm−3) was prepared by dissolving in a phosphate buffer solution and kept at 277.15 K. A phosphate buffer solution (0.1 M) was prepared from Na2HPO4 and NaH2PO4. The pH of a series of buffer solutions (containing 1 × 10⁻⁴ mol dm−3 chlorogenic acid) ranging from 1.0 to 7.0 was adjusted by the addition of HCl or NaOH. All aqueous solutions were prepared using double-distilled water.
The human serum samples were diluted using a phosphate buffer solution (pH 1.0) at a 1![[thin space (1/6-em)]](https://www.rsc.org/images/entities/char_2009.gif) :
:![[thin space (1/6-em)]](https://www.rsc.org/images/entities/char_2009.gif) 50 (serum
50 (serum![[thin space (1/6-em)]](https://www.rsc.org/images/entities/char_2009.gif) :
:![[thin space (1/6-em)]](https://www.rsc.org/images/entities/char_2009.gif) buffer) volume ratio. By the standard addition method, extra chlorogenic acid was added to these samples for further analysis, making the added concentration of chlorogenic acid 0.05, 0.10, 80, 130, 160 and 190 μmol dm−3.
buffer) volume ratio. By the standard addition method, extra chlorogenic acid was added to these samples for further analysis, making the added concentration of chlorogenic acid 0.05, 0.10, 80, 130, 160 and 190 μmol dm−3.
2.2 Fabrication of bare GCE and (CS/MWCNTs)n/GCE
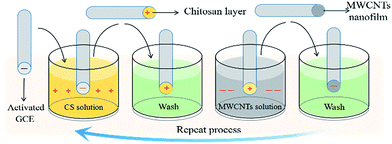
The bare GCEs (3 mm, Xianren, Shanghai, China) were initially polished with 0.3 and 0.05 μm alumina powder and then washed ultrasonically in acetone, absolute ethanol and double-distilled water in sequence for about 1 minute each to obtain a smooth and clean electrode surface. The bare GCE was further scanned in a 0.5 mol dm−3 sulfuric acid solution from −0.5 V to +1.0 V at a scan rate of 50 mV s−1 until gaining stable cyclic voltammograms to generate negatively charged electrode surfaces.The preparation of a multiple LBL self-assembly film of CS and MWCNTs on a GCE is shown in Scheme 1. Under acidic conditions, the activated GCE was first immersed in a CS–acetic acid solution for 5 minutes to allow the formation of self-assembly between the negatively charged GCE and positively charged CS through electrostatic interactions. The self-assembly of negatively charged MWCNTs was obtained by further immersing the GCE with a CS layer in a 1 mg dm−3 MWCNTs solution for 10 minutes. The resulting GCE was washed alternately with a phosphate buffer solution and distilled water and then dried under nitrogen after each modification. By repeating these steps, a multiple self-assembly film of CS and MWCNT-modified GCE was formed.
2.3 Apparatus and method
All electrochemical measurements were conducted on a CHI660E electrochemical workstation (Chenhua, Shanghai, China) with a conventional three-electrode configuration, including a bare GCE or a modified GCE working electrode, a saturated calomel electrode (SCE) as the reference electrode and a platinum wire as the counter electrode. The thickness of the LBL self-assembly layer was determined by spectroscopic ellipsometry (HJY UVISEL-NIR, Horiba Jobin Yvon, France). A field emission scanning electron microscope (FE-SEM; Zeiss Ultra55, Germany) was used to characterize the surface morphology of the bare and modified GCEs. High performance liquid chromatography (HPLC) was carried out on a HP-1100 system (Agilent technologies co., Ltd. USA) equipped with a C18 chromatographic column (ODS: 20 cm × 46 mm) using an aqueous mobile phase (containing acetonitrile and 0.1% phosphate buffer solution) with a flow rate of 1.0 mL min−1 and an injection loop volume of 10 μL. The pH was measured using a PHS-3C pH meter (Precision scientific instruments co., Ltd. China).The electrochemical properties and determination of chlorogenic acid were studied using cyclic voltammetry (CV) and differential pulse voltammetry (DPV) observations, respectively. In contrast, the latter exhibits higher sensitivity and a lower detection limit. The potential range for cyclic voltammetry was from 0 V to 1.1 V at a scan rate of 50 mV s−1 with a sample interval of 0.001 V and a quiet time of 2 s. For DPV, the increment was 0.005 V and the amplitude was 0.05 V with a pulse width of 0.2 s, sampling width of 0.05 s and pulse period of 0.01 s.
For the determination of chlorogenic acid, the detection limit, Cm, was obtained using eqn (1):
| Cm = 3Sb/m | (1) |
3. Results and discussion
3.1 Formation of the modified electrode of (CS/MWCNTs)6/GCE
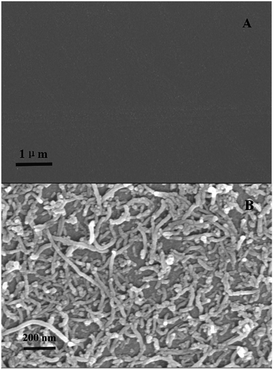
A formed self-assembled layer usually brings a homogeneous structure. Thus, the formation of the film on GCE by the LBL self-assembly method resulted in a gradual increase in its thickness, which was characterized via spectroscopic ellipsometry.36,37 The variation of the film thickness of (CS/MWCNTs)n/GCE is summarized in Table 1. After the GCE was initially modified with a CS monomolecular layer, the film thickness of CS/GCE was approximately 35.1 nm. An extra MWCNTs layer was added to form the (CS/MWCNTs)1/GCE, and the thickness of the modification was increased to 172.9 nm. The thickness of LBL self-assembled films displayed steady growth from 0 nm to 1225.0 nm when six CS layers and six MWCNTs layers were assembled on the GCE. The thickness of (CS/MWCNTs)6/GCE was similar to the total thickness of six individual CS/MWCNTs layers, indicating that the modification of (CS/MWCNTs)6/GCE using LBL self-assembly was successful and the method was controllable and feasible. The relative standard deviations (RSD) were in the range, 91.3–99.6% at a 95% confidence level, which demonstrated the relative precision of the method. The formation of (CS/MWCNTs)6/GCE can also be confirmed by SEM images. As shown in Fig. 1A and B, the bare GCE without any treatment expressed smooth and an undefiled surface, while (CS/MWCNTs)6/GCE revealed a homogeneous network with a compact structure, where MWCNTs were dispersed uniformly on the CS layer surface due to electrostatic interactions without significant agglomeration.| Sample number | Electrodes | Film thicknessesa (nm) | SD (nm) | RSD (%, n = 3) |
|---|---|---|---|---|
| a Film thicknesses are expressed as a confidence interval of 95% probability. | ||||
| 1 | Bare GCE | 0 | 0 | 0 |
| 2 | CS/GCE | 35.1 ± 18.5 | 9.450 | 6.9 |
| 3 | (CS/MWCNTs)1/GCE | 172.9 ± 24.93 | 12.72 | 7.3 |
| 4 | (CS/MWCNTs)3/GCE | 484.3 ± 82.41 | 42.05 | 8.7 |
| 5 | (CS/MWCNTs)6/GCE | 1225.0 ± 34.26 | 17.48 | 1.4 |
3.2 Electrochemical characterization of (CS/MWCNTs)n/GCE
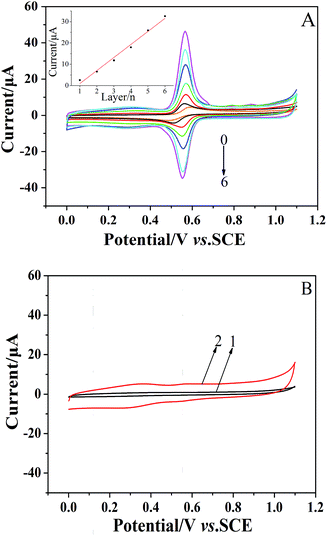
The formation of the (CS/MWCNTs)n/GCE was also monitored via CV in a 1 × 10⁻⁴ mol dm−3 chlorogenic acid containing phosphate buffer solution (pH = 1.0). As illustrated in Fig. 2A, the GCE modified with the LBL self-assembly films of CS and MWCNTs exhibited superior catalytical ability toward chlorogenic acid compared to bare GCE. In particular, both the reduction and oxidation peak currents increased with increasing numbers of self-assembled monolayers and reached the maximum at the sixth layer of CS/MWCNTs with more than ten orders of magnitude increase. The redox peak current and the number of layers showed a linear relationship with the expression, Ipc (μA) = 6.113–5.145n (r = 0.9941). This observation clearly reveals the successfully assembled multiple CS and MWCNTs layers, and this is in good agreement with the previous discussion on the variation of layer thickness. While self-assembling to the seventh layer, the enhancement of the peak currents became less significant due to the hindrance of the total thickness of the layers. Hence, the optimal number of CS/MWCNT layers was chosen to be six. By contrast, no significant redox process occurred on the bare GCE (curve 1, Fig. 2B) and the (CS/MWCNTs)6/GCE (curve 2, Fig. 2B) when chlorogenic acid was absent in the phosphate buffer solution, confirming the chlorogenic acid-based process.3.3 Electrochemical properties of chlorogenic acid under optimal conditions
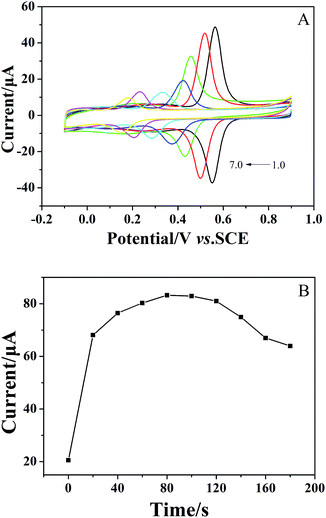
As chlorogenic acid is unstable in an alkaline medium, the pH effect on electrochemical properties of chlorogenic acid was only investigated in electrolyte solutions with pH ranging from 1 to 7. When the pH was varied from 1.0 to 7.0, the redox peak currents of chlorogenic acid decreased gradually (Fig. 3A), suggesting that pH 1.0 can be chosen as one of the optimal conditions to achieve better electrocatalytic performance of chlorogenic acid. Simultaneously, both the oxidation potentials and reductive potentials for chlorogenic acid shifted to the negative direction (Fig. 3A) and showed a linear relationship with pH as Epa1 (μA) = −0.06579pH + 0.6340 (r = −0.9900) and Epa2 (μA) = −0.06879pH + 0.6340 (r = −0.9970). According to eqn (2),38| dEp/dpH = −2.303mRT/nF | (2) |
The relationship between accumulation time and peak current was also investigated. As shown in Fig. 3B, the peak current increased with increasing accumulation time and reached the maximum at 80 seconds. Therefore, an accumulation time of 80 seconds was chosen as the optimal condition for the determination of chlorogenic acid in the following section.
3.4 Scan rate effect of the chlorogenic acid detection
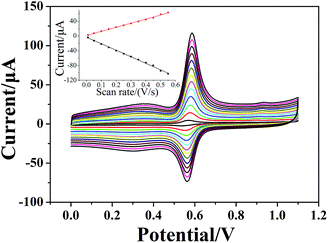
Voltammograms of 1 × 10⁻⁴ mol dm−3 chlorogenic acid were recorded at scan rates, ranging from 10 to 550 mV s−1 in a phosphate buffer solution (pH = 1.0) on both bare GCE and (CS/MWCNTs)6/GCE. In particular, the redox peak currents observed on a bare GCE increased in proportion to the square root of the scan rate, indicating a diffusion controlled redox reaction for chlorogenic acid (Fig. S1, ESI†). By contrast, the resulting (CS/MWCNTs)6/GCE after surface modification using the LBL self-assembly method illustrated adsorption-controlled reversible redox process. As shown in Fig. 4, the peak shapes were independent of the scan rates up to 550 mV s−1 with a consistent ΔEp of 21 mV, and the peak current scaled linearly with the variation of the scan rates (the inset of Fig. 4), where the linear regression equations are expressed as Ipa (μA) = 110.6ν (mV s−1) + 1.448 (r = 0.9970) and Ipc (μA) = −176.9ν (mV s−1) − 3.293 (r = −0.9986). These observations are probably due to the influences of the polyporus structure and hydrophilic property of multiple layers of CS and MWCNTs.39,40 Based on the Laviron formula of eqn (3),41
 | (3) |
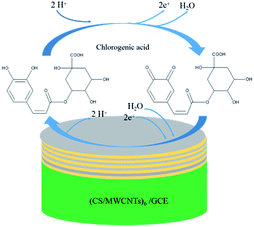 | ||
| Scheme 2 Mechanism of the electrochemical reaction of chlorogenic acid occurring on the surface of the (CS/MWCNTs)6/GCE. | ||
3.5 Determination of chlorogenic acid
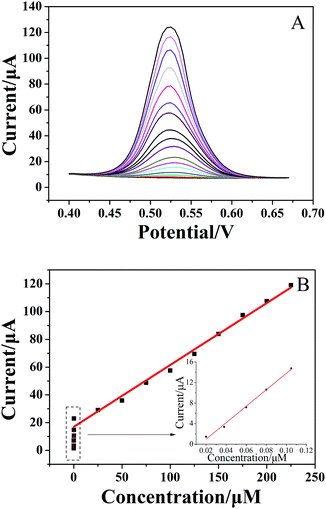
For quantitative determination of chlorogenic acid, a more sensitive DPV was utilized under the optimized conditions. From the Fig. 5A, the oxidation peak current continued to rise with increasing concentrations of chlorogenic acid from 2 × 10⁻⁸ to 2.25 × 10⁻⁴ mol dm−3. In particular, the proposed sensor showed good linear relationships at low concentrations from 2 × 10⁻⁸ to 1 × 10⁻⁷ mol dm−3 (inset of Fig. 5B) and at high concentrations from 1 × 10⁻⁷ to 2.25 × 10⁻⁴ mol dm−3 (Fig. 5B), and the linear equations could be given as Ipa1 (μA) = 160.3C (μmol L−1) − 2.365 (r = 0.9937) and Ipa2 (μA) = 0.4460C (μmol L−1) + 16.98 (r = 0.9905), respectively. The detection limit at the (CS/MWCNTs)6/GCE for chlorogenic acid was determined to be (1.17 ± 0.03) × 10−8 mol dm−3 according to a signal-to-noise ratio of 3 by eqn (1) (S/N = 3, α = 0.05, n = 3). Compared to the reported electrochemical chlorogenic sensors, the (CS/MWCNTs)6/GCE exhibited a wider detection linear range with a lower detection limit (Table 2), which can be attributed to the remarkable electrochemical activity of (CS/MWCNTs)6/GCE by the LBL self-assembly method. However, most importantly, the preparation of (CS/MWCNTs)6/GCE was easier and more controllable because the CS and MWCNTs were combined by noncovalent bonding through the LBL method, which allows the formation of homogenous films.| Method | Modified electrode | Detection range (mol dm−3) | Detection limit (mol dm−3) | Reference |
|---|---|---|---|---|
| CV | Poly(aminosulfonic acid)/GCE | 4.0 × 10⁻⁷ to 1.2 × 10⁻⁵ | 8.0 × 10⁻⁸ | 1 |
| SWV | Graphite powder–nujol–Cu(II) complex/carbon paste | 8.0 × 10⁻⁶ to 1.45 × 10⁻⁴ | 8.0 × 10⁻⁷ | 11 |
| SWV | Ir-BMI·PF6–PPO polyphenol oxidase/carbon paste | 3.48 × 10⁻⁶ to 4.95 × 10⁻⁵ | 9.15 × 10⁻⁷ | 12 |
| CV/SWV | Bean sprout homogenate–CS microspheres/carbon paste bean sprout homogenate–silica/carbon paste | 4.89 × 10⁻⁶ to 3.20 × 10⁻⁴ | 8.02 × 10⁻⁷ | 13 |
| 4.89 × 10⁻⁶ to 4.85 × 10⁻⁵ | 8.52 × 10⁻⁷ | |||
| DPV | (CS/MWCNTs)6/GCE | 1 × 10⁻⁷ to 2.25 × 10⁻⁴ | 1.16 × 10⁻⁸ | This study |
| 2 × 10⁻⁸ to 1.00 × 10⁻⁷ |
3.6 Selectivity, stability and reproducibility of the (CS/MWCNTs)6/GCE
Ionic species of K+, Na+, Mg2+, Cu2+, Mn2+, Al3+, Ca2+, Br−, NO3−, SO42−, Cl−, Ac−, and CO32− and organic species of glucose, sucrose, maltose, ascorbic acid, dopamine and tartaric acid were selected as interferents to mimic the interruption on the performance of the proposed sensor occurred in real human samples. The effects from possible interferents on the determination of chlorogenic acid were negligible when 80-fold concentrations of inorganic ions and 10-fold concentrations of organic compounds were added. These observations suggest favorable selectivity of the proposed sensor towards chlorogenic acid.Stability is also one of the most important elements to evaluate the performance of the proposed (CS/MWCNTs)6/GCE chlorogenic acid sensor in practical applications. The voltammetric response of 1 × 10⁻⁴ mol dm−3 chlorogenic acid on (CS/MWCNTs)6/GCE changed remarkably little during the cyclic scans, and the redox peak currents retained 90% of their original current even after over 200 scans. Furthermore, the changes in the redox peak currents were approximately 4.8% and 6.4% when the (CS/MWCNTs)6/GCE was placed at 279.15 K for 7 and 15 days, respectively, exhibiting excellent stability.
The reproducibility of (CS/MWCNTs)6/GCE for the determination of chlorogenic acid is an important factor for practical applications and further development. This study examined five different electrodes that were prepared using the LBL self-assembly method for parallel experiments. The relative standard deviation (RSD) of the oxidation peak current for chlorogenic acid was calculated to be 2.32% ± 0.44% (α = 0.05, n = 3), resulting in satisfactory reproducibility.
3.7 Determination in real samples
The determination of chlorogenic acid in human serum samples was achieved using a standard addition method and conducted by HPLC and the proposed electrochemical sensor based on (CS/MWCNTs)6/GCE, in which human serum samples were used for quantitative analysis. As shown in Table 3, the recoveries of chlorogenic acid from human serum samples obtained via HPLC (100.7–106.2%) and the proposed sensor (99.33–109.0%) were comparable and close to 100.0%. This demonstrates that the proposed sensor for real sample analysis is as reliable and accurate as HPLC and can be used as an efficient method for the determination of chlorogenic acid in real human serum samples.| Sample number | Sample added (μmol dm−3) | Sample responsea (μmol dm−3) | Recovery (%) | RSD (%) | |||
|---|---|---|---|---|---|---|---|
| HPLC | Proposed sensor | HPLC | Proposed sensor | HPLC | Proposed sensor | ||
| a n = 6, confidence level of 95%. | |||||||
| 1 | 0.05 | 0.051 ± 0.003 | 0.052 ± 0.002 | 103.5 ± 5.9 | 104.0 ± 3.9 | 3.2 | 2.2 |
| 2 | 0.10 | 0.106 ± 0.009 | 0.109 ± 0.003 | 106.2 ± 8.5 | 109.0 ± 2.8 | 4.5 | 2.6 |
| 3 | 80 | 83.1 ± 4.1 | 82.5 ± 7.6 | 103.9 ± 5.0 | 103.1 ± 9.3 | 2.5 | 4.1 |
| 4 | 130 | 131.3 ± 3.4 | 132.7 ± 3.0 | 101.0 ± 2.6 | 102.1 ± 2.3 | 1.3 | 0.81 |
| 5 | 160 | 161.1 ± 4.2 | 162.2 ± 4.0 | 100.7 ± 2.7 | 101.4 ± 2.5 | 1.3 | 0.92 |
| 6 | 190 | 191.9 ± 4.7 | 188.7 ± 5.0 | 101.0 ± 2.5 | 99.33 ± 2.7 | 1.2 | 1.3 |
4. Conclusion
In this study, a CS and MWCNT-modified GCE was prepared using an easily controlled LBL self-assembly method for the determination of chlorogenic acid. The modified electrode with six layers of CS/MWCNTs demonstrated the maximum catalytic ability to chlorogenic acid. Under the optimized conditions, (CS/MWCNTs)6/GCE showed a wider linear detection range and a lower detection limit for chlorogenic acid compared to the reported electrochemical sensors in this field. (CS/MWCNTs)6/GCE also expressed excellent selectivity, stability and reproducibility for chlorogenic acid detection and was used successfully in real sample applications with satisfactory results.Acknowledgements
Financial support from the National Natural Science Foundation of China (Grant No. 21475046, 21427809, 21645004) and the Fundamental Research Funds for the Central Universities (No. 2015ZM055 and 2015ZP028) are gratefully acknowledged.References
- M. Chao and X. Y. Ma, J. Food Drug Anal., 2014, 22, 512–519 CrossRef CAS.
- Y. Hao, R. X. Gao and D. C. Liu, Food Chem., 2016, 200, 215–222 CrossRef CAS PubMed.
- X. D. Yuan, H. L. Koh and W. K. Chui, J. Pharm. Biomed. Anal., 2005, 39, 697–704 CrossRef CAS PubMed.
- W. Y. Du, C. Chang, Y. Zhang and Y. Y. Liu, J. Ethnopharmacol., 2013, 147, 74–83 CrossRef CAS PubMed.
- W. P. Liao and Y. K. Rui, Asian J. Chem., 2010, 22, 1859–1863 CAS.
- J. Wang, S. Hu and X. H. Bai, Chromatographia, 2010, 72, 453–458 CAS.
- L. J. Lesko, A. K. Miller, R. L. Yeager and D. C. Chatterji, J. Pharm. Biomed. Anal., 2010, 52, 625–630 CrossRef PubMed.
- F. L. Hu, C. H. Deng and Y. Liu, Talanta, 2009, 77, 1299–1303 CrossRef CAS PubMed.
- P. Tong, L. Zhang and Y. He, Talanta, 2009, 77, 1790–1794 CrossRef CAS PubMed.
- I. Berregi, J. I. Santos and G. Campo, Anal. Chim. Acta, 2003, 486, 269–274 CrossRef CAS.
- M. Carvalho, M. Santhiago and R. A. Peralta, Talanta, 2008, 77, 394–399 CrossRef PubMed.
- S. C. Fernandes, S. K. Moccelini, C. W. Scheeren and P. Migowski, Talanta, 2009, 79, 222–228 CrossRef CAS PubMed.
- S. K. Moccelini, A. Spinelli and I. C. Vieira, Enzyme Microb. Technol., 2008, 43, 381–387 CrossRef CAS.
- G. C. Zhao, Z. Z. Yin and L. Zhang, Electrochem. Commun., 2005, 7, 256–260 CrossRef CAS.
- G. C. Zhao, L. Zhang and X. W. Wei, Electrochem. Commun., 2003, 5, 825–829 CrossRef CAS.
- W. Sun, X. Q. Li and Y. Wang, Electrochim. Acta, 2009, 54, 4141–4148 CrossRef CAS.
- J. W. Shie, U. Yogeswaran and S. M. Chen, Talanta, 2008, 74, 1659–1669 CrossRef CAS PubMed.
- H. I. Naiara, G. C. Leticia and M. Vicente, Biosens. Bioelectron., 2016, 77, 1168–1174 CrossRef PubMed.
- Y. Liu, S. Wu and H. X. Ju, Electroanalysis, 2007, 19, 986–992 CrossRef CAS.
- R. Liu, X. B. Zeng, J. C. Liu, Y. Zheng and X. Y. Liu, J. Mater. Chem. A, 2014, 2, 14481–14492 CAS.
- X. Liu, Y. Peng and X. Qu, J. Electroanal. Chem., 2011, 654, 72–78 CrossRef CAS.
- Y. Liu, S. Yang and W. Niu, Colloids Surf., B, 2013, 108, 266–270 CrossRef CAS PubMed.
- C. Liu, J. Zhang and J. Yue, Electron. J. Biotechnol., 2014, 17, 183–188 CrossRef.
- J. Z. Huang, Q. Zeng and L. Wang, Electrochim. Acta, 2016, 206, 176–183 CrossRef CAS.
- S. Palanisamy, K. Thangavelu and S. M. Chen, Carbohydr. Polym., 2016, 151, 401–407 CrossRef CAS PubMed.
- T. W. Chen, S. Palanisamy and S. M. Chen, Microchim. Acta, 2016, 183, 2861–2869 CrossRef CAS.
- M. Emanet, E. Kazanç and Z. Çobandede, Carbohydr. Polym., 2016, 151, 313–320 CrossRef CAS PubMed.
- C. Wu, S. Aslan and A. Gand, Adv. Funct. Mater., 2013, 23, 66–74 CrossRef CAS.
- A. Taylor, M. Michel and R. C. Sekol, Adv. Funct. Mater., 2008, 18, 3003–3009 CrossRef CAS.
- S. C. Wang, J. Yang and X. Y. Zhou, J. Electroanal. Chem., 2014, 722–723, 141–147 CrossRef CAS.
- Y. Wang, W. Z. Wei, X. Y. Liu and X. D. Zeng, Mater. Sci. Eng., C, 2009, 29, 50–54 CrossRef CAS.
- M. Yang, Y. Yang, H. Yang and G. Shen, Biomaterials, 2006, 27, 246–255 CrossRef CAS PubMed.
- Y. Zou, C. Xiang and L. Sun, Electrochim. Acta, 2008, 53, 4089–4095 CrossRef CAS.
- B. Y. Wu, S. H. Hou and M. Yu, Mater. Sci. Eng., C, 2009, 29, 346–349 CrossRef CAS.
- X. Gao, Y. Zhang and H. Chen, Anal. Biochem., 2011, 414, 70–76 CrossRef CAS PubMed.
- M. G. Sullivan, B. Schnyder and M. Bärtsch, J. Electrochem. Soc., 2000, 147, 2636–2643 CrossRef CAS.
- W. B. Caldwell, D. J. Campbell and K. Chen, J. Am. Chem. Soc., 1995, 117, 6071–6082 CrossRef CAS.
- Q. Zeng, T. Y. Wei and M. Wang, Electrochim. Acta, 2015, 186, 465–470 CrossRef CAS.
- M. Namazian and H. R. Zare, Electrochim. Acta, 2005, 50, 4350–4355 CrossRef CAS.
- A. Salimi and R. Hallaj, Electroanalysis, 2004, 16, 1964–1971 CrossRef CAS.
- E. Laviron, J. Electroanal. Chem., 1979, 101, 19–28 CrossRef CAS.
Footnote |
| † Electronic supplementary information (ESI) available. See DOI: 10.1039/c6ra26378j |
| This journal is © The Royal Society of Chemistry 2017 |

