 Open Access Article
Nitrogen-doped carbon materials with cubic ordered mesostructure: low-temperature autoclaving synthesis for electrochemical supercapacitor and CO2 capture
Lei Liu*a,
Shi-Da Xua,
Feng-Yun Wangb,
Yue-Jun Songc,
Jie Liua,
Ze-Min Gaoc and
Zhong-Yong Yuan *cd
*cd
aSchool of Materials Science and Engineering, Shandong University of Science and Technology, Qingdao 266590, China. E-mail: zyyuan@nankai.edu.cn; liulei@sdust.edu.cn
bCollege of Physics and Cultivation Base for State Key Laboratory, Qingdao University, Qingdao 266071, China
cNational Institute for Advanced Materials, School of Materials Science and Engineering, Nankai University, Tianjin 300350, China
dKey Laboratory of Advanced Energy Materials Chemistry (Ministry of Education), Collaborative Innovation Center of Chemical Science and Engineering (Tianjin), Nankai University, Tianjin 300071, China
First published on 22nd February 2017
Abstract
Nitrogen doped ordered mesoporous carbons (NOMCs) with a 3-D body-centered cubic pore structure with uniform pore size of 2.9–3.0 nm and high BET surface area of 583–847 m2 g−1 have been synthesized by means of a facile and efficient low-temperature autoclaving route under basic conditions, in which triblock copolymer F127 was used as the template, and resorcinol/hexamethylenetetramine as the carbon precursor. The effect of synthesis parameters including the autoclaving temperature and autoclaving treatment time was investigated in detail. It is found that NOMCs with cubic Im![[3 with combining macron]](https://www.rsc.org/images/entities/char_0033_0304.gif) m structure can be produced at the autoclaving temperature of 60 °C and autoclaving treatment time of ≥2 d. Benefiting from the unique features of high surface area, nitrogen doping, uniform and uninterrupted mesopores and rich microporosity, these NOMCs for supercapacitors exhibit high capacitance of 193 F g−1 at 1.0 A g−1, high rate capacity (90% capacitance retention at 10 A g−1) and good cycling stability (99.1% capacity retention after 1000 cycles at 1.0 A g−1) in 6 M KOH aqueous solution and good cycling stability with specific capacitance retention over 500 cycles. Moreover, the NOMCs also show excellent CO2 capture properties with a capacity of 4.7 and 3.5 mmol g−1 at 0 and 25 °C, respectively. It is revealed that both textural and surface chemistry properties influenced the CO2 capture performance of the resultant NOMCs adsorbents.
m structure can be produced at the autoclaving temperature of 60 °C and autoclaving treatment time of ≥2 d. Benefiting from the unique features of high surface area, nitrogen doping, uniform and uninterrupted mesopores and rich microporosity, these NOMCs for supercapacitors exhibit high capacitance of 193 F g−1 at 1.0 A g−1, high rate capacity (90% capacitance retention at 10 A g−1) and good cycling stability (99.1% capacity retention after 1000 cycles at 1.0 A g−1) in 6 M KOH aqueous solution and good cycling stability with specific capacitance retention over 500 cycles. Moreover, the NOMCs also show excellent CO2 capture properties with a capacity of 4.7 and 3.5 mmol g−1 at 0 and 25 °C, respectively. It is revealed that both textural and surface chemistry properties influenced the CO2 capture performance of the resultant NOMCs adsorbents.
1. Introduction
Ordered mesoporous carbons (OMCs) with highly ordered pore channels have unique characteristics, such as high surface area, chemical inertness and good electrical conductivity, thereby showing potential applications in a wide range of research fields.1 Compared to the traditional hard-templating method (nanocasting strategy) to produce OMCs, the soft-templating route based on organic–organic self-assembly is particularly more attractive due to the avoidance of many drawbacks such as multistep synthesis, consumption of time, and high cost.2–4 So far the organic–organic self-assemblies are mainly successfully applied for phenolic resins, which are often condensed by acidic or basic catalysts in the presence of the surfactant template, during the formation of mesostructures.5–7 Considering commonly used catalysts (NaOH and HCl) would result in the corrosion of the equipment and the pollution of halogenide ions, some alternative and green catalysts such as citric acid,8 amino acid,9,10 phosphonic acid11 and ammonia aqueous solution12 were recently developed to catalyze the polymerization of resorcinol/formaldehyde (RF) resin, which is more flexible and convenient. Meanwhile, instead of the widely used precursor of RF resin, some other carbon precursors were also developed.13 Through self-polymerization of dopamine and spontaneous co-assembly of diblock copolymer micelles, nitrogen-doped mesoporous carbon spheres with large pores of ∼16 nm has been obtained.1 Hexamethylenetetramine (HMT) was demonstrated to be a release source of formaldehyde towards the self-assembly synthesis of RF-based OMCs through employing resorcinol and HMT as precursors.14 However, the resultant carbon materials have only a common 2-D hexagonal mesostructure. And the hydrothermal synthesis was performed under the relative high temperature of 100–220 °C.Despite the great progress in the synthesis of OMCs, there are only a few reports on the syntheses of OMCs with 3-D cubic structure based on RF resin and F127.15 Recently, Liu et al. reported the preparation of OMCs with Im![[3 with combining macron]](https://www.rsc.org/images/entities/char_0033_0304.gif) m structure through aqueous self-assembly of RF resin and F127.12 They demonstrated that the optimal reaction temperature for the formation of ordered mesostructures was ∼80 °C, whereas no product could be obtained below 70 °C. Additionally, the obtained carbons had large particle size of approximately 5–15 μm, which was disadvantage for some applications, such as supercapacitor electrodes materials, due to their inherent long diffusion path way.16,17
m structure through aqueous self-assembly of RF resin and F127.12 They demonstrated that the optimal reaction temperature for the formation of ordered mesostructures was ∼80 °C, whereas no product could be obtained below 70 °C. Additionally, the obtained carbons had large particle size of approximately 5–15 μm, which was disadvantage for some applications, such as supercapacitor electrodes materials, due to their inherent long diffusion path way.16,17
In addition, previous studies have revealed that doping nitrogen into the carbon matrix can enhance the electrical, and structural characteristics of carbons,18–21 endowing them with excellent performance in supercapacitors18–20 Herein, nitrogen doped OMCs (NOMCs) with body-centered cubic structure (Im![[3 with combining macron]](https://www.rsc.org/images/entities/char_0033_0304.gif) m) were synthesized through a low-temperature autoclaving (LTA) route at 60 °C in the presence of resorcinol and HMT as carbon precursors under basic conditions. A detailed examination of synthesis parameters including the autoclaving temperature and time was carried out. Their potential applications as electrodes materials for supercapacitors and as adsorbents for CO2 capture were evaluated. The 900 °C-carbonized samples exhibit high specific capacitance of up to 193 F g−1 at 1.0 A g−1 in 6 M KOH aqueous solution and display a good rate performance due to the uninterrupted mesoporous channels that favor rapid ion diffusion while a proper number of micropores offer large surface area. The CO2 adsorption capacities reach 4.7 and 3.54 mmol g−1 at 0 and 25 °C, respectively.
m) were synthesized through a low-temperature autoclaving (LTA) route at 60 °C in the presence of resorcinol and HMT as carbon precursors under basic conditions. A detailed examination of synthesis parameters including the autoclaving temperature and time was carried out. Their potential applications as electrodes materials for supercapacitors and as adsorbents for CO2 capture were evaluated. The 900 °C-carbonized samples exhibit high specific capacitance of up to 193 F g−1 at 1.0 A g−1 in 6 M KOH aqueous solution and display a good rate performance due to the uninterrupted mesoporous channels that favor rapid ion diffusion while a proper number of micropores offer large surface area. The CO2 adsorption capacities reach 4.7 and 3.54 mmol g−1 at 0 and 25 °C, respectively.
2. Experimental section
2.1 Synthesis
NOMCs were synthesized by a LTA method. In a typical synthesis, 1.1 g of resorcinol and 2.5 g of F127 were dissolved in 50 mL of water at room temperature, followed by the addition of 0.701 g of HMT. After being stirred for 30 min, 1.8 g of 37 wt% ammonia solution was added dropwise under tempestuously stirring. The reaction mixture was further stirred for another one hour, and was then transferred to a Teflon-lined autoclave and heated at 60 °C for 1–4 d. The black solid product was recovered by filtration, washed with water and dried in an oven at 100 °C. Carbonization was carried out in a tubular furnace under an inert atmosphere (N2 flow) with the heating rate of 1 °C min−1, and then keeping the temperature for 2 h. The final product was denoted as HMC-x-yd, wherein x represents the autoclaving temperature, y refers the autoclaving treatment time (d in unit).2.2 Characterization
Powder X-ray diffraction (XRD) pattern was performed on a Rigaku D/max-2500 diffractometer, with Cu Kα radiation (λ = 1.5406 Å) at a scanning rate of 0.01° s−1. Transmission electron microscopy (TEM) measurements were recorded using a FEI Tecnai F20 microscope at 200 kV. All samples subjected to TEM measurements were ultrasonically dispersed in ethanol and drop-casted onto copper grids covered with carbon film. Nitrogen adsorption and desorption isotherms were measured on a Quantachrome EVO sorption analyzer at 77 K. Before measurements, the samples were degassed in a vacuum at 200 °C for at least 6 h. The Brunauer–Emmett–Teller (BET) method was utilized to calculate the specific surface areas (SBET), the pore size distributions were derived from the adsorption branches of isotherms using density functional theory (DFT) method, and the total pore volumes (Vtotal) were estimated from the adsorbed amount at a relative pressure P/P0 of 0.980. Fourier transform infrared (FT-IR) spectra were collected on a Nicolet Fourier spectrophotometer, using KBr pellets of the solid samples. CO2 sorption isotherms were measured at different desired temperatures using a QuantachromeAutosorb-1MP instrument. Prior to each adsorption measurement, the samples were degassed at 250 °C for 8 h to remove the guest molecules from pores.2.3 Electrochemical measurements
Electrochemical measurements were conducted with a three-electrode electrochemical cell with 6 M KOH aqueous electrolyte on IM6 and ZENNIUM electrochemical workstation. The standard three-electrode electrochemical cell was fabricated using platinum sheet as the counter electrode, and Ag/AgCl as the reference electrode. The working electrodes were prepared by mixing the active material, acetylene black and polytetrafluoroethylene (PTFE) binder with a weight ratio of 85![[thin space (1/6-em)]](https://www.rsc.org/images/entities/char_2009.gif) :
:![[thin space (1/6-em)]](https://www.rsc.org/images/entities/char_2009.gif) 10
10![[thin space (1/6-em)]](https://www.rsc.org/images/entities/char_2009.gif) :
:![[thin space (1/6-em)]](https://www.rsc.org/images/entities/char_2009.gif) 5. After coating the above slurry onto the nickel foam current collector (1 cm × 1 cm), the electrodes were dried at 70 °C overnight before pressing under a pressure of 10 MPa. The cyclic voltammetry (CV) voltage scanning range was from −1.0 to 0 V, with the scan rate from 5 to 100 mV s−1. The electrochemical impedance spectroscopy (EIS) was conducted at an amplitude of 10 mV in the frequency range from 100 kHz to 1 mHz. Galvanostatic charge–discharge cycling was also performed in the 0 and −1.0 V range in the aqueous medium at current densities in the 1.0–10 A g−1 range based on the active mass of a single electrode. The specific gravimetric capacitance of a single electrode (F g−1) determined from the galvanostatic cycles was calculated by means of the formula:
5. After coating the above slurry onto the nickel foam current collector (1 cm × 1 cm), the electrodes were dried at 70 °C overnight before pressing under a pressure of 10 MPa. The cyclic voltammetry (CV) voltage scanning range was from −1.0 to 0 V, with the scan rate from 5 to 100 mV s−1. The electrochemical impedance spectroscopy (EIS) was conducted at an amplitude of 10 mV in the frequency range from 100 kHz to 1 mHz. Galvanostatic charge–discharge cycling was also performed in the 0 and −1.0 V range in the aqueous medium at current densities in the 1.0–10 A g−1 range based on the active mass of a single electrode. The specific gravimetric capacitance of a single electrode (F g−1) determined from the galvanostatic cycles was calculated by means of the formula:where I, Δt, ΔV, and m are the applied current, discharge time, voltage change, and the mass of active material, respectively.
3. Results and discussion
3.1 Material synthesis and characterization
NOMCs with body-centered cubic structure are produced under LTA conditions (Fig. 1). After all reactants are dissolved, the resorcinol molecules with high hydroxyl density can strongly interact with the PEO segments of F127 through the enhanced hydrogen-bonding interactions. It has been demonstrated that under atmospheric pressure, HMT was unable to hydrolyze to form ammonia and formaldehyde below 70 °C in a non-acidic aqueous solution.22 However, under autoclaving conditions, the autogenous pressure plays an important role to promote HMT hydrolysis gradually into formaldehyde and ammonia at temperature as low as 60 °C, and enhance the interaction between the molecules and induce the fast polymerization rate.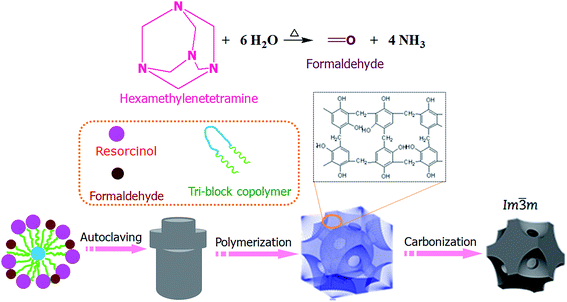 | ||
| Fig. 1 A schematic illustration depicting the synthesis route for NOMCs with body-centered cubic structure. | ||
Fig. 2 shows the low-angle XRD patterns of the carbon materials obtained at different autoclaving temperatures. A sharp and narrow diffraction peak at 2θ value of 0.69° is observed on HMC-60-2d sample which is obtained at autoclaving temperature of 60 °C, indicating the ordered mesostructure. While the autoclaving temperature increases to 80–100 °C, the obtained samples shows no diffraction peak, implying their disordered mesostructure, which is probably due to too fast reaction rate under autoclaving conditions with the temperature above 80 °C.
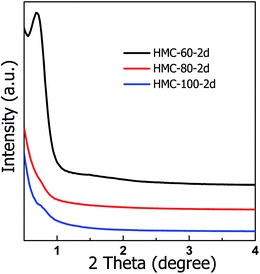 | ||
| Fig. 2 Low-angle XRD patterns of HMC-x-2d samples obtained at different the autoclaving temperature. | ||
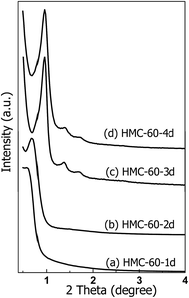
Since OMCs can be obtained at autoclaving temperature of 60 °C, the effect of autoclaving treatment time on the porous structure of the resultant NOMCs was also investigated. The low-angle XRD patterns of NOMCs obtained under autoclaving treatment times of 1–4 d are shown in Fig. 3. One wide and poorly resolved reflection peak with 2θ value of 0.60° is observed for HMC-60-1d. While autoclaving treatment time for 2 days, the reflection peak of HMC-60-2d becomes sharp, suggesting its regularity is superior to that of HMC-60-1d (Fig. 3b). HMC-60-3d represents three well-resolved diffraction peaks with 2θ value of 0.96, 1.37, and 1.71° (Fig. 3c), which can be indexed as (110), (200) and (211) Bragg reflections, respectively and assigned to the body-centered cubic Im![[3 with combining macron]](https://www.rsc.org/images/entities/char_0033_0304.gif) m symmetry.23 The Im
m symmetry.23 The Im![[3 with combining macron]](https://www.rsc.org/images/entities/char_0033_0304.gif) m symmetry can be further confirmed by TEM images as shown in Fig. 4. High-quality and large-domain regularity arrangement of porous structure is clearly observed along the (110) and (111) directions (Fig. 4a and b). The pore size and pore wall thickness of HMC-60-3d estimated from the TEM images are 2.9 and 8.6 nm, respectively, being in good agreement with the values determined from the XRD results. The cell parameter of HMC-60-3d is calculated to be 13.3 nm, while that of HMC-60-4d is 13.0 nm (Table 1). Compared the samples with different autoclaving time (Table 1), it is clearly revealed that the longer reaction time may enhance the interaction between RF resin and the polyethylene oxide (PEO) segments of F127 and improve the cross-linking degree. The SEM images (Fig. 4c and d) show that HMC-60-3d is composed of irregularly polyhedral particles with the size of 0.3–1.5 μm.
m symmetry can be further confirmed by TEM images as shown in Fig. 4. High-quality and large-domain regularity arrangement of porous structure is clearly observed along the (110) and (111) directions (Fig. 4a and b). The pore size and pore wall thickness of HMC-60-3d estimated from the TEM images are 2.9 and 8.6 nm, respectively, being in good agreement with the values determined from the XRD results. The cell parameter of HMC-60-3d is calculated to be 13.3 nm, while that of HMC-60-4d is 13.0 nm (Table 1). Compared the samples with different autoclaving time (Table 1), it is clearly revealed that the longer reaction time may enhance the interaction between RF resin and the polyethylene oxide (PEO) segments of F127 and improve the cross-linking degree. The SEM images (Fig. 4c and d) show that HMC-60-3d is composed of irregularly polyhedral particles with the size of 0.3–1.5 μm.
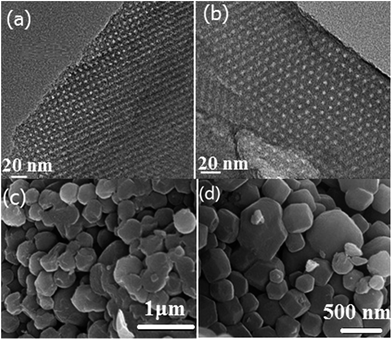 | ||
| Fig. 4 TEM images of HMC-60-3d viewed along [110] (a) and [111] (b) directions. SEM image of as-made HMC-60-3d (c) and carbonized HMC-60-3d (d). | ||
| Sample | SBETa (m2 g−1) | Smicrob (m2 g−1) | Vtotal (cm3 g−1) | Vmicrob (cm3 g−1) | DDFTc (nm) | d110d (nm) | a0d (nm) | te (nm) |
|---|---|---|---|---|---|---|---|---|
| a The BET surface area, SBET, was calculated using adsorption data in a relatively pressure range P/P0 = 0.05–0.24.b The micropore volume Vmicro and micropore surface area Smicro, were estimated from t-plot method.c The pore size, DDFT, was obtained from the maxima of the pore size distribution curve calculated by the NLDFT model.d The d-spacing of the 110 diffraction d(110) and cell parameter a0 were obtained from the small-angle XRD patterns by a0 = √2d(110).e Wall thickness was calculated as thickness t = √3a0/2 − DDFT.f The numbers in the parentheses represent the carbonization temperature. | ||||||||
| HMC-60-2d | 583 | 538 | 0.33 | 0.15 | 3.1 | 13.1 | 18.4 | 12.8 |
| HMC-60-3d | 580 | 533 | 0.31 | 0.25 | 3.0 | 9.4 | 13.3 | 8.5 |
| HMC-60-4d | 576 | 528 | 0.31 | 0.28 | 2.9 | 9.2 | 13.0 | 8.2 |
| HMC-60-3d(450)f | 348 | 277 | 0.22 | 0.14 | 3.4 | 10.7 | 15.1 | 9.6 |
| HMC-60-3d(800)f | 628 | 602 | 0.33 | 0.29 | 2.9 | 9.0 | 12.7 | 8.1 |
| HMC-60-3d(900)f | 847 | 836 | 0.42 | 0.39 | 2.9 | 8.7 | 12.2 | 7.6 |
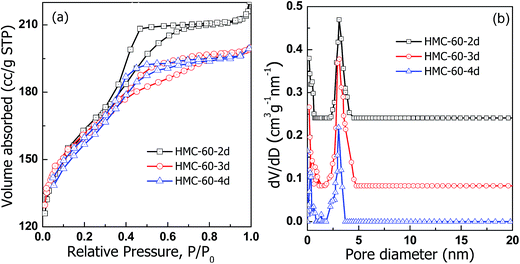
The N2 sorption isotherms (Fig. 5) illustrate that carbonized HMC-60-yd materials have typical type-IV curves with an obvious H2-type hysteresis loop and a sharp capillary condensation step in the P/P0 range from 0.4 to 0.7, corresponding to a 3-D caged mesostructure with a narrow pore size distribution.24,25 The HMC-60-2d sample shows capillary condensation at relative pressures of 0.4–0.65, and a narrow pore size distribution with a mean value of 3.1 nm (Fig. 5b) can be calculated by the NLDFT model. After the increase of autoclaving time to 3 d, HMC-60-3d exhibits a capillary condensation with a shift to low relative pressure, and the pore size is reduced to 3.0 nm, while the BET surface are and pore volume calculated to 580 m2 g−1 and 0.31 cm3 g−1, respectively. The t-plot calculation reveals that the micropore volume of HMC-60-yd enlarges with increasing autoclaving time (Table 1). The longer the autoclaving treatment time, the stronger interaction between F127 and RF resin. The embedded PEO segments of F127 could makes more disfigurement in the pore wall of the final products,23 which can introduce more microporosity in the carbons after removal of templates.
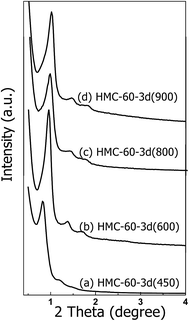
Carbonizing the as-made HMC-60-3d sample at 450–900 °C under N2 atmosphere gives a resolved XRD pattern (Fig. 6), which suggests that highly ordered cubic mesostructure (Im![[3 with combining macron]](https://www.rsc.org/images/entities/char_0033_0304.gif) m) is obtained. The calculation from XRD measurements reflects large unit cell parameters (a) of 15.1 nm for HMC-60-3d (450). With further increasing the calcinations temperature to 600 °C, three resolved diffraction peaks (Fig. 6b) assigned to the Im
m) is obtained. The calculation from XRD measurements reflects large unit cell parameters (a) of 15.1 nm for HMC-60-3d (450). With further increasing the calcinations temperature to 600 °C, three resolved diffraction peaks (Fig. 6b) assigned to the Im![[3 with combining macron]](https://www.rsc.org/images/entities/char_0033_0304.gif) m symmetry can be observed, but with a shift to higher 2θ degree, accompanied by the decrease of the unit cell parameter to 13.3 nm. When the carbonization temperature is elevated to 800 and even 900 °C (see Fig. 6c and d), the XRD patterns still show three distinct diffraction peaks assigned to the Im
m symmetry can be observed, but with a shift to higher 2θ degree, accompanied by the decrease of the unit cell parameter to 13.3 nm. When the carbonization temperature is elevated to 800 and even 900 °C (see Fig. 6c and d), the XRD patterns still show three distinct diffraction peaks assigned to the Im![[3 with combining macron]](https://www.rsc.org/images/entities/char_0033_0304.gif) m symmetry with unit cell parameters of 12.7 and 12.2 nm, respectively (Table 1). This indicates that HMC-60-3d is highly thermally stable.
m symmetry with unit cell parameters of 12.7 and 12.2 nm, respectively (Table 1). This indicates that HMC-60-3d is highly thermally stable.
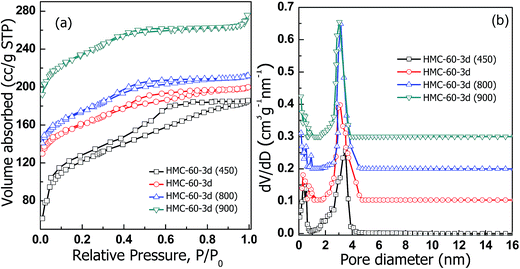
Fig. 7 depicts the N2 sorption isotherms of the HMC-60-3d samples carbonized at different temperatures. Typical type-IV curves with a clear condensation step at P/P0 = 0.2–0.7 are observed for HMC-60-3d(450), implying the mesoporous characteristic. The adsorption and desorption isotherms of HMC-60-3d(450) are not closed, attributed to its polymeric framework. HMC-60-3d(450) exhibits a large pore size of 3.4 nm, and a high BET surface area of 348 m2 g−1. The 800 and 900 °C-carbonized samples also yield typical type-IV isotherms with capillary condensation appeared at lower relative pressures, consistent with the reduced pore sizes (Table 1). Narrow pore size distributions are observed with mean pore size of 2.9 nm for both HMC-60-3d(800) and HMC-60-3d(900) (Fig. 7b), indicative of high thermal stability, which is consistent with the XRD results.
X-ray photoelectron spectroscopy (XPS) was performed to analyze the chemical state of the NOMCs samples carbonized at different temperatures. Three obvious peaks at 285, 400, and 530 eV, corresponding to C 1s, N 1s, and O 1s, are observed (Fig. 8a), indicating the presence of C, N, and O elements. The high resolution XPS spectrum of N 1s spectra (Fig. 8b–d) can be deconvoluted into four type nitrogen functional groups: pyrrolic N (398.6 eV), pyrrolic N (400 eV), graphitic N (400.9 eV), and pyridine N-oxide (403 eV), respectively.26 The relative nitrogen content firstly increased from 1.39 to 2.10 at%, and then decreased to 1.54 at% when the carbonization temperature elevated from 600 to 900 °C. The initial increment of nitrogen amount is ascribed to the substitution of most of active oxygen sites by the nitrogen atoms as the carbonization temperature increased from 600 to 800 °C.27 Therefore, it can be concluded that by using this efficient LTA method, NOMCs with highly ordered cubic Im![[3 with combining macron]](https://www.rsc.org/images/entities/char_0033_0304.gif) m mesostructure and functionalization can be easily generated, which was hardly achieved in the previous works.
m mesostructure and functionalization can be easily generated, which was hardly achieved in the previous works.
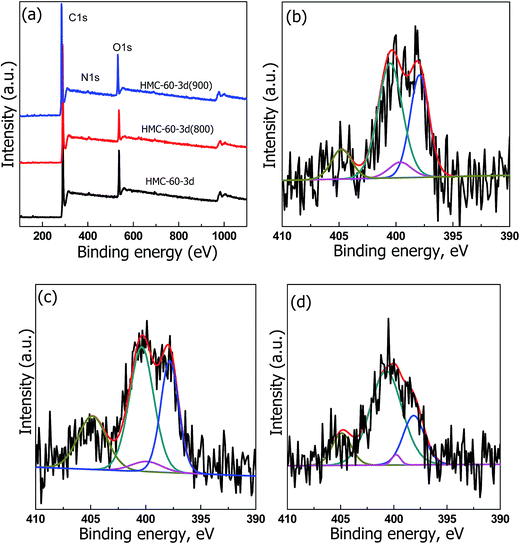 | ||
| Fig. 8 (a) X-ray photoelectron survey spectra. N 1s spectra of (b) HMC-60-3d, (c) HMC-60-3d(800), (d) HMC-60-3d(900). | ||
3.2 Electrodes for supercapacitors
To explore the potential applications of the NOMCs, the samples carbonized at different temperatures were fabricated into electrodes. The CV response of the NOMCs carried out at scan rate of 20 mV s−1 between 0 and −1.0 V in 6 M KOH solution using a three-electrode system is shown in Fig. 9. For all samples, CV curves retain a rectangular shape over a wide range of scan rates. No leaf-like current response appeared even at the scan rate of 100 mV s−1 (as shown in Fig. 9b), demonstrating fast electron transfer and ion diffusion/adsorption.28 However, compared with the samples carbonized at the temperature higher than 600 °C, it is clear that the HMC-60-3d(450) electrodes exhibit a much smaller CV area, indicating a lower specific capacitance, which may be due to its low surface area and microporosity as well as its polymeric framework. The capacitance calculated from CV curves of HMC-60-3d, HMC-60-3d(800), and HMC-60-3d(900) electrode is 107, 138, and 176 F g−1 at 20 mV s−1, respectively. The highest capacitance of HMC-60-3d(900) may be related to the moderate amount of nitrogen and its highest microporous surface area.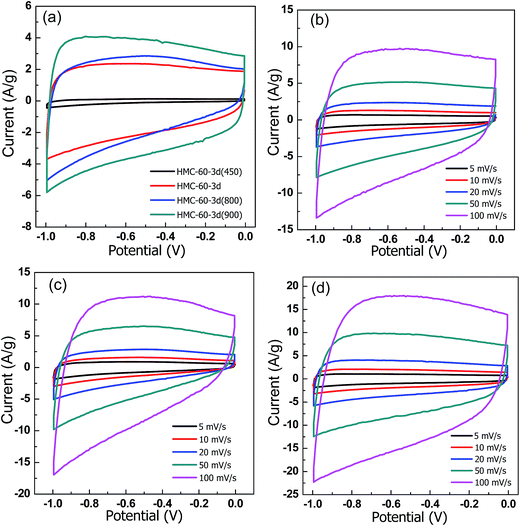 | ||
| Fig. 9 CV curves of all samples at 20 mV s−1. (a) CV curves at different scan rates for (b) HMC-60-3d, (c) HMC-60-3d(800) and (d) HMC-60-3d(900). Electrolyte: 6 M KOH. | ||
Consistent with the CV results, all galvanostatic charge/discharge curves show symmetric features with a fairly linear slope. As shown in Fig. 10, the unobvious electrode-potential drops of all curves are small, indicating a low overall resistance of the obtained NOMCs. At current density of 1.0 A g−1, the specific capacitance values of HMC-60-3d, HMC-60-3d(800) and HMC-60-3d(900), estimated from charge–discharge curves, are 133, 183 and 193 F g−1, respectively. It is clearly seen that the specific capacitance increases with the carbonization temperature and the surface area of NOMCs. The specific capacitance value of HMC-60-3d(900) electrode is comparable with NOMCs synthesized by an evaporation induced self-assembly method (213 F g−1 at 0.5 A g−1)29 or templated from SBA-15 (230 F g−1 at 0.5 A g−1),30 but is superior to that of N- and O-doped hollow carbon spheres (160 F g−1 at 1.0 A g−1)31 and some reported yolk–shell carbon spheres (178 F g−1 at 1 A g−1).32,33 Even at high current density of 10 A g−1, no obvious voltage drop at the current switches is observed, indicating a quite low resistance of the electrode. It is noteworthy that the HMC-60-3d(900) electrode still exhibits relative high capacitance of 174 F g−1 at current density of 10 A g−1 with the retention of 90%, which is much higher than some other the recently used carbons for high performance supercapacitors. For example, 45% retention and 150 F g−1 for hierarchically porous carbon materials at a current density of 2 A g−1,34 43% retention and 90 F g−1 for nitrogen- and oxygen-doped hollow carbon spheres at 5 A g−1,24 85% retention for mesoporous nitrogen-doped carbon at 10 A g−1.30 The superior electrochemical performance of HMC-60-3d(900) for EDLCs can be attributed to its unique structural features, i.e. the high surface area, well-developed mesopores and micropores and nitrogen doping. A high specific surface area leads to a high electrode–electrolyte interface for electric double layer formation, while the uninterrupted mesopores provide low-resistant pathways for ion diffusion, the micropores strengthen the charge accommodation.28,35,36 Furthermore, the nitrogen functional groups bring in pseudocapacitive interactions and help the electron transfer through the carbons. In addition, small size of the NOMCs particle also plays an important role to the high capacitances. It is evident that the electrolyte solution can penetrate a larger faction of the pore structure in case of smaller particles, resulting in higher capacitance.37 To investigated the cycling stability, 1000 cycles of charge/discharge cycles were performed at current density of 1.0 A g−1, as shown in Fig. 10c, HMC-60-3d(900) electrode retains up to 99.1% of its initial specific capacitance value.
Fig. 11 displays the EIS spectra for the carbon electrodes. The Nyquist plots of the NOMCs consist of a small semicircle at high frequency, a line with a slope close to 45° within the middle frequency, and almost vertical line at low frequency. The intercept Z-real at very high frequency corresponds to the electric series resistance (ESR).38 All the samples show comparable ESR of 0.13–0.21 Ω. The low ESR indicates the higher electrical conductivity of the carbon electrodes. The diameter of the semicircle on the Z′ axis in the high frequency region referred to the polarisation resistance (Rp) is associated with the surface properties of the porous electrode, corresponding to the interfacial faradic charge transfer resistance. No semicircle was observed for HMC-60-3d(450) and HMC-60-3d(600), indicating the lower impedance on electrode/electrolyte interface. This may be due to the hydrophilic surface by much residual functional groups on the surface of carbon electrodes obtained under lower carbonization temperatures. The Rp of HMC-60-3d(900) is as low as 0.17 Ω. The relatively low internal resistance of HMC-60-3d(900) in 6 M KOH aqueous solution indicates the high mass transfer/diffusion rate of ions into the pores.
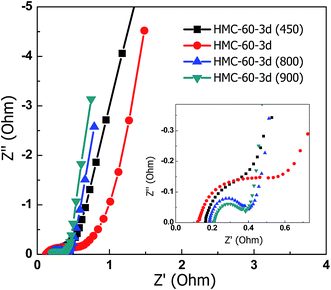 | ||
| Fig. 11 Nyquists plot of the NOMCs carbonized at different temperatures. The inset shows the enlarged plot of higher frequency part. | ||
3.3 CO2 capture performance
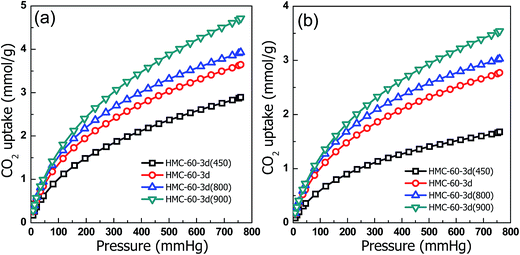
With distinctively abundant narrow micropores and nitrogen functionality, the synthesized NOMCs have potential for applications in CO2 capture. As shown in Fig. 12, the CO2 adsorption isotherms of the NOMCs carbonized at different temperatures were collected at 0 and 25 °C. It is found that as the adsorption temperature increase from 0 to 25 °C, the CO2 capture capacity decreases. The samples carbonized at different temperatures show high CO2 capture capacity of 2.9–4.7 mmol g−1 at 0 °C and 1.7–3.5 mmol g−1 at 25 °C, comparable with that of the reported nitrogen-containing porous carbon materials.39 Considering the relatively low content of CO2 in flue gas, the CO2 capacities at low pressure (e.g., 0.15 bar) are more valuable for the capture of CO2 from flue gas. HMC-60-3d(900) exhibits a CO2 capture capacity of 1.36 mmol g−1 at 0 °C and 0.15 bar, which is comparable with that of nitrogen-doped graphene-like meso-macroporous carbon with high nitrogen content of 15.7 wt% (1.49 mmol g−1 at 0 °C and 0.15 bar).40 Furthermore, one can found that the CO2 adsorption on NOMCs is a combination effect of nitrogen functionality and porosity. For example, although HMC-60-3d and HMC-60-3d(900) have similar total nitrogen contents (1.54 vs. 1.39 at%), the CO2 capacities of HMC-60-3d(900) (1.81 mmol g−1 at 0 °C and 0.15 bar; 1.36 mmol g−1 at 25 °C and 0.15 bar) are much higher than that of HMC-60-3d (1.48 mmol g−1 at 0 °C and 0.15 bar; 1.12 mmol g−1 at 25 °C and 0.15 bar), which is believed to be a result of the higher surface area of HMC-60-3d(900). At 0 and 25 °C (1 bar), the maximum CO2 uptake of HMC-60-3d(900) is 4.7 and 3.5 mmol g−1, respectively. The high CO2 capture capacity of HMC-60-3d(900) is comparable with that of the nitride OMCs (3.46 mmol g−1 at 25 °C),8 much higher than that of soft-templated OMCs (2.73 mmol g−1 at 25 °C),41 the nitrogen and magnesium codoped mesoporous carbon composites (2.26 mmol g−1 at 25 °C)42 and the hollow carbon spheres with high nitrogen content of 14.8% (2.67 mmol g−1 at 25 °C).43 It is clear that the prepared carbon materials by this simple LTA method achieve an excellent adsorption capacity for CO2 capture. This promising CO2 capture performance for NOMCs in our case can be attributed to the high surface area, large amounts of micropores and the nitrogen functional groups.As discussed above, the increased CO2 capture capacities are clearly revealed with elevating carbonization temperature. However, previous studies demonstrated that the adsorption capacity decreased with the increase of carbonization temperature due to the reducing surface basic nitrogen functional groups and slight enhancement of the textural properties.39 In order to determine the influence of both textural and surface chemistry properties on the performance of the obtained NOMCs, the CO2 capture capacities are corrected according to the pore volume (VTotal), narrow micropore volume (W0) and nitrogen content,44,45 as listed in Table 2. Normalisation of CO2 capacities by the total pore volume (Table 2) reflects the influence of surface chemistry properties on the CO2 uptake, while normalisation of the capture capacities by the narrow micropore volume (Table 2) reveals the effect of mesoporosity and wide microporosity together with surface chemistry properties of the samples on the CO2 uptake.45 The sample HMC-60-3d(900) generated at 900 °C exhibits the lowest capture capacities per total pore volume at 25 °C, although possessing the greatest textural development in terms of total pore and micropore volumes. This indicates that higher carbonization temperature has a negative effect on the chemistry properties of the adsorbent as it reduces the chemical affinity towards CO2 capture.39 The nitrogen-doped carbons treated at low carbonization temperature (HMC-60-3d(600) and HMC-60-3d(800)) exhibit greater capacities per total pore and narrow micropore volume than that of high temperature treated samples (HMC-60-3d(900)), indicating the chemistry properties of the samples favor the CO2 adsorption at low temperature (<800 °C), although their microporosity is not well developed.
| Sample | Normalized CO2 capture capacities at 25 °C | ||
|---|---|---|---|
| Vp (mmol CO2 per cm3) | W0 (mmol CO2 per cm3) | N content (mmol CO2 per mmol N) | |
| HMC-60-3d | 8.92 | 4.82 | 2.71 |
| HMC-60-3d(800) | 9.21 | 5.15 | 2.02 |
| HMC-60-3d(900) | 8.43 | 5.01 | 3.22 |
Normalization of CO2 capture capacities by the nitrogen content of the samples was also performed to isolate the effect of the texture on the CO2 uptake (Table 2). The samples with the largest micropore volumes (HMC-60-3d(900)) show the highest CO2 uptakes per mmol of N, indicating that the CO2 capture capacities of HMC-60-3d(900) were mainly physical adsorption.44 The discussion above reveals that the CO2 capture behavior of all the NOMCs is a combination of physical adsorption and chemical sorption, but not making an equal contribution. The CO2 capture capacities of HMC-60-3d and HMC-60-3d(800) carbons are strongly dominated by the surface chemistry properties. The CO2 uptake of HMC-60-3d(900) is mainly influenced by the adsorption on the narrow micropores, less controlled by the surface chemistry properties of the adsorbents, most probably due to less affinity to CO2 of the nitrogen functionalities present in these samples.
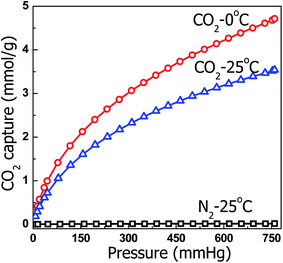
For practical applications, proper adsorbents must possess a high selectivity against other gases in addition to high CO2 capture capacity. The CO2 separation performance of the selected samples was evaluated. Fig. 13 shows the N2 adsorption isotherms of HMC-60-3d(900) at 25 °C and 1 bar, in comparison with their CO2 adsorption isotherms. HMC-60-3d(900) exhibits N2 adsorption capacity of only 0.26 mmol g−1 at ambient pressure, which is less than one tenth of the amount of CO2, suggesting that HMC-60-3d(900) could also be a potential selective adsorbent for CO2 adsorption.
4. Conclusions
The LTA route is demonstrated to be a facile, cost-effective and readily reproducible synthetic approach for the preparation of NOMCs with Im![[3 with combining macron]](https://www.rsc.org/images/entities/char_0033_0304.gif) m cubic structure at low-temperature of 60 °C. Resorcinol and HMT are employed as carbon precursor and triblock copolymer F127 as template under basic conditions. The autoclaving time ≥2 d are favorable for the formation of highly ordered Im
m cubic structure at low-temperature of 60 °C. Resorcinol and HMT are employed as carbon precursor and triblock copolymer F127 as template under basic conditions. The autoclaving time ≥2 d are favorable for the formation of highly ordered Im![[3 with combining macron]](https://www.rsc.org/images/entities/char_0033_0304.gif) m mesostructure at autoclaving temperature of 60 °C. These NOMCs possess a moderate amount of nitrogen (1.39–2.1 at%), a large fraction of fine micropores, high surface area and uninterrupted mesopores, leading to high capacitance (193 F g−1 at 1.0 A g−1), excellent rate capability (174 F g−1 at 10 A g−1), outstanding cycling stability (99.1% capacity retention after 500 cycles at 1.0 A g−1) and high CO2 adsorption capacities (3.5 mmol g−1, at 25 °C and 780 mm Hg). The assemblies of the resin and the surfactant in the solution under autoclaving conditions may be useful for the large-scale industrial production of NOMCs materials.
m mesostructure at autoclaving temperature of 60 °C. These NOMCs possess a moderate amount of nitrogen (1.39–2.1 at%), a large fraction of fine micropores, high surface area and uninterrupted mesopores, leading to high capacitance (193 F g−1 at 1.0 A g−1), excellent rate capability (174 F g−1 at 10 A g−1), outstanding cycling stability (99.1% capacity retention after 500 cycles at 1.0 A g−1) and high CO2 adsorption capacities (3.5 mmol g−1, at 25 °C and 780 mm Hg). The assemblies of the resin and the surfactant in the solution under autoclaving conditions may be useful for the large-scale industrial production of NOMCs materials.
Acknowledgements
This work was supported by the National Natural Science Foundation of China (No. 51302154, 51402160 and 21573115), Natural Science Foundation of Shandong Province, China (BS2013CL032 and ZR2014EMQ011), and the SDUST Research Fund (2015YQJH101).References
- J. Tang, J. Liu, C. L. Li, Y. Q. Li, M. O. Tade, S. Dai and Y. Yamauchi, Angew. Chem., Int. Ed., 2015, 54, 588–593 CAS.
- J. Xu, A. Wang and T. Zhang, Carbon, 2012, 50, 1807–1816 CrossRef CAS.
- L. Liu, F. Y. Wang, G. S. Shao and Z. Y. Yuan, Carbon, 2010, 48, 2660–2664 CrossRef CAS.
- X. Q. Wang, C. D. Liang and S. Dai, Langmuir, 2008, 24, 7500–7508 CrossRef CAS PubMed.
- C. Liang and S. Dai, J. Am. Chem. Soc., 2006, 128, 5316–5317 CrossRef CAS PubMed.
- L. Liu, F. Y. Wang, G. S. Shao and Z. Y. Yuan, Carbon, 2010, 48, 2089–2099 CrossRef CAS.
- F. Zhang, Y. Meng, D. Gu, Y. Yan, C. Yu, B. Tu and D. Zhao, J. Am. Chem. Soc., 2005, 127, 13508–13509 CrossRef CAS PubMed.
- L. Liu, Q. F. Deng, T. Y. Ma, X. Z. Lin, X. X. Hou, Y. P. Liu and Z. Y. Yuan, J. Mater. Chem., 2011, 21, 16001–16009 RSC.
- G. P. Hao, W. C. Li, S. Wang, G. H. Wang, L. Qi and A. H. Lu, Carbon, 2011, 49, 3762–3772 CrossRef CAS.
- A. H. Lu, B. Spliethoff and F. Schüth, Chem. Mater., 2008, 20, 5314–5319 CrossRef CAS.
- Y. P. Zhu, Y. L. Liu, Y. P. Liu, T. Z. Ren, T. H. Chen and Z. Y. Yuan, ChemCatChem, 2015, 7, 2903–2909 CrossRef CAS.
- D. Liu, J. H. Lei, L. P. Guo, D. Y. Qu, Y. Li and B. L. Su, Carbon, 2012, 50, 476–487 CrossRef CAS.
- Y. P. Zhu, Y. P. Liu and Z. Y. Yuan, Chem. Commun., 2016, 52, 2118–2121 RSC.
- D. Liu, J. H. Lei, L. P. Guo and K. J. Deng, Carbon, 2011, 49, 2113–2119 CrossRef CAS.
- M. Chen, L. L. Shao, Y. P. Liu, T. Z. Ren and Z. Y. Yuan, J. Power Sources, 2015, 283, 305–313 CrossRef CAS.
- K. Ai, Y. L. Liu, C. P. Ruan, L. H. Lu and G. Q. Lu, Adv. Mater., 2013, 25, 998–1003 CrossRef CAS PubMed.
- Y. Fang, D. Gu, Y. Zou, Z. X. Wu, F. Y. Li, R. C. Che, Y. H. Deng, B. Tu and D. Y. Zhao, Angew. Chem., Int. Ed., 2010, 49, 7987–7991 CrossRef CAS PubMed.
- C. Wang, L. Sun, Y. Zhou, P. Wan, X. Zhang and J. Qiu, Carbon, 2013, 59, 537–546 CrossRef CAS.
- X. Yan, Y. Liu, X. Fan, X. Jia, Y. Yu and X. Yang, J. Power Sources, 2014, 248, 745–751 CrossRef CAS.
- L. Sun, C. Tian, Y. Fu, Y. Yang, J. Yin, L. Wang and H. Fu, Chem.–Eur. J., 2014, 20, 564–574 CrossRef CAS PubMed.
- C. H. Choi, S. H. Park, M. W. Chung and S. I. Woo, Carbon, 2013, 55, 98–107 CrossRef CAS.
- S. Yin and T. Sato, J. Mater. Chem. A, 2015, 15, 4584–4587 Search PubMed.
- D. Y. Zhao, Q. S. Huo, J. L. Feng, B. F. Chmelka and G. D. Stucky, J. Am. Chem. Soc., 1998, 120, 6024–6036 CrossRef CAS.
- J. R. Matos, M. Kruk, L. P. Mercuri, M. Jaroniec, L. Zhao, T. Kamiyama, O. Terasaki, T. J. Pinnavaia and Y. Liu, J. Am. Chem. Soc., 2003, 125, 821–829 CrossRef CAS PubMed.
- J. R. Matos, M. Kruk, L. P. Mercuri, M. Jaroniec, T. Asefa, N. Coombs, G. A. Ozin, T. Kamiyama and O. Terasaki, Chem. Mater., 2002, 14, 1903–1905 CrossRef CAS.
- J. Yu, M. Guo, F. Muhammad, A. Wang, F. Zhang, Q. Li and G. Zhu, Carbon, 2014, 69, 502–514 CrossRef CAS.
- X. Q. Wang, C. G. Liu, D. Neff, P. F. Fulvio, R. T. Mayes, A. Zhamu, Q. Fang, G. R. Chen, H. M. Meyer, B. Z. Jang and S. Dai, J. Mater. Chem. A, 2013, 1, 7920–7926 CAS.
- G. Z. Shen, X. R. Sun, H. W. Zhang, Y. Liu, J. Zhang, A. Meka, L. Zhou and C. Z. Yu, J. Mater. Chem. A, 2015, 3, 24041–24048 CAS.
- J. Wei, D. D. Zhou, Z. K. Sun, Y. H. Deng, Y. Y. Xia and D. Y. Zhao, Adv. Funct. Mater., 2013, 23, 2322–2328 CrossRef CAS.
- Q. Shi, R. Y. Zhang, Y. Y. Lu, Y. H. Deng, A. A. Elzatahrya and D. Y. Zhao, Carbon, 2015, 84, 335–346 CrossRef CAS.
- C. Q. Yuan, X. H. Liu, M. Y. Jia, Z. X. Luo and J. N. Yao, J. Mater. Chem. A, 2015, 3, 3409–3415 CAS.
- C. Liu, J. Wang, J. Li, X. Hu, P. Lin, J. Shen, X. Sun, W. Han and L. Wang, J. Mater. Chem. A, 2016, 4, 11916–11923 CAS.
- T. Y. Yang, R. F. Zhou, D. W. Wang, S. P. Jiang, Y. Yamauch, S. Z. Qiao, M. J. Monteiro and J. Liu, Chem. Commun., 2015, 51, 2518–2521 RSC.
- H. H. Xu, X. L. Hu, Y. M. Sun, H. L. Yang, X. X. Liu and Y. H. Huang, Nano Res., 2015, 8, 1148–1158 CrossRef CAS.
- X. M. Ma, L. H. Gan, M. X. Liu, P. K. Tripathi, Y. H. Zhao, Z. J. Xu, D. Z. Zhu and L. W. Chen, J. Mater. Chem. A, 2014, 2, 8407–8415 CAS.
- M. X. Liu, J. S. Qian, Y. H. Zhao, D. Z. Zhu, L. H. Gan and L. W. Chen, J. Mater. Chem. A, 2015, 3, 11517–11526 CAS.
- N. P. Wickramaratne, J. T. Xu, M. Wang, L. Zhu, L. M. Dai and M. Jaroniec, Chem. Mater., 2014, 26, 2820–2828 CrossRef CAS.
- T. Z. Ren, L. Liu, Y. Y. Zhang and Z. Y. Yuan, J. Solid State Electrochem., 2013, 17, 927–935 CrossRef CAS.
- G. P. Hao, W. C. Li, D. Qian and A. H. Lu, Adv. Mater., 2010, 22, 853–857 CrossRef CAS PubMed.
- F. Liu, K. Huang, S. Ding and S. Dai, J. Mater. Chem. A, 2016, 4, 14567–14571 CAS.
- Z. Z. Zhang, B. D. Wang, C. M. Zhu, P. Gao, Z. Y. Tang, N. N. Sun, W. Wei and Y. H. Sun, J. Mater. Chem. A, 2015, 3, 23990–23999 CAS.
- Z. Z. Zhang, C. M. Zhu, N. N. Sun, H. Wang, Z. Y. Tang, W. Wei and Y. H. Sun, J. Phys. Chem. C, 2015, 119, 9302–9310 CAS.
- S. S. Feng, W. Li, Q. Shi, Y. H. Li, J. C. Chen, Y. Ling, A. M. Asiri and D. Y. Zhao, Chem. Commun., 2014, 50, 329–331 RSC.
- L. Liu, Q. F. Deng, X. X. Hou and Z. Y. Yuan, J. Mater. Chem., 2012, 22, 15540–15548 RSC.
- C. Pevida, T. C. Drage and C. E. Snape, Carbon, 2008, 46, 1464–1474 CrossRef CAS.
| This journal is © The Royal Society of Chemistry 2017 |


