DOI:
10.1039/C6RA26802A
(Paper)
RSC Adv., 2017,
7, 4492-4500
Kinetic, equilibrium and thermodynamic studies for phosphate adsorption on aluminum hydroxide modified palygorskite nano-composites
Received
14th November 2016
, Accepted 2nd January 2017
First published on 16th January 2017
Abstract
The objectives of this study were to synthesize aluminum hydroxide modified palygorskite nano-composites (Al–PG) and to investigate their suitability as adsorbents to remove phosphate from aqueous solution. The nano-composites were characterized by XRD, XRF and TEM. The characterization results showed that aluminum hydroxide gel was successfully loaded onto palygorskites (PGs) with diameters of nanometers, and the crystal composition of PG had not been changed after modification. The effects of modified mass ratios, pH, co-existing anions, and initial phosphate concentrations on phosphate removal were investigated by batch experiments. The Freundlich model provided a better description for the adsorption process than the Langmuir model. The maximum phosphate adsorption capacity was 16.86 mg g−1 for Al–PG, while it was 4.08 mg g−1 for natural PG. Of the adsorption isotherms and thermodynamic studies considered, the adsorption of phosphate by Al–PG was chemisorption, endothermic and spontaneous. Kinetic studies indicated that the adsorption of phosphate onto Al–PG can be fitted by a pseudo-second-order kinetic model very well. Thus, the cost-effective and high adsorption capacity of Al–PG has wide potential use in phosphate removal from aqueous solutions.
1. Introduction
In surface water, phosphorus concentrations exceeding 0.05 mg L−1 may cause eutrophication.1 Eutrophication is the process of carbon dioxide adsorption and organic matter generation, which is mainly controlled by phosphorus bioavailability.2 However, entrophication deteriorates water quality, characterized by the bloom of aquatic plants, growth of algae and depletion of dissolved oxygen. To control eutrophication, techniques such as physical (settling, filtration), chemical (chemical precipitation with aluminum, iron and calcium salts) and biological treatments (that rely on bacteria, algae, plants, or intracellular bacteria polyphosphates accumulation) have been successfully applied. Increasing attention has been paid to adsorptive removal of phosphate from aqueous solution in the last decades.3 Adsorption is recommended for phosphate removal mainly because it is a cost-effective method and it has a wide variety of adsorbents.1 For phosphate removal, common adsorbents include metal and metal (hydr)oxides (aluminum and aluminum (hydr)oxides, iron and iron (hydr)oxides, zirconium (hydr)oxides), silicates, alcite, manganese dioxide, mud, fly ash, and oxide tailings.3,5–17 Studies indicated that metal (hydr)oxides have high affinity and selectivity towards phosphate, while fly ash and tailings are low-cost and easily available. However, these adsorbents have inherent limitations on application to phosphate removal, such as low adsorption capacity, poor adsorption kinetics or potential danger of secondary pollution.
Studies have revealed that phosphate has a relatively strong affinity for mineral surface.18 In recent years, many studies have investigated phosphate removal onto natural and modified minerals, such as modified bentonite, modified palygorskite, montmorillonite, zeolite, goethite, and dolomite.2,3,16,19–24 PG is a biocompatible natural clay characterized by a porous crystalline structure with tetrahedral layers and longitudinal sideline chains.25 PG ((Mg,Al,Fe)5Si8O20(OH)2·(H2O)4·4H2O) with Mg, Al, or Fe preferentially located in octahedral sites is a hydrated magnesium aluminum silicate which presents in nature as a nano-fibrous clay mineral. The physic-chemical characters of PG, e.g., high surface area and porosity, thermal resistance, chemical inertness, etc., make it a potentially attractive adsorbent.3 Ye et al.3 found that the modified PG (hydrochloric acid and/or thermal treatment) had faster kinetics and higher adsorption capacities for phosphate than the natural PG. It proved that the adsorption capacity of PG can be enhanced by modifying its texture by means of chemical and/or thermal treatment. As mentioned above, metal (hydr)oxides have a high affinity of phosphate, especially aluminum (hydr)oxides and/or iron (hydr)oxides. The adsorption capacity is mainly determined by the population of surface functional groups on the adsorbents.26 Thus, aluminum (hydr)oxides and/or iron (hydr)oxides were proposed to coat onto the surface of PG to increase phosphate removal efficiency. However, Yan et al.19 employed hydroxyl-aluminum, hydroxyl-iron and hydroxyl-iron–aluminum pillared bentonites to adsorb phosphate and found that hydroxyl-aluminum modified bentonites had the highest phosphate adsorption capacity (Al–Bent 12.7 mg g−1, Fe–Bent 11.2 mg g−1, Fe–Al–Bent 10.5 mg g−1) and the highest BET surface area (Al–Bent 200 m2 g−1, Fe–Bent 143 m2 g−1, Fe–Al–Bent 94.9 m2 g−1). Gao et al.27 compared different phosphate species adsorption by ferric and alum water treatment residuals (FAR). The contents of Fe and Al in FAR were respectively 89.06 mg g−1 and 40.06 mg g−1, and the fractions of adsorbed P were 31.71% Fe–P and 52.62% Al–P. Thus, higher P adsorption capacity by Al oxide/hydroxide modification than ferric oxide/hydroxide can be concluded. However, less attention has been paid on modified PG with aluminum (hydr)oxides coated to remove phosphate.
The objectives of this research were to synthesize aluminum hydroxide modified PG nano-composites (Al–PG), and to systematically investigate its applying on phosphate removal from aqueous solutions. The effects of pH, selectivity, and modification mass ratio on phosphate adsorption on Al–PG were examined by batch experiments. The adsorption isotherms, thermodynamic parameters, and kinetic models were applied to discuss the adsorption mechanism of phosphate on Al–PG.
2. Materials and methods
2.1. Materials
Natural PG clay used in the experiments was obtained from Guanshan in Anhui Province, China, which was ground and selected for particle sizes of <75 μm. PG samples (5 g) were dispersed in deionized water (400 mL) by magnetic stirrers for 2 h, then mixed with 1 M aluminum chloride (AlCl3·6H2O) solution at fixed ratios (1.5, 2, 2.5, 3, 3.5, 4 mmol Al per g PG) dropwise. The pH value was adjusted by addition of NaOH solution (1 M) and HCl solution (1 M) until pH = 7 ± 0.1 obtained. After stirring for 24 h, the mixtures were centrifuged, washed ten times with deionized water, and then dried at 80 °C for 48 h. The obtained Al–PG was ground and screened though a 200 mesh sieve (75 μm).
Stock phosphate solution (5000 mg P per L) was prepared by dissolving 21.9686 g KH2PO4 into 1 L deionized water. All working solutions were prepared by diluting this stock solution with deionized water.
2.2. Batch adsorption experiments
To investigate the impact of modification mass ratios on the adsorption capacity of phosphate, natural and modified PG with the different modification mass ratios (Al–PG1: 1.5, Al–PG2: 2, Al–PG3: 2.5, Al–PG4: 3, Al–PG5: 3.5, Al–PG6: 4 mmol Al per g PG) were prepared. Phosphate solutions (25 mL, 1000 mg L−1) were added into 150 mL conical flasks with stoppers, and then the pH of solutions was adjusted to 5.0 ± 0.1. After adding 0.5 g of adsorbent, the flasks were stirred at 200 rpm in thermostatic shakers for 24 h at 298 K. After the mixture was centrifuged, the supernatant was filtered through 0.45 μm membrane filter prior to the determination of phosphate concentrations. The equilibrium adsorptive capacity was calculated by the following equation:| |
 | (1) |
where Qt is the adsorptive capacity at time t, mg g−1; C0 is the initial concentration of phosphate in the solution, mg L−1; Ct is the concentration of phosphate in the solution at time t, mg L−1; V is the volume of the solution, L; and W is the mass of the adsorbent, g.
The effect of initial pH was tested using a similar procedure. Phosphate solution (25 mL, 500 mg L−1) was mixed with adsorbents (0.5 g, PG & Al–PG4) at initial pH of 4, 5, 6, 7, 8, 9, and 10, respectively.
Adsorption isotherms for phosphate were carried out in thermostatic shakers for 24 h at desired temperatures (298, 308, 318 K). Adsorbents (0.5 g, PG & Al–PG4) were mixed with phosphate solutions (25 mL) at different initial concentrations ranged from 5 to 1000 mg L−1 (i.e. 5, 10, 25, 50, 100, 300, 500, 800, 1000 mg L−1) at pH of 5.
Adsorption kinetics for phosphate were evaluated at pH = 5 and at an ambient temperature of 298 K. Adsorbents (0.5 g, PG & Al–PG4) were added to phosphate solutions (25 mL) with an initial concentration of 500 mg L−1. Samples obtained at different time intervals of 0.25, 0.5, 1, 2, 3, 4, 6, 12 and 24 h were examined for phosphate concentrations.
Adsorption selectivity was examined by evaluating the effect of coexisting anions on the phosphate adsorptive capacity at a pH of 5.5. 0.5 g adsorbents (Al–PG4) were added in 25 mL of 30 mg L−1 phosphate solutions, which contained 0 (a control) and 0.001 M sodium salt forms of chloride, nitrate, sulfate, and bicarbonate, respectively.
2.3. Analysis methods
Phosphate concentrations in liquid samples were analyzed by the molybdenum-blue ascorbic acid method with a spectrophotometer (V-1100D, Mapada Co., Shanghai, China). Elemental compositions of PG and Al–PG (Al–PG4) were determined by using X-ray fluorescence (XRF) (AXios mAX XRF, PANalytical B.V., Holland). Mineral phases were identified by X-ray diffraction (XRD) using a D/max-RB powder diffraction meter (Rigaku, Japan), with a Cu-target operated at 40 kV, 100 mA. The XRD patterns were taken in the range of 5–70° at a scan rate of 4° min−1, which were analyzed using the software (Search-Match) by comparing the experimental data with those included in the Joint Committee of Powder Diffraction Standards (JCPDSs) database. Mineral morphologies of PG and Al–PG were analyzed by transmission electron microscopy (TEM) (Hitachi Co., Tokyo, Japan).
3. Results and discussion
3.1. Characterization of adsorbents
XRF was applied to analyze the elemental compositions of PG and Al–PG (Al–PG4), presented in percentage of element's highest oxidation state (Table 1). From Table 1, the highest contents of SiO2 were found in both PG and Al–PG. A higher amount of Al2O3 in Al–PG than in PG demonstrated that Al(OH)3 was successfully enriched onto Al–PG. The mineral samples also contain minor amounts of other elements such as S, P, Mn, Ni, Zn, Ba (<0.1%). According to the content of Al2O3 in both PG and Al–PG, the relative loading rate of Al(OH)3 was calculated as 15.93% in Al–PG.
Table 1 Bulk chemical analysis of natural PG and modified PG
| Constituent (wt%) |
SiO2 |
Al2O3 |
MgO |
Fe2O3 |
CaO |
K2O |
Na2O |
TiO2 |
LOIa |
| Loss on ignition at 1000 °C. |
| PG |
57.396 |
8.755 |
14.763 |
4.475 |
1.803 |
0.951 |
0.066 |
0.593 |
21.46 |
| Al–PG |
51.306 |
19.171 |
11.648 |
4.054 |
0.392 |
0.877 |
0.058 |
0.58 |
22.36 |
XRD patterns of PG, Al–PG and their calcined products at 1000 °C (PG1000, Al–PG1000) are illustrated in Fig. 1. Diffraction patterns at 2θ = 8.4, 14.0, 16.4, 19.8, 20.9, 23.0, and 35.4° are identified as PG comparing with the standard database. The characteristic peaks of quartz can be found at 20.8, 27.0, 50.4, and 61.5°. The natural PG contained a little amount of dolomite according to the weak intensity of characteristic peaks at 30.9 and 41.2°. The XRD spectrum of Al–PG showed no significant differences from PG, indicating that the crystal composition of PG was not changed after modification. The characteristic diffraction peaks of aluminum hydroxide were not found in the patterns, considering that the aluminum hydroxide gel is amorphous. The characteristic diffraction peaks of PG disappeared when it was calcined at temperatures higher than 1000 °C. The thermal structure evolution is an amorphous process along with complete loss of crystal water and structural water, and collapse pores. Compared with PG and Al–PG, a crystalline aluminum compound-hercynite was formed according to the characteristic peaks at 44.9 and 65.3° in Al–PG1000. The crystallization of hercynite after the calcination of Al–PG strongly confirmed the presence of aluminum hydroxide gel in Al–PG.
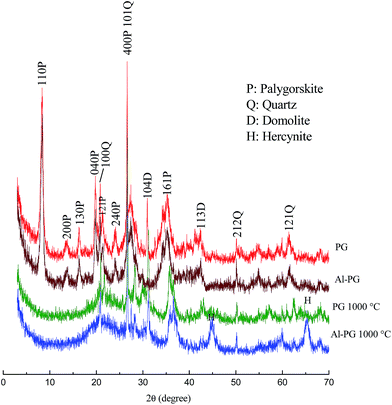 |
| | Fig. 1 XRD patterns of Al–PG, PG and their calcinates. | |
TEM analysis illustrates nano-rod structures the natural and modified PG (Fig. 2). PG crystals were randomly oriented straight fibers and arranged in bundles. The surface of natural PG is flat (Fig. 2A), and point-like phases dispersed on the surface of PG with diameters range of 15–21 nm after modification (Fig. 2B). All the analysis of XRF, XRD, and TEM confirmed that aluminum hydroxide gel was successfully loaded on PG. The specific surface areas (SSA) of PG and Al–PG were 189.389 m2 g−1 and 212.872 m2 g−1, respectively. The increase in SSA of Al–PG indicated that aluminum hydroxide gel occupied the surface area of PG.
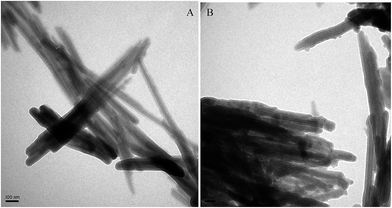 |
| | Fig. 2 TEM images of PG (A) and Al–PG (B). | |
3.2. Effect of modification mass ratio
The maximum adsorption capacity of phosphate was 4.08 mg g−1 at 298 K for PG (Fig. 3), which only accounted for 34.78% of the maximum adsorption amount of Al–PG1 at the lowest mass ratio of 1.5 mmol g−1. The highest adsorption amount was 18.34 mg g−1 for Al–PG6 at the highest mass ratio of 4 mmol g−1. The higher positively charged of Al–PG surface was observed with increasing more Al(OH)3 loading. Therefore, the increase of adsorption amounts of phosphate on Al–PG with increasing Al content could be attributed to the electrostatic attraction between the positively charged of Al–PG and negative charged phosphate species. Considering the cost of the adsorbent, the modification mass ratio of 3 mmol Al per g PG (Al–PG4) with a maximum adsorption amount of 16.86 mg g−1 was selected for preparing modified PG in the following research.
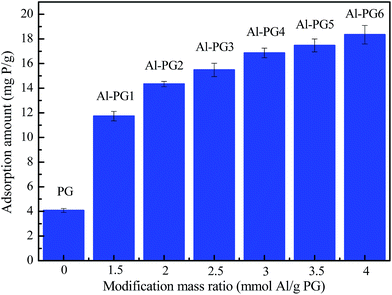 |
| | Fig. 3 Effect of modification mass ratio on adsorption capacity (C0 = 1000 mg L−1, pH = 5, t = 24 h, T = 298 K). | |
3.3. Effect of initial pH
Fig. 4A shows the adsorption of phosphate on Al–PG and PG as a function of initial pH. This clearly implies that phosphate adsorption onto both Al–PG and PG were pH dependent. Acidic conditions favored both Al–PG and PG in adsorbing phosphate, with a maximum uptake of 11.93 mg P per g and 4.70 mg P per g at pH 4 on Al–PG and PG, respectively. The dominant mechanism of phosphate adsorption onto Al–PG was assumed to be ion-exchange between hydroxyls on the adsorbent surface and phosphate in the solution. As shown in Fig. 4B, the main species of phosphorus in aqueous solution are H2PO4− at pH 4–6, HPO42− species at pH 9–11. Due to different negative charges between HPO42− and H2PO4−, HPO42− exchanges more hydroxyls than H2PO4−. As a consequence, the adsorption amount on Al–PG decreased in alkaline solution because of HPO42− occupying more binding sites on the surface of Al–PG. In addition, the pHPZC (pH at point of zero charge) of PG and Al–PG calculated from potential titration were 6.5 and 7.8, respectively, indicating the more positive charged of Al–PG. The high pHPZC value for Al–PG could be due to the increase of Al(OH)3 loading. Moreover, phosphate is adsorbed onto clay mainly via electrostatic attraction and ligand exchange (for example, between phosphate and OH−).19 An increase in pH would lead to a rise in OH− ions, which would occupy more active sites on the surface of PG and enhance the competitive strength with phosphate. The similar trends were reported on phosphate adsorption onto beohmite, aluminum hydroxide, aluminum and iron oxides.1,4,6 Therefore, the optimum pH of Al–PG adsorbing phosphate is apt to the weak acid solution.
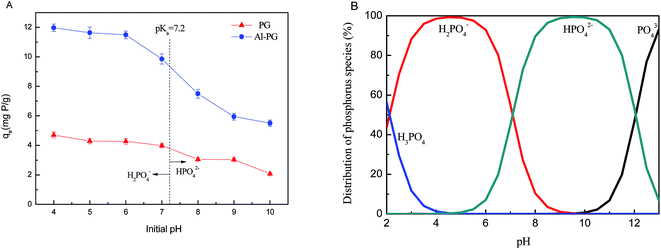 |
| | Fig. 4 (A) Effect of initial pH on phosphate adsorption on Al–PG and PG; (B) distribution of phosphorus species in aqueous solutions (C0 = 500 mg L−1, t = 24 h, T = 298 K). | |
3.4. Selectivity of phosphate adsorption
To estimate the selectivity of phosphate adsorption onto Al–PG, the amounts of phosphate adsorbed in multiple ions solutions were measured. The removal efficiencies of phosphate by Al–PG and PG in the multiple ions solutions are shown in Fig. 5. The effects of coexistence of chloride, sulfate, nitrate, and bicarbonate on phosphate sorption onto both Al–PG and PG showed no significant differences compared with the control experiment, which was phosphate solution prepared with deionized water. The result indicated Al–PG had widely potential utilization on phosphate removal from aqueous solution.
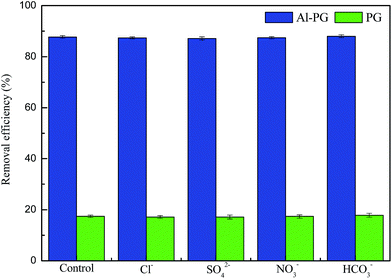 |
| | Fig. 5 The removal efficiency of phosphate in single and complex solution. | |
3.5. Adsorption isotherms
The adsorption isotherms of phosphate on Al–PG were fitted by two typical models: Langmuir and Freundlich, which are described as eqn (2) and (3):| |
 | (2) |
| |
 | (3) |
where Ce is the equilibrium concentration (mg L−1); qe is the adsorption capacity on adsorbent (mg g−1); qm refers to the maximum adsorption capacity at monolayer coverage (mg g−1). The values of k (L mg−1) and Kf (mg g−1) are the Langmuir and Freundlich adsorption constants, respectively. 1/n is a heterogeneous factor, which is related to adsorption intensity or surface heterogeneity.
The relative parameters of the Langmuir and Freundlich adsorption isotherms were calculated from the slope and intercept of the linear plots. High correlation coefficients (R2 > 0.9205) indicated that both the Langmuir and Freundlich models were acceptably fit the experimental data in this study. Higher the correlation coefficients of the Freundlich model (R2 > 0.9905) than that of the Langmuir model (R2 < 0.9562) suggest that the Freundlich model better described phosphate sorption onto both Al–PG and PG (Fig. 6 and 7). It indicated that the adsorption occurred on a structurally heterogeneous adsorbent.28 The maximum adsorption capacity on monomolecular layer of Al–PG calculated from the Langmuir model was 15.63 mg g−1 at 298 K, which was higher than other mineral and waste adsorbents such as: zeolite (2.19 mg g−1), pillared bentonites (12.7 mg g−1), iron hydroxide-eggshell (14.49 mg g−1) and modified PG (9 mg g−1) by hydrochloric acid and/or thermal treatment.3,16,19,29 The constant of 1/n in the Freundlich model is related with the adsorption intensity, which varies with the heterogeneity of materials. The values of 1/n were lower than 0.5 in this study, which suggested that the adsorption of phosphate on both Al–PG and PG were substantially favorable (Table 2).
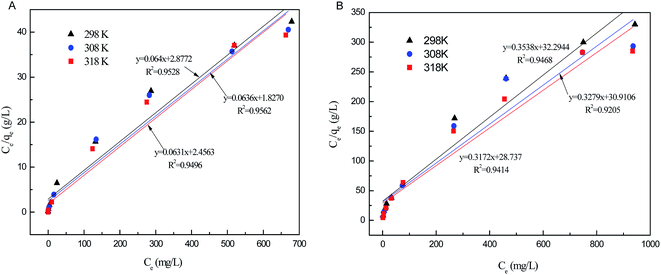 |
| | Fig. 6 The Langmuir isotherm plots of phosphate adsorption on Al–PG (A) and PG (B) (pH = 5, t = 24 h, T = 298 K). | |
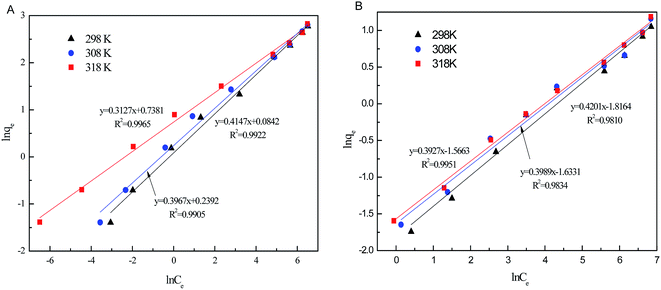 |
| | Fig. 7 The Freundlich isotherm plots of phosphate adsorption on Al–PG (A) and PG (B) (pH = 5, t = 24 h, T = 298 K). | |
Table 2 Relative parameters of the Langmuir, Freundlich and D–R models
| Adsorbent |
T (K) |
Langmuir |
Freundlich |
Dubinin–Redushckevich |
| qm (mg g−1) |
k |
R2 |
Kf (mg g−1) |
1/n |
R2 |
β (mol2 J−2) |
qm (mg g−1) |
E (kJ mol−1) |
R2 |
| Al–PG |
298 |
15.63 |
0.022 |
0.9528 |
1.09 |
0.415 |
0.9922 |
4 × 10⁻⁹ |
18.31 |
11.18 |
0.9869 |
| 308 |
15.85 |
0.026 |
0.9496 |
1.27 |
0.397 |
0.9905 |
3.5 × 10⁻⁹ |
18.60 |
11.95 |
0.9914 |
| 318 |
15.72 |
0.035 |
0.9562 |
2.09 |
0.313 |
0.9965 |
2.2 × 10⁻⁹ |
15.41 |
15.08 |
0.9793 |
| PG |
298 |
2.83 |
0.011 |
0.9468 |
0.16 |
0.420 |
0.9810 |
5.2 × 10⁻⁹ |
3.70 |
9.81 |
0.9878 |
| 308 |
3.05 |
0.011 |
0.9205 |
0.20 |
0.399 |
0.9834 |
4.5 × 10⁻⁹ |
3.72 |
10.54 |
0.9810 |
| 318 |
3.15 |
0.011 |
0.9414 |
0.21 |
0.393 |
0.9951 |
4.1 × 10⁻⁹ |
3.72 |
11.04 |
0.9786 |
Experimental data were also fitted by the D–R isotherm to reveal the type of adsorption (physical adsorption or chemical adsorption).30 The linear form of D–R isotherm is represented by the following eqn (4):
| |
ln![[thin space (1/6-em)]](https://www.rsc.org/images/entities/char_2009.gif) qe = ln qe = ln![[thin space (1/6-em)]](https://www.rsc.org/images/entities/char_2009.gif) qm − βε2 qm − βε2
| (4) |
where
β is the constant of the adsorption energy (mol
2 J
−2), related to the average energy of adsorption per mole of the sorbate as it is transferred to the surface of the solid from infinite distance in the solution;
ε is Polanyi potential, described as:
| |
 | (5) |
where
R is the gas constant (8.314 J mol
−1 K
−1);
T is the absolute temperature (K).
Moreover, E is the value of mean energy of adsorption (kJ mol−1). It can be calculated from the D–R parameter β as followed:
| |
 | (6) |
As seen in Fig. 8, the correlation coefficients of the D–R model for phosphate sorption on both Al–PG and PG were higher than 0.97, suggesting the D–R model was acceptably applied to fit the experiment data in this study. It is found that β and qm of phosphate adsorption on Al–PG are higher than on PG (Table 2). The value of E distinguish the type of sorption. It ranges from 1 to 8 kJ mol−1 for physical sorption, and ranges from 9 to 16 kJ mol−1 for chemical sorption. The E values of phosphate adsorption on Al–PG and PG are all higher than 9 kJ mol−1, indicating that phosphate adsorption on Al–PG and PG was essentially chemisorption (Table 2). According to the previous conclusion that the adsorption was apt to the weak acid solution, the attachment of phosphate must occur at the active sites on the surface of the Al–PG with Al–OH functional group presence, which contributed to the adsorption by chemical complexation/ion exchange.19
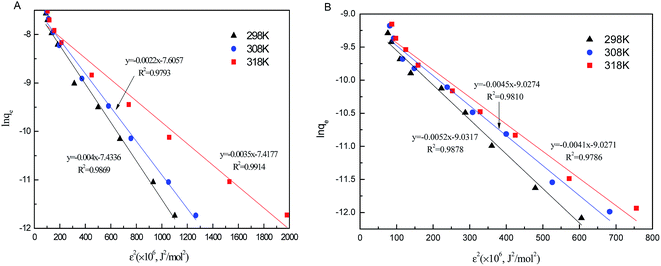 |
| | Fig. 8 The D–R isotherm plots of phosphate adsorption on Al–PG (A) and PG (B) (pH = 5, t = 24 h, T = 298 K). | |
3.6. Thermodynamic parameters
The thermodynamic parameters can be calculated from the temperature dependent adsorption isotherms based on following eqn (7)–(9):| |
 | (7) |
| |
ΔG0 = −RT![[thin space (1/6-em)]](https://www.rsc.org/images/entities/char_2009.gif) ln ln![[thin space (1/6-em)]](https://www.rsc.org/images/entities/char_2009.gif) Kd Kd
| (8) |
| |
 | (9) |
where Kd is the distribution coefficient, mL g−1; ΔG0 is the change of Gibbs energy, kJ mol−1.
The change of enthalpy (ΔH0) and entropy (ΔS0) can be determined by the slope and intercept of the plot of ln![[thin space (1/6-em)]](https://www.rsc.org/images/entities/char_2009.gif) Kd versus 1/T (Fig. 9). The negative values of ΔG0 and positive values of ΔH0 revealed that the processes of phosphate adsorption on Al–PG and PG were endothermic, feasible and spontaneous. The values of ΔG0 for phosphate adsorption decreased from −7.834 kJ mol−1 to −8.556 on Al–PG and from −2.749 to −3.320 kJ mol−1 on PG coupled with a rise temperature from 298 to 318 K (Table 3). The endothermic process of phosphate adsorption was enhanced by an increase in temperature for both Al–PG and PG, and there was a greater impact on Al–PG. The change of entropy (ΔS0) was 0.036 and 0.029 kJ mol−1 K−1 for phosphate adsorption on Al–PG and PG, respectively. The positive values of ΔS0 suggested that the randomness increased at the solid–liquid interface during the adsorption of phosphate on Al–PG and PG.
Kd versus 1/T (Fig. 9). The negative values of ΔG0 and positive values of ΔH0 revealed that the processes of phosphate adsorption on Al–PG and PG were endothermic, feasible and spontaneous. The values of ΔG0 for phosphate adsorption decreased from −7.834 kJ mol−1 to −8.556 on Al–PG and from −2.749 to −3.320 kJ mol−1 on PG coupled with a rise temperature from 298 to 318 K (Table 3). The endothermic process of phosphate adsorption was enhanced by an increase in temperature for both Al–PG and PG, and there was a greater impact on Al–PG. The change of entropy (ΔS0) was 0.036 and 0.029 kJ mol−1 K−1 for phosphate adsorption on Al–PG and PG, respectively. The positive values of ΔS0 suggested that the randomness increased at the solid–liquid interface during the adsorption of phosphate on Al–PG and PG.
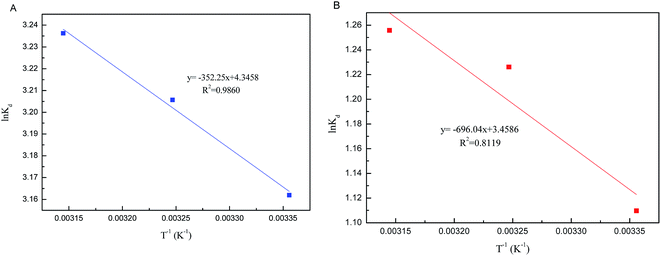 |
| | Fig. 9 Plots of ln![[thin space (1/6-em)]](https://www.rsc.org/images/entities/char_2009.gif) Kd vs. 1/T (A: Al–PG; B: PG). Kd vs. 1/T (A: Al–PG; B: PG). | |
Table 3 Thermodynamic parameters of phosphate adsorption onto Al–PG and PG
| Adsorbent |
T (K) |
qe (mg g−1) |
Ce (mg g−1) |
Kd (mL g−1) |
ΔG0 (kJ mol−1) |
ΔH0 (kJ mol−1) |
ΔS0 (kJ mol−1 K−1) |
| Al–PG |
298 |
16.04 |
679.18 |
23.62 |
−7.834 |
2.929 |
0.036 |
| 308 |
16.52 |
669.58 |
24.67 |
−8.209 |
| 318 |
16.86 |
662.83 |
25.44 |
−8.556 |
| PG |
298 |
2.86 |
942.88 |
3.03 |
−2.749 |
5.787 |
0.029 |
| 308 |
3.19 |
936.13 |
3.41 |
−3.139 |
| 318 |
3.28 |
934.44 |
3.51 |
−3.320 |
3.7. Adsorption kinetics
In order to identify the kinetic mechanism of adsorption process, four typical kinetic models were used to simulate the adsorption kinetics of phosphate onto Al–PG and PG. The kinetic equations including pseudo first-order model, pseudo second-order model, Elovich model and intraparticle diffusion model are described as follows:| |
Pseudo first-order equation: ![[thin space (1/6-em)]](https://www.rsc.org/images/entities/char_2009.gif) ln(qe − qt) = ln ln(qe − qt) = ln![[thin space (1/6-em)]](https://www.rsc.org/images/entities/char_2009.gif) qe − k1t qe − k1t
| (10) |
| |
 | (11) |
| |
 | (12) |
| | |
Intraparticle diffusion equation: qt = k3t0.5
| (13) |
where qt is the adsorbed amount at time t, mg g−1; qe is the adsorbed amount at equilibrium, mg g−1; k1 is the rate constant of pseudo first-order adsorption, g (mg−1 h−1); k2 is the rate constant of pseudo second-order adsorption, g (mg−1 h−1); the parameter ae is the initial adsorption rate, mg (g−1 h−1), and be is related to extent of surface coverage and activation energy for chemisorptions, g mg−1; k3 is the intraparticle diffusion rate constant, mg (g−1 h−0.5).
The relative parameters of the pseudo-first-order, pseudo-second-order, Elovich and intraparticle diffusion models were tabulated in Table 4. Constants k1 and k2 were respectively calculated from the slop of the line obtained by plotting ln(qe − qt) versus t in the pseudo-first-order model and the intercept of the line by plotting t/qt versus t in the pseudo-second-order model, while the initial adsorption rate ae was calculated from the intercept of the line obtained by plotting qt versus ln![[thin space (1/6-em)]](https://www.rsc.org/images/entities/char_2009.gif) t in the Elovich equation, and the intraparticle diffusion rate constant k3 was calculated from the slop of the line obtained by plotting qt and t0.5. Comparing the correlation coefficients of four kinetic models, it clearly revealed that the pseudo-second-order model best fit the adsorption kinetic of phosphate onto Al–PG and PG and the adsorption processes were chemisorptions.31 This conclusion was consistent with the fitting results from the D–R isotherm. This high applicability of the pseudo-second-order model for present kinetic data is also in agreement with other studies that the pseudo-second-order model can be satisfactorily described the kinetics of phosphate adsorption on natural minerals, modified minerals, hyroxy-aluminum, and hydroxyl-iron.10,14,19,21,24,32,33 Moreover, the theoretically adsorbed amount at equilibrium (11.12 mg g−1) calculated from pseudo-second-order model was close to the adsorbed amount at equilibrium obtained from experiment (11.90 mg g−1). The Elovich equation was successfully used to describe the second-order kinetic assuming that the actual solid surfaces are energetically heterogeneous.29 The initial adsorption rate ae was 111.23 mg (g−1 h−1) for phosphate adsorption onto Al–PG, which was much higher than 5.59 mg (g−1 h−1) for phosphate adsorption onto PG. According to the intra-particle diffusion model, (i) the plot of qt versus the square root of time (t0.5) should be linear if the intra-particle diffusion is involved in the adsorption process, (ii) if these lines pass through the origin when the intra-particle diffusion is the race-controlling step, and (iii) two or more slopes could occur in a multi-step adsorption process.29,34 As seen in Fig. 10d, the phosphate adsorption onto Al–PG and PG involve two steps presented a multilinearity. A rapid phosphate adsorption onto Al–PG occurred in the first 30 min, and then it slowed down in the following 23 hours. The fast adsorption was mainly attributed to the boundary layer diffusion or macro-pore diffusion, and the slow adsorption was due to the intraparticle diffusion or micro-sore diffusion.29,35
t in the Elovich equation, and the intraparticle diffusion rate constant k3 was calculated from the slop of the line obtained by plotting qt and t0.5. Comparing the correlation coefficients of four kinetic models, it clearly revealed that the pseudo-second-order model best fit the adsorption kinetic of phosphate onto Al–PG and PG and the adsorption processes were chemisorptions.31 This conclusion was consistent with the fitting results from the D–R isotherm. This high applicability of the pseudo-second-order model for present kinetic data is also in agreement with other studies that the pseudo-second-order model can be satisfactorily described the kinetics of phosphate adsorption on natural minerals, modified minerals, hyroxy-aluminum, and hydroxyl-iron.10,14,19,21,24,32,33 Moreover, the theoretically adsorbed amount at equilibrium (11.12 mg g−1) calculated from pseudo-second-order model was close to the adsorbed amount at equilibrium obtained from experiment (11.90 mg g−1). The Elovich equation was successfully used to describe the second-order kinetic assuming that the actual solid surfaces are energetically heterogeneous.29 The initial adsorption rate ae was 111.23 mg (g−1 h−1) for phosphate adsorption onto Al–PG, which was much higher than 5.59 mg (g−1 h−1) for phosphate adsorption onto PG. According to the intra-particle diffusion model, (i) the plot of qt versus the square root of time (t0.5) should be linear if the intra-particle diffusion is involved in the adsorption process, (ii) if these lines pass through the origin when the intra-particle diffusion is the race-controlling step, and (iii) two or more slopes could occur in a multi-step adsorption process.29,34 As seen in Fig. 10d, the phosphate adsorption onto Al–PG and PG involve two steps presented a multilinearity. A rapid phosphate adsorption onto Al–PG occurred in the first 30 min, and then it slowed down in the following 23 hours. The fast adsorption was mainly attributed to the boundary layer diffusion or macro-pore diffusion, and the slow adsorption was due to the intraparticle diffusion or micro-sore diffusion.29,35
Table 4 Kinetic parameters of phosphate adsorption onto Al–PG and PG
| Kinetic model |
Pseudo first-order |
Pseudo second-order |
Simple Elovich |
Intraparticle diffusion |
| qe (mg g−1) |
k1 (h−1) |
R2 |
qe (mg g−1) |
k2 (g mg−1 h−1) |
R2 |
ae (mg (g−1 h−1)) |
be (g mg−1) |
R2 |
k3 (mg g−1 h−0.5) |
R2 |
| Al–PG |
4.93 |
0.111 |
0.7161 |
11.12 |
0.089 |
0.9928 |
111.23 |
0.685 |
0.8999 |
1.3830 |
0.7240 |
| PG |
1.37 |
0.212 |
0.9552 |
2.20 |
0.353 |
0.9989 |
5.592 |
2.660 |
0.9857 |
0.3585 |
0.8060 |
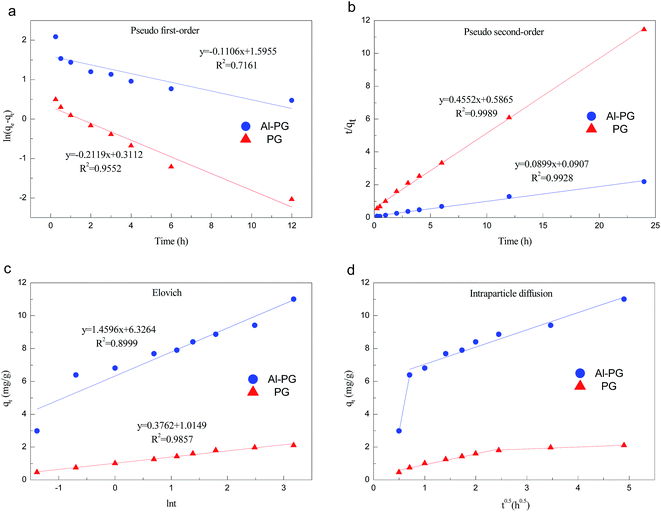 |
| | Fig. 10 Kinetic models of phosphate adsorption on Al–PG and PG (a: the pseudo-first-order model, b: the pseudo-second-order model, c: the Elovich model, d: the intraparticle diffusion model). | |
4. Conclusions
The Al–PG was successfully synthesized, which constituted crystals of diameters of nanometers. Al–PG had a better performance for phosphate removal than natural PG. The Freundlich model and the pseudo-second-order model respectively provided the best description of the adsorption isotherm and kinetics for the adsorption of phosphate onto Al–PG. Thermodynamic parameters determined that the adsorption process of phosphate onto Al–PG was endothermic and spontaneous. The fitting results of the D–R isotherm indicated that phosphate removal by Al–PG was chemisorption. The intraparticle diffusion model presented that the phosphate adsorption onto Al–PG involved two adsorption steps: (i) the boundary layer diffusion or macro-pore diffusion, and (ii) the intraparticle diffusion or micro-sore diffusion. The low-cost and high adsorption capacity of Al–PG can be a promising adsorbent widely utilized on phosphate removal from aqueous solution.
Acknowledgements
The authors would like to thank the financial support provided by National Natural Science Foundation of China (41572028), the Scientific Research Foundation for the Returned Overseas Chinese Scholars, the Natural Science Foundation of Fujian Province, China (2016J05140), and College Students Innovation Project (201511062005).
References
- A. F. de Sousa, T. P. Brage, E. C. C. Gomes and A. Valentini, Chem. Eng. J., 2012, 201, 143–149 CrossRef.
- V. Kuroki, G. E. Bosco, P. S. Fadini, A. A. Mozeto, A. R. Cestari and W. A. Carvalho, J. Hazard. Mater., 2014, 274, 124–131 CrossRef CAS PubMed.
- H. Ye, F. Chen, Y. Sheng, G. Sheng and J. Fu, Sep. Purif. Technol., 2006, 50, 283–290 CrossRef CAS.
- S. Tanada, M. Kabayama, N. Kawasaki, T. Sakiyama, T. Nakamura, M. Araki and T. Tamura, J. Colloid Interface Sci., 2003, 257, 135–140 CrossRef CAS PubMed.
- A. Genz, A. Kornmuller and M. Jekel, Water Res., 2004, 38, 3523–3530 CrossRef CAS PubMed.
- X. H. Guan, S. Chii and G. H. Chen, J. Colloid Interface Sci., 2006, 296, 51–58 CrossRef CAS PubMed.
- J. Majzlan, Environ. Sci. Technol., 2011, 45, 4726–4732 CrossRef CAS PubMed.
- S. Yoon, C. Lee, J. Park, J. Kin, S. Kim, S. Lee and J. Choi, Chem. Eng. J., 2014, 236, 341–347 CrossRef CAS.
- D. Conidi and W. J. Parker, Water Res., 2015, 84, 323–332 CrossRef CAS PubMed.
- Y. Su, H. Cui, Q. Li, S. Gao and J. Shang, Water Res., 2013, 47, 5018–5026 CrossRef CAS PubMed.
- J. Zhang, Z. Shen, W. Shan, Z. Chen, Z. Mei, Y. Lei and W. Wang, J. Environ. Sci., 2010, 22, 507–511 CrossRef CAS.
- K. Karageorgiou, M. Paschalis and G. N. Anastassakis, J. Hazard. Mater., 2007, 139, 447–452 CrossRef CAS PubMed.
- W. Yao and F. J. Millero, Environ. Sci. Technol., 1996, 30, 536–541 CrossRef CAS.
- J. Ye, X. Cong, P. Zhang, E. Hoffmann, G. Zeng, Y. Liu, W. Fang, Y. Wu and H. Zhang, Appl. Surf. Sci., 2015, 356, 124–128 CrossRef.
- K. C. Cheung and T. H. Venkitachalam, Chemosphere, 2000, 41, 243–249 CrossRef CAS PubMed.
- D. Y. Wu, B. H. Zhang, C. J. Li, Z. J. Zhang and H. N. Kong, J. Colloid Interface Sci., 2006, 304, 300–306 CrossRef CAS PubMed.
- L. Zeng, X. M. Li and J. D. Liu, Water Res., 2004, 38, 1318–1326 CrossRef CAS PubMed.
- S. Mustafa, M. I. Zaman, R. Gul and S. Khan, Sep. Purif. Technol., 2008, 59, 108–114 CrossRef CAS.
- L. G. Yan, Y. Y. Xu, H. Q. Yu, X. D. Xin, Q. Wei and B. Du, J. Hazard. Mater., 2010, 179, 244–250 CrossRef CAS PubMed.
- S. L. Tian, P. X. Jiang, P. Ning and Y. H. Su, Chem. Eng. J., 2009, 151, 141–148 CrossRef CAS.
- N. Hamdi and E. Srasra, J. Environ. Sci., 2012, 24, 617–623 CrossRef CAS.
- H. S. Zhao and R. Stanforth, Environ. Sci. Technol., 2001, 35, 4753–4757 CrossRef CAS.
- R. Chitrakar, S. Tezuka, A. Sakane, K. Ooi and T. Hirotsu, J. Colloid Interface Sci., 2006, 298, 602–608 CrossRef CAS PubMed.
- C. Mangwandi, A. B. Albadarin, Y. Glocheux and G. M. Walker, J. Environ. Chem. Eng., 2014, 2, 1123–1130 CrossRef CAS.
- F. Zha, W. Huang, J. Wang, Y. Chang, J. Ding and J. Ma, Chem. Eng. J., 2013, 215–216, 579–585 CrossRef CAS.
- X. Yang, D. Wang, Z. Sun and H. Tang, Colloids Surf., A, 2007, 297, 84–90 CrossRef CAS.
- S. Gao, C. Wang and Y. Pei, J. Environ. Sci., 2013, 25, 986–992 CrossRef CAS.
- M. H. Ma, H. Y. Gao, Y. B. Sun and M. S. Huang, J. Mol. Liq., 2015, 201, 30–35 CrossRef CAS.
- N. Y. Mezenner and A. Bensmaili, Chem. Eng. J., 2009, 147, 87–96 CrossRef CAS.
- R. Donat, A. Akdogan, E. Erdem and H. Cetisli, J. Colloid Interface Sci., 2005, 286, 43–52 CrossRef CAS PubMed.
- Y. H. Li, Z. C. Di, J. Ding, D. H. Wu, Z. K. Luan and Y. Q. Zhu, Water Res., 2005, 39, 605–609 CrossRef CAS PubMed.
- W. Y. Huang, R. H. Zhu, F. He, D. Li, Y. Zhu and Y. M. Zhang, Chem. Eng. J., 2013, 228, 679–687 CrossRef CAS.
- W. Huang, J. Chen, F. He, J. Tang, D. Li, Y. Zhu and Y. Zhang, Appl. Clay Sci., 2015, 104, 252–260 CrossRef CAS.
- K. Jung, T. Jeong, M. Hwang, K. Kim and K. Ahn, Bioresour. Technol., 2015, 198, 603–610 CrossRef CAS PubMed.
- N. Widiastui, H. Wu, H. M. Ang and D. Zhang, Desalination, 2011, 277, 15–23 CrossRef.
|
| This journal is © The Royal Society of Chemistry 2017 |
Click here to see how this site uses Cookies. View our privacy policy here.  Open Access Article
 *a,
Xumeng Lina,
Jingjing Xieb and
Xiaoming Huang*ab


![[thin space (1/6-em)]](https://www.rsc.org/images/entities/char_2009.gif) qe = ln
qe = ln![[thin space (1/6-em)]](https://www.rsc.org/images/entities/char_2009.gif) qm − βε2
qm − βε2


![[thin space (1/6-em)]](https://www.rsc.org/images/entities/char_2009.gif) ln
ln![[thin space (1/6-em)]](https://www.rsc.org/images/entities/char_2009.gif) Kd
Kd

![[thin space (1/6-em)]](https://www.rsc.org/images/entities/char_2009.gif) Kd versus 1/T (Fig. 9). The negative values of ΔG0 and positive values of ΔH0 revealed that the processes of phosphate adsorption on Al–PG and PG were endothermic, feasible and spontaneous. The values of ΔG0 for phosphate adsorption decreased from −7.834 kJ mol−1 to −8.556 on Al–PG and from −2.749 to −3.320 kJ mol−1 on PG coupled with a rise temperature from 298 to 318 K (Table 3). The endothermic process of phosphate adsorption was enhanced by an increase in temperature for both Al–PG and PG, and there was a greater impact on Al–PG. The change of entropy (ΔS0) was 0.036 and 0.029 kJ mol−1 K−1 for phosphate adsorption on Al–PG and PG, respectively. The positive values of ΔS0 suggested that the randomness increased at the solid–liquid interface during the adsorption of phosphate on Al–PG and PG.
Kd versus 1/T (Fig. 9). The negative values of ΔG0 and positive values of ΔH0 revealed that the processes of phosphate adsorption on Al–PG and PG were endothermic, feasible and spontaneous. The values of ΔG0 for phosphate adsorption decreased from −7.834 kJ mol−1 to −8.556 on Al–PG and from −2.749 to −3.320 kJ mol−1 on PG coupled with a rise temperature from 298 to 318 K (Table 3). The endothermic process of phosphate adsorption was enhanced by an increase in temperature for both Al–PG and PG, and there was a greater impact on Al–PG. The change of entropy (ΔS0) was 0.036 and 0.029 kJ mol−1 K−1 for phosphate adsorption on Al–PG and PG, respectively. The positive values of ΔS0 suggested that the randomness increased at the solid–liquid interface during the adsorption of phosphate on Al–PG and PG.![[thin space (1/6-em)]](https://www.rsc.org/images/entities/char_2009.gif) ln(qe − qt) = ln
ln(qe − qt) = ln![[thin space (1/6-em)]](https://www.rsc.org/images/entities/char_2009.gif) qe − k1t
qe − k1t


![[thin space (1/6-em)]](https://www.rsc.org/images/entities/char_2009.gif) t in the Elovich equation, and the intraparticle diffusion rate constant k3 was calculated from the slop of the line obtained by plotting qt and t0.5. Comparing the correlation coefficients of four kinetic models, it clearly revealed that the pseudo-second-order model best fit the adsorption kinetic of phosphate onto Al–PG and PG and the adsorption processes were chemisorptions.31 This conclusion was consistent with the fitting results from the D–R isotherm. This high applicability of the pseudo-second-order model for present kinetic data is also in agreement with other studies that the pseudo-second-order model can be satisfactorily described the kinetics of phosphate adsorption on natural minerals, modified minerals, hyroxy-aluminum, and hydroxyl-iron.10,14,19,21,24,32,33 Moreover, the theoretically adsorbed amount at equilibrium (11.12 mg g−1) calculated from pseudo-second-order model was close to the adsorbed amount at equilibrium obtained from experiment (11.90 mg g−1). The Elovich equation was successfully used to describe the second-order kinetic assuming that the actual solid surfaces are energetically heterogeneous.29 The initial adsorption rate ae was 111.23 mg (g−1 h−1) for phosphate adsorption onto Al–PG, which was much higher than 5.59 mg (g−1 h−1) for phosphate adsorption onto PG. According to the intra-particle diffusion model, (i) the plot of qt versus the square root of time (t0.5) should be linear if the intra-particle diffusion is involved in the adsorption process, (ii) if these lines pass through the origin when the intra-particle diffusion is the race-controlling step, and (iii) two or more slopes could occur in a multi-step adsorption process.29,34 As seen in Fig. 10d, the phosphate adsorption onto Al–PG and PG involve two steps presented a multilinearity. A rapid phosphate adsorption onto Al–PG occurred in the first 30 min, and then it slowed down in the following 23 hours. The fast adsorption was mainly attributed to the boundary layer diffusion or macro-pore diffusion, and the slow adsorption was due to the intraparticle diffusion or micro-sore diffusion.29,35
t in the Elovich equation, and the intraparticle diffusion rate constant k3 was calculated from the slop of the line obtained by plotting qt and t0.5. Comparing the correlation coefficients of four kinetic models, it clearly revealed that the pseudo-second-order model best fit the adsorption kinetic of phosphate onto Al–PG and PG and the adsorption processes were chemisorptions.31 This conclusion was consistent with the fitting results from the D–R isotherm. This high applicability of the pseudo-second-order model for present kinetic data is also in agreement with other studies that the pseudo-second-order model can be satisfactorily described the kinetics of phosphate adsorption on natural minerals, modified minerals, hyroxy-aluminum, and hydroxyl-iron.10,14,19,21,24,32,33 Moreover, the theoretically adsorbed amount at equilibrium (11.12 mg g−1) calculated from pseudo-second-order model was close to the adsorbed amount at equilibrium obtained from experiment (11.90 mg g−1). The Elovich equation was successfully used to describe the second-order kinetic assuming that the actual solid surfaces are energetically heterogeneous.29 The initial adsorption rate ae was 111.23 mg (g−1 h−1) for phosphate adsorption onto Al–PG, which was much higher than 5.59 mg (g−1 h−1) for phosphate adsorption onto PG. According to the intra-particle diffusion model, (i) the plot of qt versus the square root of time (t0.5) should be linear if the intra-particle diffusion is involved in the adsorption process, (ii) if these lines pass through the origin when the intra-particle diffusion is the race-controlling step, and (iii) two or more slopes could occur in a multi-step adsorption process.29,34 As seen in Fig. 10d, the phosphate adsorption onto Al–PG and PG involve two steps presented a multilinearity. A rapid phosphate adsorption onto Al–PG occurred in the first 30 min, and then it slowed down in the following 23 hours. The fast adsorption was mainly attributed to the boundary layer diffusion or macro-pore diffusion, and the slow adsorption was due to the intraparticle diffusion or micro-sore diffusion.29,35


