 Open Access Article
Preparation and characterization of electrospun graphene/silk fibroin conductive fibrous scaffolds
Yi Yang†
a,
Xili Ding†a,
Tongqiang Zoua,
Ge Penga,
Haifeng Liu *a and
Yubo Fan*ab
aKey Laboratory for Biomechanics and Mechanobiology of Ministry of Education, International Research Center for Implantable and Interventional Medical Devices, School of Biological Science and Medical Engineering, Beihang University, Xue Yuan Road No. 37, Haidian District, Beijing 100191, People's Republic of China. E-mail: haifengliu@buaa.edu.cn; yubofan@buaa.edu.cn; Fax: +86-10-82338456; Fax: +86-10-82339428; Tel: +86-10-82338456 Tel: +86-10-82339428
bNational Research Center for Rehabilitation Technical Aids, Beijing 100176, People's Republic of China
First published on 23rd January 2017
Abstract
Electroactive scaffolds which can carry electrical stimulation to the cells growing on them have attracted more and more attention in recent years. In this study, a conductive fibrous scaffold made of silk fibroin (SF) and graphene was developed using electrospinning techniques. The chemical structural characterization of the obtained scaffolds confirmed the presence of graphene in the fibrous scaffolds. The surface morphologies, mechanical and electrochemical properties and cytocompatibility of the scaffolds were evaluated. The average diameters of the G/SF fibrous scaffolds increased with the addition of graphene until the content of graphene reached 4%. The G/SF scaffolds exhibited improved thermal stability with the addition of graphene, which confirmed that they were more crystalline than pure SF scaffolds. The 3% G/SF fibrous scaffolds showed improved electroactivity and mechanical properties. In addition, they could support the growth and expansion of rat bone mesenchymal stem cells (rBMSCs) based on cell morphology, viability and proliferation studies in vitro. Thus, all the data in this study suggested that the 3% G/SF scaffolds might represent an adequate substrate to successfully scaffold electroactive tissue during regeneration or engineering.
1. Introduction
Silk fibroin (SF) has been used as an attractive biomaterial for tissue regeneration,1 which features excellent cytocompatibility, adaptable biodegradability, and good oxygen/water vapor permeability.2–4 Additionally, it can be processed easily into various structures, such as meshes, membranes, hydrogels, sponges, and fibers.1,4 SF fibrous scaffolds created by electrospinning techniques have enormous potential for tissue regeneration since they can mimic the structure and function of native extracellular matrix (ECM).5 Moreover, the electrospun fibers have a large surface area to volume ratio, which allows for the direct attachment of ECM ligands, growth factors, and other biomolecules onto the fiber surfaces to locally modulate cell and tissue function and to enhance tissue regeneration.6,7 However, the field of potential applications could be tremendously expanded by developing electrospun scaffolds with conductive properties since life involves chemical reactions and electrical currents.8,9 Electrical stimulation of cells and tissues is widely used to enhance their different biological functions. Some cells, such as cardiomyocytes, neurons, and skeletal muscle cells, are electroactive and respond directly to electrical impulses.8,10 Herein, there is a permanent demand for improved electroactive scaffolds, which can carry electrical stimulation to the cells growing on them.10Graphene, an atomically thick, two dimensional sheet composed of sp2 carbon atoms arranged in a honeycomb crystal lattice,11 has attracted a lot attention in recent years due to its outstanding properties such as excellent thermal and electrical conductivity, high Young's modulus, large specific surface area, and biocompatibility.12,13 Graphene has been developed for numerous potential applications in biomedicine, such as disease diagnostics, antibacterial and antiviral materials, biosensing, cancer targeting and photothermal therapy, electrical stimulation of cells, drug delivery, and tissue regeneration.12–16 As we all know, the high electrical conductivity of graphene is due to its unique structure and strong C![[double bond, length as m-dash]](https://www.rsc.org/images/entities/char_e001.gif) C bonding. Low defect density in the crystal lattice imparts single-layered graphene excellent electrical conductivity.17 Moreover, conductive graphene can significantly improve the electrical conductivity of the composites when being used as fillers with insulating polymer matrix. For example, graphene/polyvinylpyrrolidone composites were produced by Wajid et al. using bulk polymerization of N-vinylpyrrolidone loaded with dispersed graphene, which resulted in improved electrical properties.18 In another study, Khan and colleagues fabricated the electrospun polyacrylonitrile (PAN) and polymethyl methacrylate (PMMA) nanofiber separators embedded with graphene nanoflakes, and the ionic conductivity were increased from 3.31 × 10⁻⁴ to 5.52 × 10⁻⁴ S m−1.19 Thus, it could be relevant to confer SF fibrous scaffolds electroconductive functionalities with graphene, since SF-conducting fibrous scaffolds with excellent cytocompatibility would carry electrical stimulation to the cells.20
C bonding. Low defect density in the crystal lattice imparts single-layered graphene excellent electrical conductivity.17 Moreover, conductive graphene can significantly improve the electrical conductivity of the composites when being used as fillers with insulating polymer matrix. For example, graphene/polyvinylpyrrolidone composites were produced by Wajid et al. using bulk polymerization of N-vinylpyrrolidone loaded with dispersed graphene, which resulted in improved electrical properties.18 In another study, Khan and colleagues fabricated the electrospun polyacrylonitrile (PAN) and polymethyl methacrylate (PMMA) nanofiber separators embedded with graphene nanoflakes, and the ionic conductivity were increased from 3.31 × 10⁻⁴ to 5.52 × 10⁻⁴ S m−1.19 Thus, it could be relevant to confer SF fibrous scaffolds electroconductive functionalities with graphene, since SF-conducting fibrous scaffolds with excellent cytocompatibility would carry electrical stimulation to the cells.20
In this study, we present the fabrication of a conductive composite fibrous scaffold made of SF and graphene using electrospinning technique, detecting its surface morphologies, physicochemical and electrochemical properties. Rat bone mesenchymal stem cells (rBMSCs) are cultured on the scaffolds to evaluate the possibilities for their use as supporting electroactive materials for tissue engineering.
2. Experimental details
2.1 Materials
Raw Bombyx mori silk fibers were supplied from Rugao Chunqiu Textile Co. Ltd (Jiangsu, China). 1,1,1,3,3,3-Hexafluoro-2-propanol (HFIP) was purchased from Aladdin Industrial Co. Ltd (Shanghai, China). Na2CO3, CaCl2·2H2O and CH3CH2OH were obtained from Guangfu Chemical Co. Ltd (Tianjin, China). Graphene was purchased from Xianfeng Tech Co. Ltd. (Nanjing, China).2.2 Preparation of SF
Raw Bombyx mori silk fibers were degummed in a boiling 0.02 M Na2CO3 aqueous solution for 0.5 h and then rinsed thoroughly with ultrapure water to purge the sericin from the fibers. And after being dried, the degummed SF was dissolved in a ternary solvent system of CaCl2·2H2O/H2O/CH3CH2OH solution (1/8/2 in mol ratio) which heated to 78 °C, then constant temperature heating and stirring for 2 h. After that, the resulting solution was dialyzed against ultrapure water using a SnakeSkin Pleated Dialysis Tubing (PIERCE, molecular-weight cut-off (MWCO): 3500) at indoor temperature for 24 h. Finally, the SF solution was freeze-dried in a vacuum ambiance for 48 h so as to form SF sponges and was kept drying for future use.2.3 Electrospun graphene/silk fibroin (G/SF) fibrous scaffolds
A battery of G/SF electrospinning solutions with different mixing volume of graphene were prepared by dispersing them in HFIP at a SF concentration of 10% (w/v). Graphene was added into the prepared SF solution according to a certain proportion after being exposed to ultrasound for 3 h. And then, the mixed solution was subjected to 24 h continuous stirring for intensive mixing and preventing graphene aggregation. Detailed components of graphene in electrospinning solutions for each group were listed in Table 1. Electrospinning was performed with a glass syringe that has 20 mm inside diameter capped with a 0.9 mm inside diameter blunt needle. And the glass syringe was loaded with varying contents of graphene in the electrospinning solutions and was fitted up in a syringe pump with a rate of 1.0 mL h−1. A voltage of 15 kV generated by a high voltage DC power supply was applied to the blunt needle. While electrospinning, the graphene suspensions dispersed in SF solutions were drawn into fibers and were collected on a grounded aluminum foil-covered collection plate kept at a distance of 15 cm from the needle tip. And then, the electrospun fibrous scaffolds were treated with 100% ethanol for 30 min to induce a β-sheet conformational transition, which resulted in insolubility in water.1 All the experiments process were performed at room temperature. And then, the electrospun fibrous scaffolds were vacuum-dried at room temperature for 24 h and then stored in desiccators.| Group | Mass in 10 mL HFIP | Solute concentration of SF (w/v) | |
|---|---|---|---|
| SF (g) | G (mg) | ||
| 0% G/SF | 1 | 0 | 10% |
| 1% G/SF | 1 | 10 | 10% |
| 2% G/SF | 1 | 20 | 10% |
| 3% G/SF | 1 | 30 | 10% |
| 4% G/SF | 1 | 40 | 10% |
2.4 Characterization
Morphological observation. A transmission electron microscope (TEM, HT7700, Japan) was used to determine the locations of graphene particles within the nanofibers. The surface morphology of G/SF fibrous scaffolds were observed under a scanning electron microscope (SEM) (JEOL JSM-5600LV, Japan) with an accelerated voltage of 15 kV. Before the observation, the surface of the samples were coated with a sputter coater (BAL-TEC Inc., USA) equipped with a gold target to increase electrical conductivity of the samples. The average diameters of the fibers were gained by measuring 100 randomly selected fibers on the electron micrographs using Image J (National Institutes of Health, USA).
Hydrophilicity test. The static water surface contact angles were measured using a VCA optima surface analysis system (AST Products, Inc., USA) to determine the hydrophilicity of the G/SF electrospun scaffolds. The droplet of 5 μL deionized water was deposited on the surface of the scaffolds. Five samples for each group were measured.
ATR-FTIR analysis. The variation in the structure of the G/SF scaffolds were investigated by attenuated total reflectance Fourier transform infrared spectrometry (ATR-FTIR, Nicolet 560, USA). Every spectrum was acquired in transmission mode with a resolution of 4 cm−1 and a spectral range of 500–4000 cm−1. Three samples for each group were measured.
Raman spectroscopy. Raman spectral analysis is mainly used to identify the molecules symmetry vibration of a material that under test. It is an effective method that could discern the structure and properties of graphene according to the molecular structure of the graphene model. Raman (HORIBA, France) test was implemented using a laser wavelength of 532 nm, and a spectral range of 800–3200 cm−1. Three samples for each group were measured.
![[thin space (1/6-em)]](https://www.rsc.org/images/entities/char_2009.gif) :
:![[thin space (1/6-em)]](https://www.rsc.org/images/entities/char_2009.gif) 3. The rBMSCs at passages 3–4 were used in the following experiments.
3. The rBMSCs at passages 3–4 were used in the following experiments.All electrospun fibrous scaffolds were sterilized by immersing in 75% ethanol for 2 h, being exposed to the UV radiation. Then they were rinsed three times with phosphate buffered saline (PBS) to remove ethanol. rBMSCs were seeded at a density of 1.0 × 10⁵ cells per scaffolds onto 0% G/SF to 4% G/SF scaffolds placing in the wells of a non-treated 6-well culture plate. After pipetting 150 μL of cell medium suspension onto the scaffolds, the plates were incubated for 2 h to allow cell attachment. And then, cell-free medium was added to bring the total well volume to 2 mL. The cell-seeded scaffolds were grown in vitro in a 5% CO2 incubator at 37 °C with the medium being replaced every 3 days. The viability of the cells growing on the fibrous membranes was checked using CCK-8 test (Cell Counting Kit-8, Beyotime, China). After completion of the incubation period (1, 4, and 7 days), the medium in the 6-well plates was replaced with fresh medium containing 10% CCK-8 solution. These plates were incubated for 2 h, and the absorbances of the reaction medium from each well were measured at 450 nm using a microplate reader (Thermo Scientific, USA). For each experiment, 5 samples were evaluated.
The cell morphology of the rBMSCs on the scaffolds was examined by confocal microscopy on day 7. Cells were fixed in 4% paraformaldehyde, permeabilized with 0.1% Triton X-100 in PBS and then blocked in 1% bovine serum albumin. After washing with PBS, the cells were incubated in phalloidin (Sigma-Aldrich, USA) for 30 min to stain all filamentous actin (F-actin) filaments and with 4,6-diamino-2-phenyl indole (DAPI) (Sigma-Aldrich, USA) for 5 min to label the nuclei at room temperature. Subsequently, cells were observed using an inverted fluorescence microscope (Olympus Inc., Japan).
2.5 Statistical analysis
All data were expressed as means ± standard deviation (SD) for repetitive tests. One-way analysis of variance (ANOVA) statistical analysis was carried out to assess the statistical significance of results between groups. The statistical analysis was performed with the software SPSS (version 19.0) at a confidence level of 95%. Differences were considered to be statistically significant for values of p < 0.05.3. Results and discussion
3.1 Surface properties
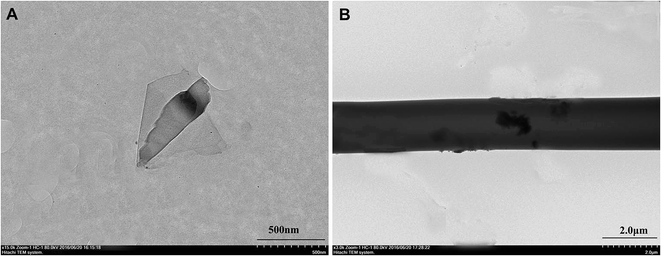
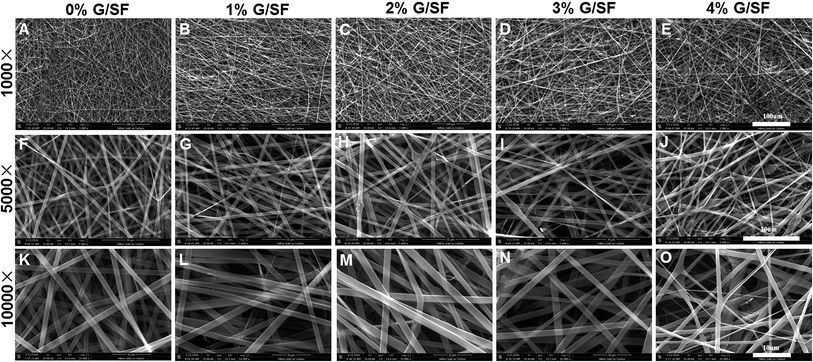
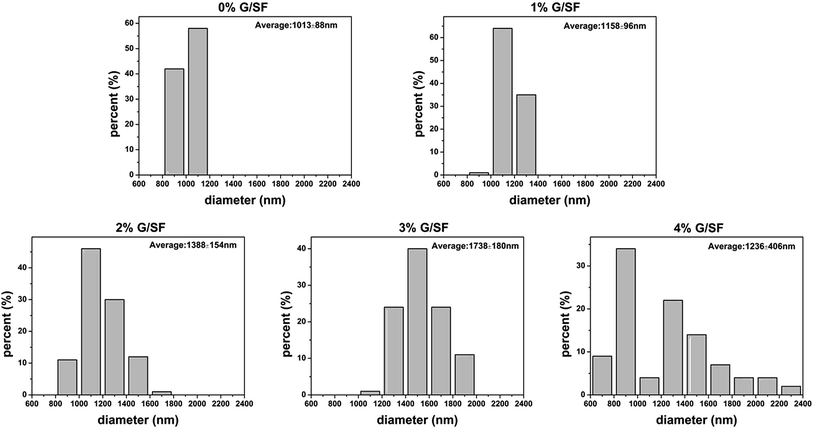
The morphology of graphene was characterized by TEM. Fig. 1A showed the deposited graphene structure on the TEM grid. Some areas appeared darker, which indicated that several small fragments of graphene were stacked together. Dispersion of graphene in the SF matrix without re-stacking together is the key to determine the composite performance. Therefore, the graphene powders were dispersed in HFIP via sonication, and the electrospinning solution was prepared by adding SF solution. As shown in Fig. 1B, graphene was identifiable in the TEM images of electrospun fibers.The surface morphologies of G/SF fibrous scaffolds were examined by SEM. As shown in Fig. 2, all of the G/SF fibrous scaffolds exhibited similar surface morphologies. The diameter distributions of the electrospun fibers were shown in Fig. 3. The average fiber diameter of the pure SF (0% G/SF) scaffolds was smaller than that of all the other groups. Compared with pure SF fibers, the diameter of the fibers showed an increasing trend after adding graphene. The reason could be that the addition of graphene improved the conductivity and the viscosity of the spinning solution, which affected the fiber diameter. In the beginning, the viscosity was considered as the dominant factor of diameter variation. Graphene was easily gathered into flake or graininess in the spinning solution, which led to the enhancement of the viscosity of the spinning system, resulting in the increase of the fiber diameter. However, when the content of graphene reached to 4 mg mL−1, the average diameter of the fibers suddenly decreased. The stretching of the solution mainly owed to the repulsive forces between the charges on the electrospinning jet in the process of electrospinning.24 With the increase of the graphene contents, the conductivity became the dominant factor on the variety of fiber diameters. The increased charge density would enhance the elongational forces that exerted on the fiber jet to yield a smaller fiber.25 While the graphene contents were too high, graphene flakes could not be fully dispersed in the solution. Moreover, the spinning solution would jam the syringe needle and hinder the jet flow in motion during the electrospinning process, which made the fiber diameter nonuniform (Fig. 2E, J and O).
As shown in Table 2, the contact angles for each group were measured. Besides, while the contact angles were measured, water droplets on the scaffold surfaces were photographed (Fig. 4). The surface of the pure SF scaffolds had a small contact angle of 21.93° ± 2.69°. For those of 1%, 2%, 3%, and 4% G/SF scaffolds, the contact angles increased with the addition of graphene. A smaller contact angle means a more hydrophilic surface of a material. There were a number of hydrophilic groups in SF, such as amine, hydroxyl and carboxyl groups.26 However, the graphene layer is hydrophobic.27,28 With the addition of graphene in SF, the contact angles showed a gradually increasing trend, i.e., the hydrophobicity of blend fibrous scaffolds increased with the addition of graphene. Many previous studies demonstrated that moderately hydrophilic surfaces (20° to 55° water contact angle) benefitted cell attachment and growth on the scaffolds.29–32 In this study, the contact angles of all groups were within the suitable range for cell growth.
| Group | Graphene ratio (mg mL−1) | Static contact angles (°) |
|---|---|---|
| 0% G/SF | 0 | 21.93 ± 2.69 |
| 1% G/SF | 1 | 22.15 ± 1.16 |
| 2% G/SF | 2 | 24.01 ± 2.16 |
| 3% G/SF | 3 | 28.41 ± 4.51 |
| 4% G/SF | 4 | 31.90 ± 3.78 |
3.2 Chemical structural characterization
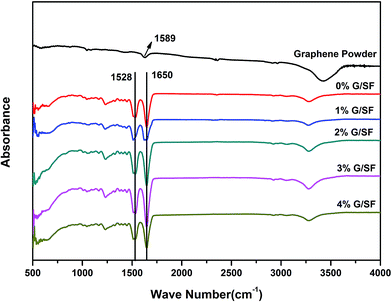
Fig. 5 showed the ATR-FTIR spectra of G/SF scaffolds prepared with different contents of graphene. The peak at 1589 cm−1 was C![[double bond, length as m-dash]](https://www.rsc.org/images/entities/char_e001.gif) C stretching vibration peak for graphene in graphene powder.33 Strong absorption bands at 1528 cm−1 and 1650 cm−1 were observed for all G/SF fibrous scaffolds, which could be attributed to the silk-II structure.5,34 ATR-FTIR spectra of the 1%, 2%, 3%, and 4% G/SF fibrous scaffolds did not revealed the band at 1589 cm−1 possibly because the little amount of graphene in SF. The characteristic spectral lines of the composite fibrous scaffolds in 1%, 2%, 3%, and 4% G/SF had the same absorption peaks as that of pure SF, which showed that the added graphene had no interactions with SF and had no significant effect to the chemical structure of SF. Aznar-Cervantes et al.10 obtained similar results for the infrared analysis of SF and graphene composites.
C stretching vibration peak for graphene in graphene powder.33 Strong absorption bands at 1528 cm−1 and 1650 cm−1 were observed for all G/SF fibrous scaffolds, which could be attributed to the silk-II structure.5,34 ATR-FTIR spectra of the 1%, 2%, 3%, and 4% G/SF fibrous scaffolds did not revealed the band at 1589 cm−1 possibly because the little amount of graphene in SF. The characteristic spectral lines of the composite fibrous scaffolds in 1%, 2%, 3%, and 4% G/SF had the same absorption peaks as that of pure SF, which showed that the added graphene had no interactions with SF and had no significant effect to the chemical structure of SF. Aznar-Cervantes et al.10 obtained similar results for the infrared analysis of SF and graphene composites.
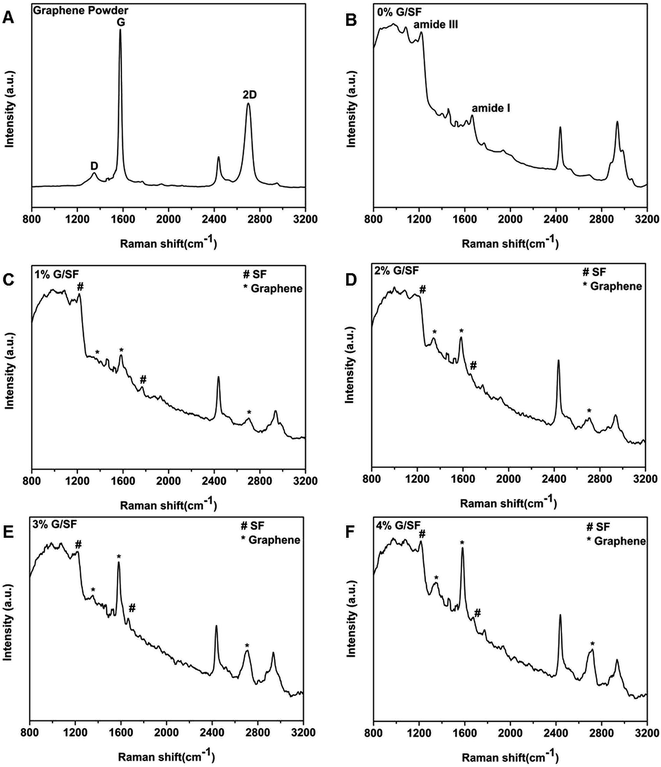
Raman spectroscopy is a powerful nondestructive technique to study carbonaceous materials such as graphene, especially for examining the ordered and disordered crystal structures and also distinguishing the single-, bi-, and multilayer characteristics of graphene and/or graphene oxide layers.35 The typical features of carbon materials in Raman spectra are the G line (∼1580 cm−1) and the D line (∼1350 cm−1). In addition, it has been reported that the shape and position of the overtone of D line (2D band at ∼2700 cm−1) were a notable fingerprint that could be related to the formation and the layer numbers of graphene sheets.32 In the current study, the value of 1582 cm−1 for the G band and the peak position of 2D band located at 2682 cm−1, confirmed the substantial formation of single-layer graphene sheets36–38 (Fig. 6A). As shown in Fig. 6B, the strongest bands of 0% G/SF fibrous scaffolds were due to the peptide bonds, including the amide I vibration at 1668 cm−1 (mainly C![[double bond, length as m-dash]](https://www.rsc.org/images/entities/char_e001.gif) O stretching vibration),the amide III vibration at 1230 cm−1 (mainly N–H in-plane bending and C–N stretching vibrations),39 which suggested that the SF scaffolds were predominantly in β-turn and unordered conformation.40 Both the characteristic peaks of graphene and SF were visible from the characteristic spectral line of the fibrous scaffolds (Fig. 6C–F), which demonstrated that graphene was successfully incorporated in the G/SF fibrous scaffolds.
O stretching vibration),the amide III vibration at 1230 cm−1 (mainly N–H in-plane bending and C–N stretching vibrations),39 which suggested that the SF scaffolds were predominantly in β-turn and unordered conformation.40 Both the characteristic peaks of graphene and SF were visible from the characteristic spectral line of the fibrous scaffolds (Fig. 6C–F), which demonstrated that graphene was successfully incorporated in the G/SF fibrous scaffolds.
3.3 Thermodynamic properties
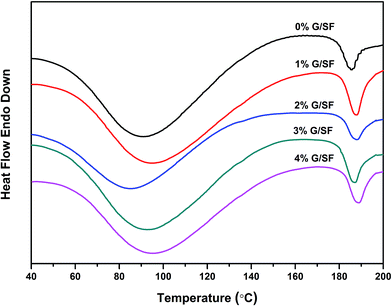
Thermal behaviors of the G/SF fibrous scaffolds were investigated using DSC in order to understand the influence of graphene on the crystallization of the G/SF fibrous scaffolds. As shown in Fig. 7, the glass transition temperature of the pure SF scaffold was 90 °C. With the addition of graphene, the glass transition temperature of the fibrous scaffolds showed an increasing tendency. Graphene in blended scaffolds might increase the stable reticulation flat structure in the fiber, which made the glass transition temperature of the fibrous scaffolds increased. In addition, the melting temperature of the fibrous scaffolds improved gradually with the addition of graphene. There was an endothermic peak at 183 °C with the enthalpy of 11.18 J g−1 for 0% G/SF. For 4% G/SF, there was an endothermic peak at 191 °C with the enthalpy of 59.87 J g−1. Larger enthalpy reflected higher degree of crystallization, in other words, G/SF scaffolds were more crystalline than pure SF scaffolds. The polymer molecular chain of the composite fibrous scaffolds was fixed by the hydrogen bond between graphene and SF, which was helpful for crystallizing SF molecules and increasing their melting temperatures.3.4 Mechanical properties
The addition of graphene has been demonstrated to be able to improve the mechanical properties of the composite materials.41,42 Thus, we integrated graphene into the SF fibers in the current study to fabricate a G/SF fibrous scaffold with better mechanical properties. The stress–strain curves showed that the mechanical properties of the G/SF electrospun fibrous scaffolds were affected by the contents of graphene (Fig. 8A). The Young's modulus increased from 43.44 ± 6.81 MPa for 0% G/SF scaffolds to 56.05 ± 3.42 MPa for 3% G/SF scaffolds (Fig. 8C). Moreover, it was shown in Fig. 8B that the tensile strength gradually improved from 2.01 ± 0.67 MPa for 0% G/SF scaffolds to 4.28 ± 1.36 MPa for 3% G/SF scaffolds; i.e., the tensile strength increased by 113%. This might be attributed to the intermolecular forces formed between the SF and graphene, which restricted the movement of the polymer chains.38 In addition, as demonstrated by the DSC results, the crystallinity of G/SF scaffolds increased with the increase of graphene contents. The crystalline regions might be regarded as crosslinking points of amorphous molecules. The increase of the crystallinity densified the crosslinking points, which could restrain the amorphous molecules from slipping off during the mechanical test.19 However, when the graphene content reached 4%, the tensile strength and Young's modulus of the G/SF scaffolds were lower than those of the pure SF scaffolds (Fig. 8B and C). The reason might be that when further adding graphene to SF solution, graphene would restack together due to van der Waals force of the nanosheets. As mentioned by Zhao et al., there exists a critical point of the mechanical properties upon the graphene nanosheet contents.42 Lower than this content, the exfoliated graphene nanosheets can be well-dispersed in the SF, and the increase of graphene content can improve the mechanical properties. However, further increasing of graphene content, higher than this content, may cause the nanosheets stacking together, weakening the mechanical properties of G/SF scaffolds. | ||
| Fig. 8 Mechanical properties of G/SF fibrous scaffolds: (A) stress–strain curves, (B) tensile strength, and (C) Young's modulus. *Indicates significant difference of p < 0.05. | ||
3.5 Electrochemical properties
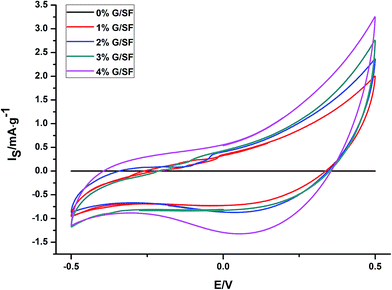
The electroactivity of the electrospun G/SF fibrous scaffolds were studied by submitting the scaffolds to voltammetric cycles (50 cycles) in aqueous 0.1 M NaCl. After several consecutive potential cycles (voltammograms between −0.5 V and 0.5 V), stationary voltammetric responses from the scaffolds with different contents of graphene were shown in Fig. 9. The results showed that the G/SF scaffolds with higher graphene contents exhibited higher currents and thus higher conductivity, which indicated that the G/SF scaffolds could support the flow of a range of anodic and cathodic currents (<±1.5 mA) in the culture medium and carry electrical stimulation to the cells.3.6 Cytocompatibility
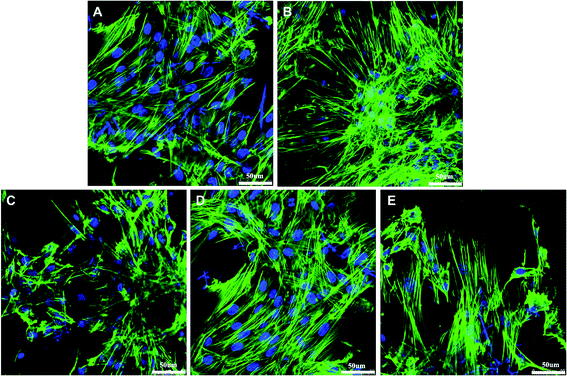
Confocal microscopy analysis of rBMSCs cultured on the G/SF scaffolds revealed their morphological features after culturing for 7 days (Fig. 10). The cells were stained with phalloidin specific for F-actin filaments, and DAPI to visualize the nuclei. The confocal micrographs showed that rBMSCs exhibited spindle shape on all the scaffolds, which meant that the cells spreaded widely on the scaffolds with distinct spread actin filaments. In addition, the viability and proliferation of rBMSCs cultured on the scaffolds were determined by CCK-8 assay. In CCK-8 tests, metabolically active cells react with a tetrazolium salt in the reagent to produce a soluble formazan dye that gives an absorbance at a wavelength of 450 nm. A higher optical density (OD) value signifies better cell viabilities and more live cells. As shown in Fig. 11, an obvious increase of cell proliferation was observed during the 7 day culture in standard conditions, which demonstrated that all samples were nontoxic and rBMSCs were able to adhere and proliferate normally. However, the cell proliferation trend was distinct for different culture times and different scaffolds. The cell viabilities on all the scaffolds increased relatively slowly on day 1 and day 4, while by day 7 the cell numbers increased sharply. Moreover, there were no significant differences between the viabilities of cells cultured on all the scaffolds on day 1 and day 4 (p > 0.05). However, after 7 days of culturing, the cells on 4% G/SF scaffolds showed a significant lower proliferation rate than those on the other scaffolds (p < 0.05), while no significant differences were detected between 1%, 2%, 3% G/SF scaffolds and the pure SF scaffolds (p > 0.05). The results indicated that the viabilities and proliferation of rBMSCs on G/SF scaffolds were affected by the contents of graphene.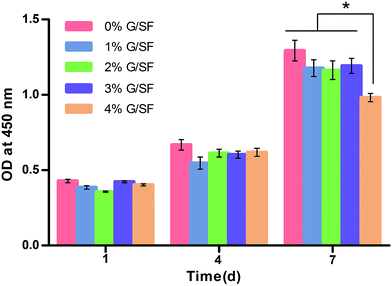 | ||
| Fig. 11 CCK-8 assays of rBMSCs cultured on G/SF fibrous scaffolds. “*” Indicates significant difference of p < 0.05. | ||
The results of the in vitro cytocompatibility evaluation demonstrated that the incorporation of graphene did not affect the excellent cytocompatibility of the SF background, but made SF scaffolds become electronic conductors and active. Previous study by Wang et al. indicated that fluorinated graphene (FG) sheets could enhance the neural differentiation of human bone marrow derived mesenchymal stem cell (hBMSC) and the effect could be further enhanced with neuron inducer.43 Thus, such properties make the fibrous scaffolds developed in this study (especially the 3% G/SF scaffolds) useful for the application of local electric fields and/or ionic currents to cell culture and differentiation in our future work.
4. Conclusions
In this study, a conductive fibrous scaffold made of SF and graphene was developed using electrospinning technique. An increase in the average diameter of the G/SF fibrous scaffolds was observed as the graphene contents in the composite rose till 4%. The 3% G/SF fibrous scaffolds with improved electroactivity and mechanical properties supported the growth and expansion of rBMSCs based on cell morphology, viability and proliferation studies in vitro. Therefore, this could be promising and the 3% G/SF scaffold may allow the potential application of local electric fields or local ionic currents to cell cultures, biological interfaces or animal studies.Acknowledgements
This work was supported by the National Natural Science Foundation of China (31470938, 11421202, 61227902, and 11120101001), National Key Technology R&D Program (2014BAI11B02, 2014BAI11B03, 2016YFC1100704), International Joint Research Center of Aerospace Biotechnology and Medical Engineering from Ministry of Science and Technology of China, 111 Project (B13003), Research Fund for the Doctoral Program of Higher Education of China (20131102130004), The transformation project for major achievements of Central Universities in Beijing (ZDZH20141000601), Beijing Municipal Science and Technology Project (Z151100003715006), Fundamental Research Funds for the Central Universities.References
- G. H. Altman, F. Diaz, C. Jakuba, T. Calabro, R. L. Horan, J. S. Chen, H. Lu, J. Richmond and D. L. Kaplan, Biomaterials, 2003, 24, 401–416 CrossRef CAS PubMed.
- H. F. Liu, H. B. Fan, Y. Wang, S. L. Toh and J. C. H. Goh, Biomaterials, 2008, 29, 662–674 CrossRef CAS PubMed.
- H. F. Liu, H. B. Fan, S. L. Toh and J. C. H. Goh, Biomaterials, 2008, 29, 1443–1453 CrossRef CAS PubMed.
- H. F. Liu, X. M. Li, X. F. Niu, G. Zhou, P. Li and Y. B. Fan, Biomacromolecules, 2011, 12, 2914–2924 CrossRef CAS PubMed.
- H. F. Liu, X. M. Li, G. Zhou, H. B. Fan and Y. B. Fan, Biomaterials, 2011, 32, 3784–3793 CrossRef CAS PubMed.
- S. Sahoo, L. T. Ang, J. C. H. Goh and S. L. Toh, J. Biomed. Mater. Res., Part A, 2010, 93, 1539–1550 Search PubMed.
- Y. Z. Zhang, J. R. Venugopal, A. El-Turki, S. Ramakrishna, B. Su and C. T. Limet, Biomaterials, 2008, 29, 4314–4322 CrossRef CAS PubMed.
- N. K. Guimard, N. Gomez and C. E. Schmidt, Prog. Polym. Sci., 2007, 32, 876–921 CrossRef CAS.
- R. Ravichandran, S. Sundarrajan, J. R. Venugopal, S. Mukherjee and S. Ramakrishna, J. R. Soc., Interface, 2010, 7, S559–S579 CrossRef CAS PubMed.
- S. Aznar-Cervantes, J. G. Martinez, A. Bernabeu-Esclapez, A. A. Lozano-Pérez, L. Meseguer-Olmo, T. F. Otero and J. L. Cenis, Bioelectrochemistry, 2016, 108, 36–45 CrossRef CAS PubMed.
- D. Li and R. B. Kaner, Science, 2008, 320, 1170–1171 CrossRef CAS PubMed.
- A. K. Geim, Science, 2009, 324, 1530–1534 CrossRef CAS PubMed.
- M. Kakran and L. Li, Key Eng. Mater., 2012, 508, 76–80 CrossRef CAS.
- A. K. Geim and K. S. Novoselov, Nat. Mater., 2007, 6, 183–191 CrossRef CAS PubMed.
- K. S. Novoselov, A. K. Geim, S. V. Morozov, D. Jiang, Y. Zhang, S. V. Dubonos, I. V. Grigorieva and A. A. Firsov, Science, 2004, 306, 666–669 CrossRef CAS PubMed.
- H. Y. Mao, S. Laurent, W. Chen, O. Akhavan, M. Imani, A. A. Ashkarran and M. Mahmoudi, Chem. Rev., 2013, 113, 3407–3424 CrossRef CAS PubMed.
- S. Goenka, V. Sant and S. Sant, J. Controlled Release, 2014, 173, 75–88 CrossRef CAS PubMed.
- A. S. Wajid, S. Das, F. Irin, H. S. T. Ahmed, J. L. Shelburne, D. Parviz, R. J. Fullerton, A. F. Jankowski, R. C. Hedden and M. J. Green, Carbon, 2012, 50, 526–534 CrossRef CAS.
- W. S. Khan, R. Asmatulu, V. Rodriguez and M. Ceylan, Int. J. Energy Res., 2014, 38, 2044–2051 CrossRef CAS.
- S. Aznar-Cervantes, M. I. Roca, J. G. Martinez, L. Meseguer-Olmo, J. L. Cenis, J. M. Moraleda and T. F. Otero, Bioelectrochemistry, 2012, 85, 36–43 CrossRef CAS PubMed.
- X. L. Ding, C. Q. Wu, T. Ha, L. Z. Wang, Y. Huang, H. Y. Kang, Y. Y. Zhang, H. F. Liu and Y. B. Fan, RSC Adv., 2016, 6, 19463–19474 RSC.
- Y. Huang, X. L. Jia, K. Bai, X. H. Gong and Y. B. Fan, Arch. Med. Res., 2010, 41, 497–505 CrossRef PubMed.
- Y. Huang, G. Zhou, L. S. Zheng, H. F. Liu, X. F. Niu and Y. B. Fan, Nanoscale, 2012, 4, 2484–2490 RSC.
- R. Chen, L. J. Qiu, Q. F. Ke, C. L. He and X. M. Mo, J. Biomater. Sci., Polym. Ed., 2009, 20, 1513–1536 CrossRef CAS PubMed.
- X. H. Zong, K. Kim, D. F. Fang, S. F. Ran, B. S. Hsiao and B. Chu, Polymer, 2002, 43, 4403–4412 CrossRef CAS.
- P. Amornsudthiwat, R. Mongkolnavin, S. Kanokpanont, J. Panpranot, C. S. Wong and S. Damrongsakkul, Colloids Surf., B, 2013, 111, 579–586 CrossRef CAS PubMed.
- S. R. Wang, Y. Zhang, N. Abidi and L. Cabrales, Langmuir, 2009, 25, 11078–11081 CrossRef CAS PubMed.
- H. Li and X. C. Zeng, ACS Nano, 2012, 6, 2401–2409 CrossRef CAS PubMed.
- Y. Yao, H. F. Liu, X. L. Ding, X. J. Jing, X. H. Gong, G. Zhou and Y. B. Fan, J. Bioact. Compat. Polym., 2015, 30, 633–648 CrossRef CAS.
- K. Webb, V. Hlady and P. A. Tresco, J. Biomed. Mater. Res., 1998, 41, 422–430 CrossRef CAS PubMed.
- J. H. Lee, S. J. Lee, G. Khang and H. B. Lee, J. Colloid Interface Sci., 2000, 230, 84–90 CrossRef CAS PubMed.
- M. Wang, Y. Wang, Y. Chen and H. C. Gu, Appl. Surf. Sci., 2013, 268, 73–78 CrossRef CAS.
- S. Park, J. An, R. D. Piner, I. Jung, D. X. Yang, A. Velamakanni, S. T. Nguyen and R. S. Ruoff, Chem. Mater., 2008, 20, 6592–6594 CrossRef CAS.
- C. M. Li, C. Vepari, H. J. Jin, H. J. Kim and D. L. Kaplan, Biomaterials, 2006, 27, 3115–3124 CrossRef CAS PubMed.
- O. Akhavan, Carbon, 2010, 48, 509–519 CrossRef CAS.
- D. Graf, F. Molitor, K. Ensslin, C. Stampfer, A. Jungen, C. Hierold and L. Wirtz, Nano Lett., 2007, 7, 238–242 CrossRef CAS PubMed.
- A. Dato, V. Radmilovic, Z. Lee, J. Phillips and M. Frenklach, Nano Lett., 2008, 8, 2012–2016 CrossRef CAS PubMed.
- A. C. Ferrari, J. C. Meyer, V. Scardaci, C. Casiraghi, M. Lazzeri, F. Mauri, S. Piscanec, D. Jiang, K. S. Novoselov, S. Roth and A. K. Geim, Phys. Rev. Lett., 2006, 97, 187401 CrossRef CAS PubMed.
- P. Zhou, X. Xie, D. P. Knight, X. H. Zong, F. Deng and W. H. Yao, Biochemistry, 2004, 43, 11302–11311 CrossRef CAS PubMed.
- S. Fan, Y. P. Zhang, H. L. Shao and X. C. Hu, Int. J. Biol. Macromol., 2013, 56, 83–88 CrossRef CAS PubMed.
- M. A. Rafiee, J. Rafiee, Z. Wang, H. H. Song, Z. Z. Yu and N. Koratkar, ACS Nano, 2009, 3, 3884–3890 CrossRef CAS PubMed.
- X. Zhao, Q. H. Zhang and D. J. Chen, Macromolecules, 2010, 43, 2357–2363 CrossRef CAS.
- Y. Wang, W. C. Lee, K. K. Manga, P. K. Ang, J. Lu, Y. P. Liu, C. T. Lim and K. P. Loh, Adv. Mater., 2012, 24, 4285–4290 CrossRef CAS PubMed.
Footnote |
| † The two authors contributed equally to this work. |
| This journal is © The Royal Society of Chemistry 2017 |

