 Open Access Article
Regulation of centrin self-assembly investigated by fluorescence resonance light scattering†
Yaqin Zhao Xiaojuan Guo and
Binsheng Yang*
Institute of Molecular Science, Key Laboratory of Chemical Biology and Molecular Engineering of Ministry of Education, Key Laboratory of Materials for Energy Conversion and Storage of Shanxi Province, Shanxi University, Taiyuan 030006, China. E-mail: yangbs@sxu.edu.cn; Fax: +86 351 7016358; Tel: +86 351 7016358
First published on 7th February 2017
Abstract
Centrin self-assembly is primarily involved in fiber contraction, which is associated with the cell division cycle and ciliogenesis. During centriole separation, centrin reversible phosphorylation plays a key role. There is a question as to how centrin phosphorylation cooperatively co-exists with self-assembly during cell mitosis. Our results suggested that centrin from Euplotes octocarinatus (EoCen) in the self-assembly state can also be phosphorylated by protein kinase A (PKA). Dimers, trimers or tetramers of EoCen have nearly equal abilities of PKA phosphorylating Ser166. In turn, the phosphorylation reaction can change metal ion-induced self-assembly of EoCen. The self-assembly amount and velocity of phosphorylated EoCen were evidently reduced. The self-assembly mode can be reversed by the regulating factor KCl, but not by NaCl or LiCl. At high concentrations of KCl, the degree of EoCen self-assembly was higher than that of phosphorylated EoCen (EoCenp). There were no differences at low concentrations of KCl. Site III on EoCen may be responsible for controlling the balance between phosphorylation and self-assembly. Such results can provide valuable insights for understanding the molecular basis for centrin functions in resting or active cell mitosis.
1. Introduction
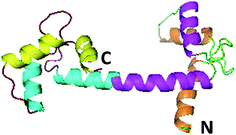
Centrins are calcium-binding proteins consisting of about 170 residues. They were first identified as components of basal body-associated and Ca2+-sensitive contracting fibers in unicellular green algae.1,2 Later, homologous proteins have been successively identified in a variety of species from eukaryotes, including protists, fungi, plants, and animals.3,4 The number of centrin isoforms varies for different organisms. Some eukaryotes, such as green algae and yeast have only one isoform; in contrast, higher eukaryotes have several isoforms. Three centrins exist in humans (human centrin 1, HsCen1, human centrin 2, HsCen2 and human centrin 3, HsCen3),5 and there is a supplementary isoform in mice (MmCen4).6 In cells, centrin is involved in signal transduction via such mechanisms as phosphorylation or dephosphorylation,7,8 in nuclear mRNA export9 and so on. Recently, HsCen1 has been identified as a novel member of a growing family of proteins called Cancer/Testis Antigens (CTAs), which is up-regulated in prostate cancer (PCa) and pancreatic cancer.10 It is highly expressed in cancer, but less so in normal cell lines. In cancer cells, centrins occupy hub positions in key protein interaction networks. HsCen2 plays a regulatory role in DNA damage recognition during the first steps of nucleotide excision repair by binding to the xeroderma pigmentosum group C (XPC) protein.11 HsCen2 may promote the binding of XPC with DNA and increase the specificity of the heterotrimer for damaged DNA.12,13 No detailed functional reports for HsCen3 have been reported so far.Euplotes octocarinatus centrin (EoCen), cloned first by our research groups (GenBank accession number: Y18899), contains 168 residues. It exhibits high sequence identity (above 60%) with centrin from humans. A BLAST search with EoCen and sequence alignment of the results indicate that a large amount of sequence variability among various centrins comes from the first 20-residue fragment and this N-terminal fragment constitutes distinctive features among the members of the large calmodulin (CaM) super-family.14,15 The NMR structure (2joj.pdb) of the N-terminal domain of EoCen has been determined. No data for full-length EoCen or its C-terminal domain are available. EoCen and CaM share approximately 50% of sequence identity. Thus, it can be inferred that EoCen also consists of two structurally independent globular domains tethered by a flexible linker (Fig. 1). Each structural domain contains two helix-loop-helix (known as EF-hand) Ca2+-binding motifs.16,17 Available data indicated that centrin self-assembly is mainly related to the N-terminal domain of the protein.18 The C-terminal also contributes to self-assembly.19 However, protein kinase A (PKA) phosphorylation of centrin occurs at Ser166 on the C-terminal domain.18 It is unknown what will happen during EoCen self-assembly after phosphorylation. Due to similar ion radii and similar coordination numbers, lanthanides have been widely used for studying Ca2+-binding proteins by replacement of the native cofactor.20–22 Lanthanides can enter the cell, accumulate in some cells, substitute for Ca2+ and induce signaling to enhance the orderliness of microtubules or to regulate cell apoptosis.23–26
The objective of this study was to investigate the self-assembly of PKA phosphorylation of EoCen (EoCenp), the phosphorylation of aggregated EoCen, control of the centrin self-assembly level by PKA phosphorylation or by metal ions and the relationship between EoCen phosphorylation and EoCen self-assembly. This research identifies KCl as being important in the regulation of the self-assembly of EoCen and EoCenp. Such knowledge will shed light on the self-assembly of EoCen and EoCenp under physiological conditions that may serve to regulate sub-centriolar duplication in the cell cycle.
2. Experimental
2.1 Reagents
N-2-Hydroxyethylpiperazine-N-2-ethanesulfonic acid (Hepes), PreScission Protease (PPase) and protein kinase A (PKA) were purchased from Sigma. Other chemicals utilized for protein purification were of analytical grade. Tryptone and yeast extract were obtained from OXIDE. Ampicillin (Ampr) and isopropyl-β-D-thiogalactopyranoside (IPTG) were purchased from Amresco Ltd. Other biochemical reagents in construction, expression and purification of proteins were purchased from Trans Gene.2.2 Protein preparation
Three proteins of full length (EoCen, 1–168 aa), isolated C-terminal domain of EoCen (C-EoCen, 90–168 aa) and isolated N-terminal domain of EoCen (N-EoCen, 1–101 aa) were used in the present study. Using EoCen as a PCR template, two truncates of C-EoCen and N-EoCen were obtained and sub-cloned into the expression vector of pGEX-6p-1. The recombinant plasmids of pGEX-6p-EoCen, -C-EoCen and -N-EoCen were obtained. After verification by DNA sequence analysis, the recombinant plasmids were transferred into E. coli (DE3) and incubated at 37 °C. At an optical density of 0.5–0.7 (at 600 nm), protein synthesis was induced using isopropyl-β-D-thiogalactopyranoside (IPTG 0.8 mM) for 3.6 h. Fusion proteins were first purified as a GST fusion protein using glutathione sepharose 4FF in PBS (KH2PO4 1.8, Na2HPO4 10, KCl 2.7 and NaCl 140 mM). Then, GST fusion proteins were cleaved by PPase and subjected to the ÄKTA purifier FPLC system and passed over a HiLoad™ 16/60 Superdex™ 200 gel filtration column. The fractions were analyzed by SDS-PAGE (indicated >95% purity), combined, and concentrated for storage at −80 °C.The proteins of EoCen, C-EoCen and N-EoCen were soluble and their concentrations were measured by absorption at 280 nm with an extinction coefficient of ε280(EoCen) = 5600 M−1 cm−1, ε280(C-EoCen) = 1400 M−1 cm−1 and ε280(N-EoCen) = 4350 M−1 cm−1, respectively.
2.3 Phosphorylation reaction
Proteins including EoCen or N-EoCen or C-EoCen were phosphorylated by PKA at 30 °C in 50 mM Tris–HCl (pH 7.5), 5.0 mM MgCl2, and 1.5 mM ATP in the presence of 2 U μL−1 of purified catalytic subunit of PKA for 10 h. Through addition of kinase, phosphorylation reactions were started and terminated by freezing in liquid N2, followed by lyophilization. For removal of the remaining enzymes or other inorganic salts, samples were passed through a HiLoad™ 16/60 again and were stored at −80 °C.2.4 31P-NMR measurement
With D2O lock, proteins in 5 mm-o.d. sample tubes were measured by 31P-NMR (Bruker DRX 300) spectroscopy. The 3000 transients were accumulated at room temperature applying 90° pulses at 2.0 s repetition time and composite pulse proton decoupling. It took about 10 min to measure one sample. The assignment of inorganic phosphate (Pi) signals was based on their chemical shifts. Pi served as an internal reference for calibrating the chemical shift at 0 ppm. A 1 Hz exponential line broadening was applied before Fourier transformation observation.2.5 Resonance light scattering
Resonance light scattering (RLS) of proteins was monitored using fluorescence technology in 1 cm path quartz cells at 25 °C. The RLS experiment was performed in 100 mM Hepes at pH 7.4 with a fluorescence spectrometer (F-2500, Hitachi, Japan), using the same emission and excitation wavelengths (Δλ = 0 nm). Samples were measured by adding metal ions gradually.An equilibrium time of 10 min was used between each titration.
2.6 Time-resolved fluorescence measurements
The time-resolved fluorescence measurements were performed using an FL920 fluorescence lifetime spectrometer (Edinburgh Instruments, Livingston, UK) operating in the time-correlated single photon counting (TCSPC) mode. The excitation wavelength was 280 nm and the slit width was set at 5 nm. All decay traces were measured using a 4096-channel analyzer. The time resolution per-channel was 24 ps. The number of peak counts was approximately 104. For data analysis, we used commercial software provided by Edinburgh Instruments. The data were fitted using a reconvolution method of the instrument response function (IRF) producing χ2 fitting values of 1–1.3. Errors were given as standard deviations obtained from the fits. All of these measurements were collected three times to check reproducibility and to obtain average values for the lifetimes. Proteins measured in experiments were freshly prepared and the recordings were taken at 25 °C. The fluorescence decay value of proteins was fitted using a sum of exponentials:
I(t) = ∑Bi![[thin space (1/6-em)]](https://www.rsc.org/images/entities/char_2009.gif) exp(−τ/τi) exp(−τ/τi)
| (1) |
2.7 In vitro aggregation experiment
AFM measurement was performed using a Bruker (Multimode 8) atomic force microscope. Samples were prepared by dropping 20 μL of protein EoCenp (80 μM) onto a freshly cleaved mica surface. The protein was allowed to adhere to mica for 15 min, washed with 20 μL of H2O three times and then allowed to dry for 1 h. Commercial tip-less AFM cantilevers were used in this study (k = 40 N m−1). Cantilevers were kept in liquid media for all AFM measurements. The AFM cantilever was positioned over the microstructure using a combination of manual positioning and the automated AFM XY stage while monitoring structures visually using a 30× objective.2.8 Cross-linking analysis
The cross-linking experiment was performed as follows. The protein solutions (4 mg mL−1) in PBS buffer were incubated with glutaraldehyde at 25 °C for 15 min. Reactions were stopped by adding SDS loading buffer in a water bath at 90 °C for 5 min. Cross-linked samples were analyzed on 12% SDS-PAGE and visualized using Coomassie blue R-250 staining.3. Results and discussion
3.1 Phosphorylation behavior of EoCen and aggregated EoCen
EoCen can be readily phosphorylated by PKA in vitro and the percentage of phosphorylated EoCen to total protein may reach to above 95%.18 31P-NMR signals of EoCen appeared at around 1.51 ppm compared to the chemical shift of inorganic phosphate (Pi) at 0.0 ppm, indicating that a phosphate group has been introduced at Ser166. EoCen indeed contains a consensus amino acid motif (KKXS*X) for phosphorylation by PKA. After glutaraldehyde (0.05%) cross-linking, EoCen aggregated from monomers to dimers, trimers, tetramers and polymers (Fig. S1†). Previous data demonstrated that EoCen self-assembly occurred in the mode of C-to-C as well as N-to-N (between C- and C-terminal domains as well as between N- and N-terminal domains).27 When incubating the samples of aggregated EoCen with PKA in the presence of ATP in 50 mM Tris–HCl (pH 7.5) and 5 mM MgCl2 at 30 °C, 31P-NMR signals of samples appeared at 1.49 ppm (Fig. 2A), suggesting that proteins of aggregated EoCen can also be phosphorylated by PKA. The comparison of 31P-NMR signal intensities of EoCen (Fig. 2B) to aggregated EoCen, phosphorylated using PKA, showed no differences. In spite of involvement in aggregation of the C-terminal domain, there were no effects on micro-environments around Ser166 by introduction of a phosphate group. Hence, aggregated EoCen can be phosphorylated by PKA.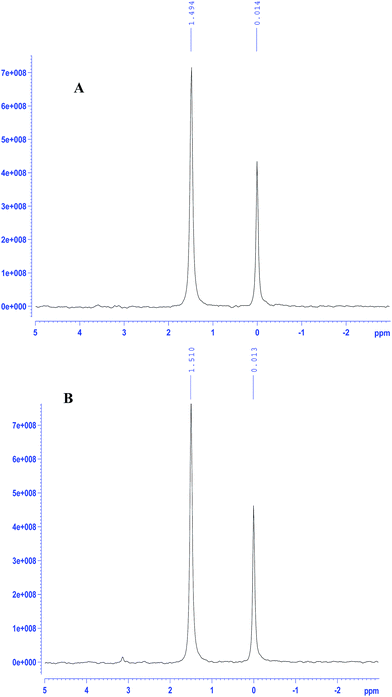 | ||
| Fig. 2 31P-NMR spectra of PKA phosphorylated samples of glutaraldehyde (0.05%) cross-linked EoCen (A) and EoCen (B). Inorganic phosphate was used as a control. | ||
3.2 Self-assembly of EoCen and EoCenp
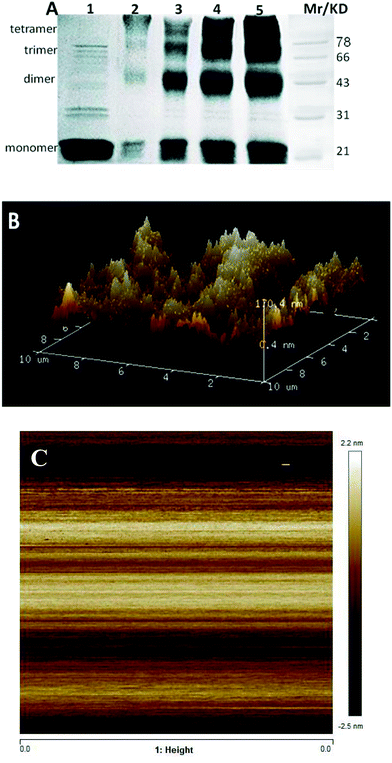
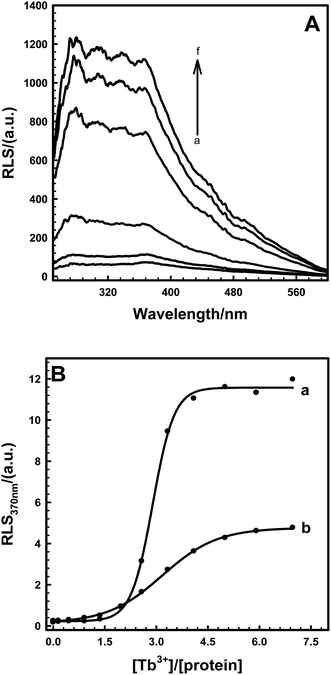
Introducing a phosphate group at Ser166 had no effect on centrin in Euplotes octocarinatus self-assembly. Yet self-assembly of PKA phosphorylated EoCen (EoCenp) occurred. In addition to the monomer, EoCenp also displayed various self-assembly conformations for dimers, trimers and tetramers (Fig. 3A, lane 2). Due to the phosphorylation site of PKA on EoCen being located at the C-terminal domain, aggregation of the N-terminal domain may still occur. With increasing concentration of EoCenp, the percentage of monomer decreased and percentage of multimers increased (Fig. 3A, lane 2–5), indicating that EoCenp may mainly form monomers at low concentrations and multimers at high concentrations. In addition, the aggregation of apoEoCenp can also be confirmed from the heterogeneous roughnesses of the mica plate surface coated with apoEoCenp (Fig. 3B), using the clean mica plate surface as control (Fig. 3C). Metal ion-induced EoCen is aggregated through its C- and C-terminal domains as well as N- and N-terminal domains.27 The distance, based on Fig. 1, from the EoCen N-terminal to its C-terminal was measured to be about 4 nm. EoCenp displayed various thicknesses from 0.4 to 170 nm (Fig. 3B), indicating EoCenp self-assembly with different conformations and forming various multimers.Due to abundant spectral characterization and similar ligation characteristics to Ca2+, Tb3+ has been used widely to study the conformations of Ca2+-binding proteins.28–31 As shown in Fig. 4A, resonance scattering light (RLS) signals of EoCenp at 372 nm increased continuously with the addition of Tb3+ and finally reached a maximum amplitude at 82 μM Tb3+. All of these changes in RLS are consistent with the increase of EoCen upon terbium binding.19,31 Comparing RLS titration curves (Fig. 4B) of Tb3+ binding with proteins of EoCen before being phosphorylated to after being phosphorylated by PKA, suggested that Tb3+ binding with N-terminal domains of the two proteins resulted in a dramatic increase in RLS signals, while binding with C-terminal domains showed a little increase in RLS signals. The N-terminal domain plays major roles in both proteins of EoCen and EoCenp aggregation. This conclusion is consistent with our previous results.19,31 However, the final amplitude of EoCen induced by Tb3+ was relatively higher than that of Tb3+ binding to EoCenp, which may result from static repulsion from the phosphate group at Ser166. In other words, introduction of the phosphate group at Ser166 in EoCen weakened its degree of aggregation.
3.3 KCl regulates self-assembly of EoCen and EoCenp
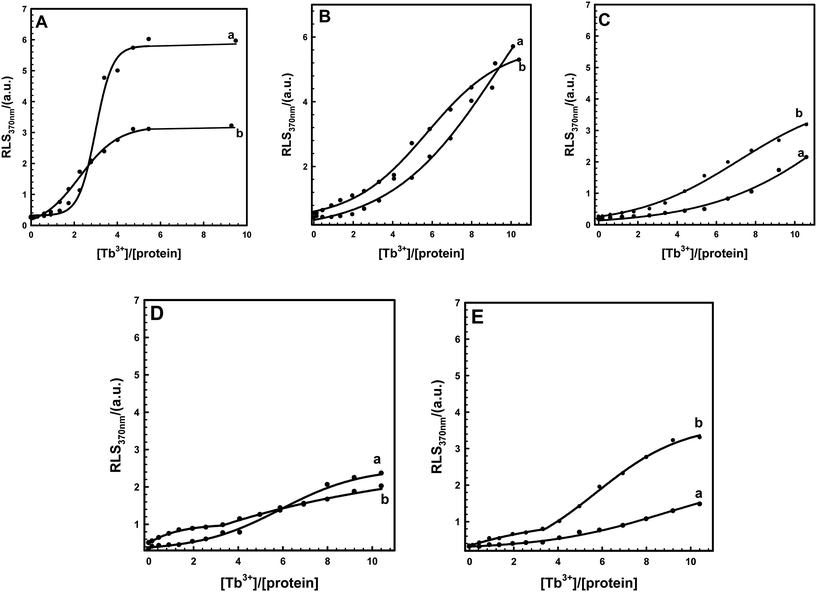
Increasing KCl concentration in the buffer may alter two centrin proteins involved in EoCen and EoCenp self-assembly. It can be seen from Fig. 5 that in a given concentration of KCl in the buffer, RLS signals of two proteins also increased with increasing concentration of Tb3+, similar to the effect in buffer in the absence of KCl. However, in the process of protein self-assembly, contributions from Tb3+ binding with the III site on EoCenp became more evident (Fig. 4B and 5A). EoCen itself contains four metal ion binding sites, among which site IV and site III, located at the C-terminal domain, have high affinity and site I and site II, located at the N-terminal domain, have low affinity.18,19,31 Metal ions bind to EoCen in the order of IV > III > I > II.32 Thus, we can infer that site III on centrin from Euplotes octocarinatus may be responsible for controlling the balance between phosphorylation and self-assembly. The EF-hand motifs in EoCen are in pairs, forming a stable four-helix bundle. Binding of calcium to site III decreased the backbone dynamics and flexibility of the EF-hand loops and stabilized proper conformation for phosphorylation. Metal ions binding to site IV on EoCen with high affinity may change protein conformation for successive functional regulation. With increasing concentration of KCl in buffer, contributions from site III for changing protein self-assembly between EoCen and EoCenp became more prominent (Fig. 5). By virtue of a phosphorylation site located at Ser166, the addition of Tb3+ could only change the aggregation from the C-terminal domain. Thus, after a given Tb3+ bound to a protein, the contribution for Euplotes octocarinatus centrin self-assembly from the N-terminal domain became pivotal. In addition to controlling the balance between phosphorylation and self-assembly, the static interaction of KCl required more Tb3+ for protein aggregation. Moreover, aggregation of both EoCen and EoCenp had positive correlation with protein concentration (Fig. S2†). Increasing EoCen or EoCenp concentration led to larger aggregation of particles and faster aggregation velocity.Due to a similar electrostatic potential to KCl, metal ion-induced EoCen or EoCenp aggregation also showed a significant RLS signal decrease in buffer containing LiCl or NaCl (Fig. S3†). Unlike that of KCl, addition of LiCl or NaCl in buffer did not regulate the self-assembly conversion between EoCen and EoCenp (Fig. S4†). The rigidity and matrix of the metal-binding sites of EoCen may be more suitable for KCl but not for LiCl or NaCl.
3.4 Fluorescence lifetime measurements of EoCen and EoCenp
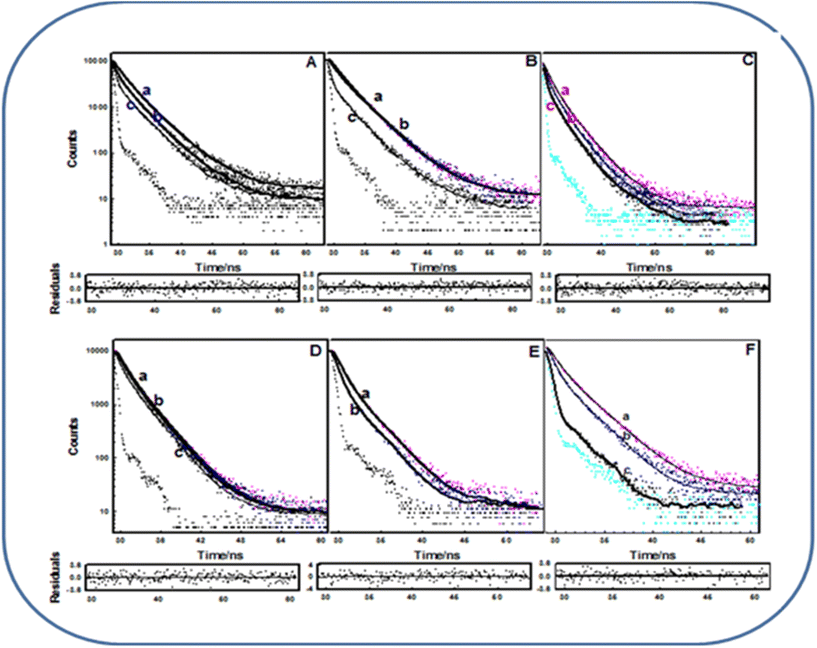
As previously reported,33 the Tyr72 residue is primarily involved in the interaction with metal ions, which has been proven using the methods of non-radiative energy transfer. While studying phosphorylation, we took only Tyr168 into consideration and obtained the C-terminal domain of EoCen (C-EoCen) through a genetic engineering method. As shown in Fig. 6A and B, the fluorescence lifetime of Tyr168 was fitted to be 1.86, 3.52 ns for C-EoCen and 1.74, 3.69 ns for C-EoCenp. Thus, we can infer that introduction of a phosphate group did not change the micro-environments around Tyr168 in the apoprotein (Table S1†). While Tb3+ was bound to EF-hand IV at C-EoCenp, a new fluorescence lifetime value of 0.31 ns for Tyr168 was obtained. No counterpart value was found for Tb3+ bound to C-EoCen. At neutral conditions, a Tyr residue shows two fluorescence lifetime values resulting from protonation and dissociation of the phenolic hydroxyl group. The proton of Tyr in the excited state may be transferred to carboxyl of the Glu residue or Asp residue, if the two residues are located near Tyr.34 At pH 7.4, Ser166 of EoCen can be phosphorylated by PKA. The introduced phosphate group at Ser166 located near Tyr168 becomes negatively charged. The proton from the phenolic hydroxyl group on Tyr may be transferred to the phosphate group, which results in the new fluorescence lifetime value of 0.31 ns. In different polarity solvents, Tyr residues displayed various fluorescence lifetime values (Table S2†). After metal ions binding to EF-hand IV, Tyr168 on C-EoCen showed different conformations with C-EoCenp. Thus far, there is no available NMR or X-ray structure of the C-terminal domain on centrin due to its flexibility, particularly on the protein tail part. We can infer that C-EoCenp bound with Tb3+ at EF-hand IV influenced the energy level transition. In addition, metal ion-induced self-assembly of protein may be another factor contributing to the Tyr168 fluorescence lifetime value decrease. Centrin contains only Tyr and no Trp residue.35 There are four Tyr residues of Tyr46, Tyr72, Tyr79 and Tyr168 on EoCen. Apart from Tyr168, there was another Tyr residue located at the N-terminal domain of the protein. For PKA, only one site on EoCen can be phosphorylated.18 Hence, fluorescence lifetime changes of EoCen and EoCenp mainly resulted from Tyr168 (Fig. 6C and D). As shown in Fig. 6E and F, fluorescence lifetime of C-EoCen or C-EoCenp was clearly shortened after being cross-linked. After aggregation, Tyr168 fluorescence lifetime of C-EoCen was decreased to 0.98 and 2.48 ns, indicating the formation of more nonpolar environments. Similar shortening of fluorescence lifetime has been also measured for aggregated EoCen and EoCenp (Table S1†).3.5 Kinetic measurements of Tb3+-induced EoCenp and EoCen
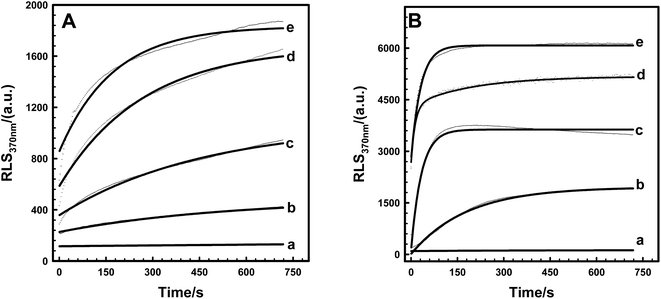
Kinetic behaviors of Tb3+-induced EoCen and EoCenp self-assembly were studied by RLS. Fig. 7A showed that fluorescence RLS signals at 370 nm of EoCenp increased with the addition of Tb3+ within the first few minutes and then gradually reached the maximum value. This polymerization process is similar to that in the reported data on the biomolecules HsCen2, actin and tubulin.17,36–38 Tb3+ binding with the EF-hand on EoCen led to conformational changes of the protein, and then protein in this new state aggregated to form larger molecules. Constantin T. Craescu17 suggested that the slope of RLS titration curves is associated with the rate of self-assembly, and the final plateau is determined by the size of the scattering objects. As described previously,19,31,39 EoCen holds four metal ion binding sites. These four sites hold various affinities with metal ions, which may reflect various biological functions. Hence, kinetic behaviors of EoCenp binding different numbers of Tb3+ were different (Fig. 7A). In addition, the RLS signal, indicating aggregation rate and maximum size, of EoCenp differed when proteins were bound with Tb3+ at the ratios of 1![[thin space (1/6-em)]](https://www.rsc.org/images/entities/char_2009.gif) :
:![[thin space (1/6-em)]](https://www.rsc.org/images/entities/char_2009.gif) 0, 1
0, 1![[thin space (1/6-em)]](https://www.rsc.org/images/entities/char_2009.gif) :
:![[thin space (1/6-em)]](https://www.rsc.org/images/entities/char_2009.gif) 1, 1
1, 1![[thin space (1/6-em)]](https://www.rsc.org/images/entities/char_2009.gif) :
:![[thin space (1/6-em)]](https://www.rsc.org/images/entities/char_2009.gif) 2, 1
2, 1![[thin space (1/6-em)]](https://www.rsc.org/images/entities/char_2009.gif) :
:![[thin space (1/6-em)]](https://www.rsc.org/images/entities/char_2009.gif) 3 and 1
3 and 1![[thin space (1/6-em)]](https://www.rsc.org/images/entities/char_2009.gif) :
:![[thin space (1/6-em)]](https://www.rsc.org/images/entities/char_2009.gif) 4. Compared to EoCenp, aggregation rate and molecular size of EoCen were more evident (Fig. 7B) (Table S3†). Introducing a phosphate group at Ser166 changed not only EoCen self-assembly amount but also self-assembly velocity. In addition, Tb3+ binding at the N-terminal domain of EoCenp resulted in a faster self-assembly than that at the C-terminal domain.
4. Compared to EoCenp, aggregation rate and molecular size of EoCen were more evident (Fig. 7B) (Table S3†). Introducing a phosphate group at Ser166 changed not only EoCen self-assembly amount but also self-assembly velocity. In addition, Tb3+ binding at the N-terminal domain of EoCenp resulted in a faster self-assembly than that at the C-terminal domain.
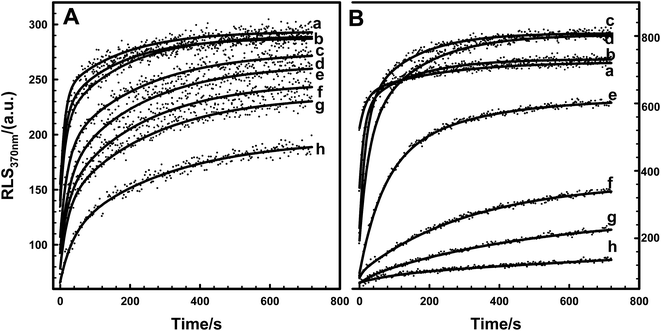
To further probe the kinetic role of KCl in protein aggregation, Tb3+-induced EoCen and EoCenp self-assembly was monitored by fluorescence RLS. As shown in Fig. 8, with increasing KCl concentration in buffer, self-assembly intensity of EoCenp decreased. At the same time, velocity formation of dimers, trimers or tetramers decreased (Table S4†). This phenomenon has also been observed in EoCenp. In agreement with thermodynamic data, due to weakening of the static interaction, KCl decreased the self-assembly velocity of EoCenp and EoCen. Comparison of the velocity of EoCenp with EoCen in the presence of different concentrations of KCl found that the self-assembly velocity of EoCenp at KCl concentrations below 25 mM in buffer was much faster than that of EoCen. Once KCl concentration was above 25 mM, self-assembly velocity of EoCenp increased further.
4. Conclusion
In summary, metal ion-induced self-assembly of EoCen after being phosphorylated by PKA was investigated. Aggregated EoCen can be phosphorylated and phosphorylated EoCen can also be self-assembled. It was demonstrated that the self-assembly amount and velocity of EoCen decreased due to the introduction of a phosphate group at Ser166. The phosphorylation level was not changed by virtue of aggregation. By regulation of the balance between metal ions and KCl concentration, self-assembly and phosphorylation behavior of EoCen was controlled.Acknowledgements
This study was supported by the National Natural Science Foundation of PR China (No. 21571117, No. 20901048 and 21201024) and the Natural Science Foundation of Shanxi Province (No. 2011021006-1).References
- B. Huang, D. M. Watterson, V. D. Lee and M. J. Schibler, J. Cell Biol., 1988, 107, 121 CrossRef CAS PubMed
.
- J. L. Salisbury, A. T. Baron and M. Sanders, J. Cell Biol., 1988, 107, 635 CrossRef CAS PubMed
.
- J. L. Salisbury, Curr. Opin. Cell Biol., 1995, 7, 39 CrossRef CAS PubMed
.
- P. Baum, C. Furlong and B. Byers, Proc. Natl. Acad. Sci. U. S. A., 1986, 83, 5512 CrossRef CAS
.
- F. Friedberg, Mol. Biol. Rep., 2006, 33, 243 CrossRef CAS PubMed
.
- O. Gavet, C. Alvarez, P. Gaspar and M. Bornens, Mol. Biol. Cell, 2003, 14, 1818 CrossRef CAS PubMed
.
- I. Ivanovska and M. D. Rose, Genetics, 2001, 157, 503 CAS
.
- J. L. Salisbury and G. Floyd, Science, 1978, 202, 975 CAS
.
- B. E. Taillon, S. A. Adler, J. P. Suhan and J. W. Jarvik, J. Cell Biol., 1992, 119, 1613 CrossRef CAS PubMed
.
- J. J. Kim, K. Rajagopalan, B. Hussain, B. H. Williams, P. Kulkarni and S. M. Mooney, Biomarker Research, 2013, 1, 1 CrossRef PubMed
.
- J. R. Thompson, Z. C. Ryan, J. L. Salisbury and R. Kumar, J. Biol. Chem., 2006, 281, 18746 CrossRef CAS PubMed
.
- M. Araki, C. Masutani, M. Takemura, A. Uchida, K. Sugasawa, J. Kondoh, Y. Ohkuma and F. Hanaoka, J. Biol. Chem., 2001, 276, 18665 CrossRef CAS PubMed
.
- R. Nishi, Y. Okuada, E. Watanabe, T. Mori, S. Iwai, C. Masutani, K. Sugasawa and F. Hnaoka, Mol. Cell. Biol., 2005, 25, 5664 CrossRef CAS PubMed
.
- A. Yang, S. Miron, P. Duchambon, L. Assairi, Y. Blouquit and C. T. Craescu, Biochemistry, 2006, 45, 880 CrossRef CAS PubMed
.
- C. Weber, V. D. Lee, W. J. Chazin and B. Huang, J. Biol. Chem., 1994, 269, 15795 CAS
.
- E. Schiebel, H. Wiech and B. M. Geier, J. Biol. Chem., 1996, 271, 28366 CrossRef
.
- M. Tourbez, C. Firanescu, A. yang, L. Unipan, P. Duchambon, Y. Blouquit and C. T. Craescu, J. Biol. Chem., 2004, 279, 47672 CrossRef CAS PubMed
.
- Y. Q. Zhao, J. Yan, J. B. Chao, A. H. Liang and B. S. Yang, J. Biol. Inorg Chem., 2013, 18, 123 CrossRef CAS PubMed
.
- Z. J. Wang, Y. Q. Zhao, L. X. Ren, G. T. Li, A. H. Liang and B. S. Yang, J. Photochem. Photobiol., A, 2007, 186, 178 CrossRef CAS
.
- S. Yu, J. Hu, X. Yang, K. Wang and Z. M. Qian, Biochemistry, 2006, 45, 11217 CrossRef CAS PubMed
.
- T. Dudev and C. Lim, Chem. Rev., 2014, 114, 538 CrossRef CAS PubMed
.
- Q. Yang, J. Hu, X. Yang and K. Wang, J. Inorg. Biochem., 2008, 102, 278 CrossRef CAS PubMed
.
- J. J. Chou, S. Li, C. B. Klee and A. Bax, Nat. Struct. Biol., 2001, 8, 990 CrossRef CAS PubMed
.
- L. Mäler, J. Blankenship, M. Rance and W. J. Chazin, Nat. Struct. Biol., 2000, 7, 245 CrossRef PubMed
.
- D. A. Powis, C. L. Clark and K. J. O'Brien, Cell, 1994, 16, 377 CAS
.
- S. Yu, L. Yuan, X. Yang, K. Wang, Y. Ke and Z. M. Qian, J. Cell. Biochem., 2005, 94, 508 CrossRef CAS PubMed
.
- Y. Q. Zhao, L. Song, A. H. Liang and B. S. Yang, J. Photochem. Photobiol., B, 2009, 95, 2628 CrossRef PubMed
.
- Y. Q. Zhao, J. Yan, Y. N. Feng, A. H. Liang and B. S. Yang, J. Fluoresc., 2012, 22, 485 CrossRef CAS PubMed
.
- B. J. Zhou, Z. W. Wang, Y. N. Tian, Z. J. Tian and B. S. Yang, Electrochim. Acta, 2010, 55, 4124 CrossRef CAS
.
- W. R. Harris, B. S. Yang, S. Abdollahi and Y. Hamada, J. Inorg. Biochem., 1999, 76, 231 CrossRef CAS PubMed
.
- T. Dudev, L. Y. Chang and C. Lim, J. Am. Chem. Soc., 2006, 128, 1553 CrossRef CAS PubMed
.
- W. Liu, L. Duan, Y. Q. Zhao, A. H. Liang and B. S. Yang, Chin. Sci. Bull., 2010, 55, 3118 CrossRef CAS
.
- L. Duan, W. Liu, Z. J. Wang, A. H. Liang and B. S. Yang, J. Biol. Inorg Chem., 2010, 15, 995 CrossRef CAS PubMed
.
- M. Noronha, J. C. Lima, M. Bastos, H. Santos and A. L. Maçanita, Biophys. J., 2004, 87, 2609 CrossRef CAS PubMed
.
- J. A. Cox, F. Tirone and I. Durussel, Biochemistry, 2005, 44, 840 CrossRef CAS PubMed
.
- L. D. Belmont, A. Orlova, D. G. Drubin and E. H. Egelman, Proc. Natl. Acad. Sci. U. S. A., 1999, 96, 29 CrossRef CAS
.
- X. Chen and P. A. Rubenstein, J. Biol. Chem., 1995, 270, 11406 CrossRef CAS PubMed
.
- K. Liliom, G. Wagner, J. Kovacs, B. Comin, M. Cascante, F. Orosz and J. Ovadi, Biochem. Biophys. Res. Commun., 1999, 264, 605 CrossRef CAS PubMed
.
- Y. Q. Zhao, X. L. Diao, J. Yan, Y. N. Feng, Z. J. Wang, A. H. Liang and B. S. Yang, J. Lumin., 2012, 132, 924 CrossRef CAS
.
Footnote |
| † Electronic supplementary information (ESI) available. See DOI: 10.1039/c6ra26865j |
| This journal is © The Royal Society of Chemistry 2017 |

