 Open Access Article
Creative Commons Attribution 3.0 Unported Licence
Electronic structure of cyclodextrin–carbon nanotube composite films†
Hae Kyung Jeong *a,
Elena Echeverria
 b,
Priyanka Chakrabortib,
Hien Thi Lea and
P. A. Dowben
 *b
*b
aDepartment of Physics, Institute of Basic Science, Daegu University, Gyeongsan 712-714, Korea. E-mail: outron@gmail.com
bDepartment of Physics and Astronomy, University of Nebraska-Lincoln, 68588-0299, USA. E-mail: pdowben@unl.edu
First published on 10th February 2017
Abstract
The electronic structures of two kinds of cyclodextrin–carbon nanotube (αCD–CNT and γCD–CNT) composite films are investigated by using (angular dependent) photoelectron spectroscopy to gain insight as to why the αCD–CNT and γCD–CNT composite films show different performances in biosensor applications. The γCD–CNT composite film is likely to have the CD localized on the surface rather than in the bulk of the film, while αCD–CNT has CD relatively more concentrated within the bulk of selvedge region of the film, rather than the surface. The results indicate that the CD, of the γCD–CNT composite, may be more bioactive, and possibly a better sensor of biomolecules due to the favorable surface position compared with that of αCD–CNT. The valence band of αCD–CNT and γCD–CNT show little difference from the CNT film except for a density of states, originating from CD, evident at a binding energy near 27 eV below Fermi level, meaning that there are few or no redox interactions between the CD and the CNT. The absence of a redox interaction between the CD and the CNT permits a clear electrochemical response to occur when guest biomolecules are captured on the composites, providing a route to biosensor applications.
1. Introduction
Cyclodextrin (CD), with a toroidal shape, is hydrophobic on the inside radial edge, but hydrophilic on the outside perimeter, consists of six, seven, or eight glucoses named as αCD, βCD, or γCD, respectively. αCD has the smallest inner diameter of 5.7 Å, while γCD has the largest inner diameter of 9.5 Å. In a wider applications context, cyclodextrins and their derivatives are very important in drug delivery systems because they form inclusion complexes easily with guest molecules and improve the solubility, bioavailability, and stability of drugs.1 It is, therefore, very important to investigate fundamental properties for the better design of further applications.Various glucose bio anodes, with incorporation of carbon nanotubes (CNTs), are now being heavily investigated with an eye towards applications, such as enzymatic fuel cells, bio batteries, and biosensors.2–6 The hybrid glucose bio battery and supercapacitor have also been recently reported, where an efficient glucose bio-anode with carbon nanotubes or polymers was highlighted.5 The CNT may well lead to improve electron transfer from the enzymes to the electrodes as well as provide a good substrate for the immobilizing enzymes within designed CNT networks. There is the potential that glucose or glucose oxidase could be immobilized efficiently on CNT electrodes, resulting in greatly enhanced stability of a fuel cell, due to an absence of diffusion of the enzyme to the cathode. There is also the possibility of enhanced performance of the cell because of more loading capability of enzymes on CNT networks.2–4 High supramolecular recognition capabilities, from CD immobilized in CNT, have also been demonstrated for biosensor applications.6 Immobilized cyclodextrin and cyclodextrin derivatives have been shown to be effective in the detection of dopamine.7–11 Taken as a whole, this reinforces the need to investigate glucose or cyclodextrin based CNT electrodes at a fundamental level. We herein present the electronic structure of cyclodextrin–carbon nanotube composite films obtained by using the electron photoemission spectroscopy.
2. Experimental
The cyclodextrin (CD) incorporated CNT films were synthesized by a simple sol–gel method and compared, including electrochemical response to biomolecules, electronic structure and CD localization based on the core levels and valence band spectroscopies performed before and after annealing at 350 °C. The graphite (200 mesh) and multi-walled CNT (20 μm of length, 10 nm of diameter) were purchased from Alfa Aesar and Hanwha Nanotech, respectively, and the three kinds of CD (α, β and γCD) and biomolecules (dopamine and ascorbic acid) were purchased from Sigma-Aldrich and used without any pretreatment.The composites of α, β and γCD–CNT were synthesized by mixing of each CD (200 mg) and CNT (20 mg) in deionized (DI) water of 20 mL. Then the mixture was sonicated for 180 min at room temperature, followed by vacuum filtration, using a cellulose paper (ADVANTEC, 0.45 μm of pore size, 47 mm of diameter). The resulting α, β and γCD–CNT composite films were dried at 60 °C in a vacuum oven for overnight and then characterized.
The characteristic CD infrared absorption bands, belonging to the valence vibrations of the C–H bonds in the CH and CH2 groups at 2926 cm−1, absorption bands in the region of 1643 cm−1 related to distortions of the glucopyranoside ring, the deformation vibrations of the C–H bonds in the region 1400–1200 cm−1 as well deformation vibrations of the C–H bonds in the hydroxyl groups in the region 950–700 cm−1 were all observed (Fig. S1†). Typical X-ray diffraction (XRD) spectra of CNT were observed (Fig. S2†), and XRD spectra of the CD composites are very similar to those reported for CNT with βCD7 because of the general absence of CD crystallinity. The scanning electron microscopy (SEM) images (Fig. S3†) show fibers characteristic of the CNT structure clearly. Also the reduction of void volumes with the γCD–CNT composite compared to the βCD– and αCD–CNT composites is evident in the SEM images. The SEM images, by themselves, are not conclusive indicators of the CD placement in the composites.
The potential for supramolecular recognition of the biomolecules was investigated by electrochemical differential pulse voltammetry (DPV) using an EC-Lab (Bio-Logic, sp-150, France) in a three-electrode cell. An Ag/AgCl electrode (BAS) was used as the reference electrode, and a platinum wire was employed as the counter electrode. The working electrode was prepared by the following method. Each sample of 0.5 mg was dispersed well in 1 mL of 2-propanol and then the mixture of 10 μg was drop casted onto a glassy carbon electrode (GCE) and dried completely. The pulse amplitude of 2.5 mV, pulse width of 100 ms, and scan rate of 10 mV s−1 were applied for the DPV measurements. Each 0.25 mL of biomolecule was mixed with 0.1 M phosphate buffer solution (PBS, [H2PO4]−/[HPO4]2−, pH = 7.5) of 10 mL for the supramolecular recognition detection experiments. The thermogravimetric analysis (TGA, TGA Instruments, Q600, Ramp 10 °C min−1 to 900 °C, N2 gas) was also performed to measure components and its weight.
X-ray photoelectron spectroscopy (XPS) spectra were acquired with a hemispherical electron analyzer (Thermo VG Scientific VG100AX), collecting a modest solid angle of photoelectrons, making angle resolved X-ray photoemission possible. The Mg Kα line of 1253.6 eV was used for the X-ray photoemission and provided by a dual anode X-ray lamp (SPECS). Both source and electron energy analyzer elements, as well as the samples, were placed inside an ultra-high vacuum chamber of about 10−10 Torr,12–14 to suppress impurity contributions to the photoemission spectra. The combined resolution of the detector and X-ray source, was 1.1 eV, contributing to the full width at half maximum (FWHM) of the C 1s peak, but the measured binding energies should be accurate to 0.2 eV or better. The annealing of all samples was performed under vacuum conditions to investigate stability of the samples, while deterring reactions with ambient. The ramping time, from the onset of increased temperature, for the annealing procedure, was 1 hour. Samples were held at elevated temperatures, about 350 °C, for 3 hours, and allowed to cool for 12 hours back to room temperature. This means that any broadening that may be observed in either the valence band or core level photoemission spectra, must be the result of changes in the sample, and cannot be attributed to phonon effects. Binding energies are referenced to the Fermi level of gold, in intimate contact with the CD–CNT samples.
2.1. Biomolecule sensitivity
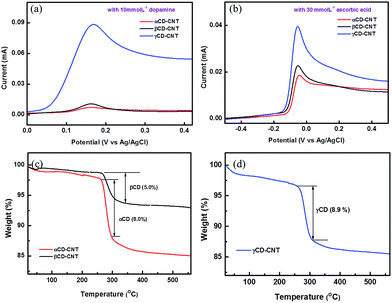
The electrochemical differential pulse voltammetry (DPV) responses of the αCD–CNT, βCD–CNT, and γCD–CNT films to dopamine of 10 mmol L−1 are very different, as shown in Fig. 1a. The oxidation peaks of dopamine at 0.17 eV are observed in all samples, but the response obtained from γCD–CNT is much higher relative to those of αCD–CNT and βCD–CNT. Similar behavior with ascorbic acid (30 mmol L−1) was also found, as seen in Fig. 1b. A higher response to the ascorbic acid, in the region near −0.05 V, was obtained from γCD–CNT, especially when compared to αCD–CNT and βCD–CNT. It is worth noting that the response of dopamine and ascorbic acid occurred at different potentials, opening up the possibility that these composites may be used to detect both simultaneously. | ||
| Fig. 1 Differential pulse voltammetry (DPV) responses of the samples to (a) dopamine and (b) ascorbic acid. Thermogravimetric analysis (TGA) results of (c) αCD–CNT and (d) γCD–CNT. | ||
The amount of CD immobilized by the CNT host was similar in both types of CD–CNT samples. Fig. 1c and d show the results of thermogravimetric analysis (TGA), finding that αCD–CNT, βCD–CNT and γCD–CNT have concentrations of 8.0, 5.0, and 8.9% of cyclodextrin (CD), respectively. The thermogravimetric analysis data are very similar to that reported reduced carbon nanotube composites with β-cyclodextrin,7 with most of the loss of mass occuring just below room temperature as observed here (Fig. 1c and d). More than twice higher DPV response of γCD–CNT, to the biomolecules tested here, cannot be attributed to the amount of CD, rather the differences may be due to the different cavity size of the CD or variations in the placement of the CD relative to the surface.
We note that the cyclic voltammetry (Fig. S4†) is qualitatively similar to that reported for the high pH,10,11 but far more significant in magnitude. The currents measured for γCD–CNT are much higher than observed for αCD–CNT, suggesting better surface placement for the former.
The electronic structure may also have a significant contribution to the vastly different responses seen to the biomolecules and cannot be excluded a priori: the frontier orbital symmetries have not been determined by the measurements reported here.
2.2. The electronic structure and cyclodextrin stability
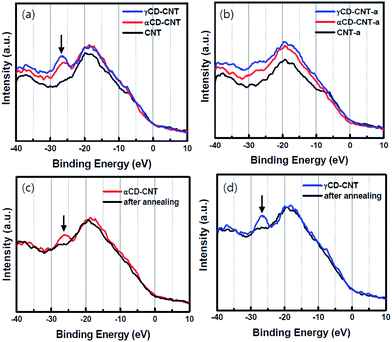
As seen in Fig. 2, there are no significant differences seen in the valence bands of the various samples: valence bands of αCD–CNT and γCD–CNT resemble that of CNT, as shown in Fig. 2a. The one easily recognized difference between αCD–CNT and γCD–CNT and that of CNT is the O 2s peak, with a binding energy near 27 eV relative to the top of the valence band. Such a shallow core level originates from the CD, and is an excellent signature of cyclodextrin as the carbon nanotubes used here are not heavily oxidized and contaminated with only a small amount of adventitious oxygen. With the addition of either αCD or γCD to the CNT, there neither band shift nor Fermi level placement change were observed, with respect to the valence band of CNT. This implies that no redox interaction or charge transfer between CD and CNT occurred, providing favourable electrodes for biosensor application.The shallow core level peak near 27 eV, that originates from the CD, is much diminished after the annealing at 350 °C, as shown in Fig. 2b, where γCD–CNT-a, αCD–CNT-a, and CNT-a refer to the spectra taken from the samples after the annealing. The valence bands before and after annealing are displayed in Fig. 2c for αCD–CNT and Fig. 2d for γCD–CNT, not only confirming the presence of this 27 eV binding energy CD feature, below the bottom of the valence band, but also demonstrating that considerable shallow O 2s core level photoemission peak intensity is lost with the annealing. The latter suggests cyclodextrin decomposition occurs upon annealing. It was also found that higher intensity of the CD peak was obtained from γCD–CNT, as is associated with increased numbers of –C![[double bond, length as m-dash]](https://www.rsc.org/images/entities/char_e001.gif) O moieties that exist in γCD–CNT as compared to αCD–CNT, not vastly different CD concentrations, consistent with the TGA results.
O moieties that exist in γCD–CNT as compared to αCD–CNT, not vastly different CD concentrations, consistent with the TGA results.
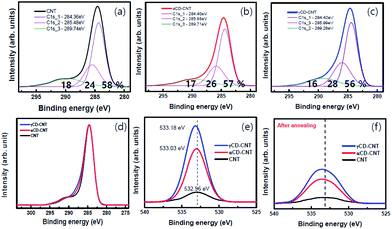
The core level XPS spectra of αCD–CNT, are generally similar to that of the γCD–CNT, as seen in Fig. 3. The precursor CNT has the typical sp2 C 1s peak near 284.4 eV binding energy, the C 1s core level associated with an oxygen bond, near 285.5 eV, and the π–π* satellite peak near 290 eV binding energy, as shown in Fig. 1a. αCD–CNT and γCD–CNT have more oxygen, than the bare CNT film, compared in Fig. 3d. It is also evident in O 1s core level spectra intensities (Fig. 3e), all with binding energies in the region of 533 ± 0.1 eV. The increased oxygen content in αCD–CNT and γCD–CNT leads to a shift of the core level binding energies associated with the –C![[double bond, length as m-dash]](https://www.rsc.org/images/entities/char_e001.gif) O moieties from 285.5 eV (for the bare CNT film) to 285.9 ± 0.1 eV, as seen in Fig. 3b and c. The more detailed comparison of the C 1s XPS spectra of the various samples is displayed in Fig. 3d. This too confirms that γCD–CNT has the most intense oxygen to carbon C 1s peak (the C 1s component in the region of 286 eV) with αCD–CNT second.
O moieties from 285.5 eV (for the bare CNT film) to 285.9 ± 0.1 eV, as seen in Fig. 3b and c. The more detailed comparison of the C 1s XPS spectra of the various samples is displayed in Fig. 3d. This too confirms that γCD–CNT has the most intense oxygen to carbon C 1s peak (the C 1s component in the region of 286 eV) with αCD–CNT second.
The comparison of the XPS O 1s spectra in Fig. 3e and f also indicates that cyclodextrin degradation occurs upon the annealing, consistent with the changes in the valence band photoemission spectra, discussed above. The O 1s peak intensities decreased after the annealing although the oxygen γCD–CNT remains more intense than that of αCD–CNT. Also key it the O 1s XPS core level feature has a much increased full width of half maximum: the full width of half maximum increases from roughly 3 eV to nearly 5 eV, indicating that the residual oxygen is in a much more heterogeneous environment after annealing, only possible if there is cyclodextrin decomposition.
Aside from the biomolecule sensitivity, the big difference between αCD–CNT and γCD–CNT is in the π–π* satellite peak near 290 eV binding energy, 289.7 ± 0.2 eV for αCD–CNT (Fig. 3b) and 289.3 ± 0.3 eV binding energy for γCD–CNT (Fig. 3c). This feature is the result of a mixture of interband transitions from π to π* (that occurs at the M point in graphene15) and a π band plasmonic excitation, commonly seen in the C 1s XPS spectra for graphene.16 The shift in this satellite feature suggests differences in the interband transition or differences in the screening of the two hole bound state.
2.3. The placement of the cyclodextrin
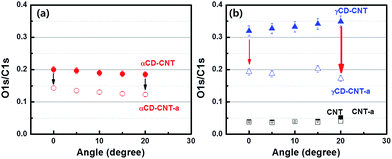
Since the top of the valence band and the core level spectra do not appear to differ significantly between γCD–CNT as compared to αCD–CNT, differences in the γCD placement, relative to αCD has been explored by angle dependent XPS. The oxygen to carbon ratio is mapped from XPS O 1s to C 1s peak intensity. Fig. 4a show the oxygen to carbon ratio obtained from αCD–CNT before (filled circles) and after (empty circles) annealing with respect to the angle, by using the angle dependent X-ray photoelectron spectroscopy. The O/C ratio for αCD–CNT decreases as the angle increases, meaning that less oxygen exists at the surface in αCD–CNT, compared to bulk or subsurface oxygen. Because of the limited electron mean free path (roughly 1–2 nm), increasing the photoelectron take-off angle means that the surface contributes more to the XPS signal than the subsurface, so as the O 1s signal is largely a result of the cyclodextrin, a decrease in the O 1s signal relative to the background carbon C 1s signal means there is less cyclodextrin at the surface than in the near subsurface region. The trend of the O/C XPS signal ratio, after annealing, remains very similar although, as discussed above, the oxygen content in αCD–CNT has diminished.The O/C ratio obtained from γCD–CNT, as shown in Fig. 4b, increases with increases in the photoemission take-off angle, implying that more of the γCD is located on the surface. Basically, the signature of the cyclodextrin increases with the increased surface sensitivity that accompanies increasing the photoemission take-off angle.17 The greater surface placement of γCD is consistent with the larger size of γCD compared to αCD. The greater surface localization of CD for the γCD–CNT very likely contributes to the far greater activity as a biosensor, resulting in enhanced electrochemical responses to the biomolecules. Because greater surface localization more γCD is available for direct charge transfer between CD and biomolecules. The higher response of γCD–CNT compared to αCD–CNT is, therefore, due to not only large cavity size of the γCD but also favorable surface position of CD in γCD–CNT. A schematic to assist in clarifying the different placement of αCD and γCD in the composites has been provided in the ESI (Fig. S5†).
3. Conclusions
The two kinds of cyclodextrin–carbon nanotube (αCD–CNT and γCD–CNT) composite films studied here show vastly different performance as biosensors to ascorbic acid and dopamine. The valence bands of the different composite films are very similar to the CNT valence band except for the photoemission peak at binding energies near 27 eV below Fermi level, originating from cyclodextrin. We infer that there are no redox interactions between CD and CNT and the CD–CNT composite films are, therefore, good candidates of electrodes for the biosensor applications. The CD of γCD–CNT is likely distributed to a significantly greater extent near the surface rather than in the bulk or subsurface region, while αCD–CNT has a CD placement relatively greater in the subsurface. It is not clear if differences in the electron structure of two different cyclodextrin species plays a role, but the placement of the larger cyclodextrin closer to the surface does imply that the cyclodextrin size is a significant factor in biosensor applications. Certainly, the CD of γCD–CNT is more active with respect to the biomolecules studied here. We conclude that the γCD–CNT film is the better electrode for biosensor applications compared to the αCD–CNT film due to the largest size of CD relative to other CDs and because of the more favourable surface placement of γCD in the composite.Acknowledgements
This work was supported by Basic Science Research Program through the National Research Foundation of Korea (NRF-2016R1D1A3B04931018) and the work at the University of Nebraska was supported by the U.S. Department of Energy through grant #DE-FG02-07ER15842.References
- G. Tiwari, R. Tiwari and A. K. Rai, J. Pharm. Bioall. Sci., 2010, 2, 72–79 CrossRef CAS PubMed.
- M. J. Moehlenbrock and S. D. Minteer, Chem. Soc. Rev., 2008, 37, 1188–1196 RSC.
- J. Kim, H. Jia and P. Wang, Biotechnol. Adv., 2006, 24, 296–308 CrossRef CAS PubMed.
- J. Kim and J. W. Grate, Nano Lett., 2003, 3, 1219–1222 CrossRef CAS.
- K. L. Knoche, D. P. Hickey, R. D. Milton, C. L. Curchoe and S. D. Minteer, ACS Energy Lett., 2016, 1, 380–385 CrossRef CAS.
- H. N. Le and H. K. Jeong, J. Phys. Chem. C, 2015, 119, 18671–18677 CAS.
- J. Cheng, P. R. Chang, P. Zheng and X. Ma, Ind. Eng. Chem. Res., 2014, 53, 1415–1421 CrossRef CAS.
- M. Palomar-Pardavé, S. Corona-Avendaño, M. Romero-Romo, G. Alarcón-Angeles, A. Merkoçi and M. T. Ramírez-Silva, J. Electroanal. Chem., 2014, 717, 103–109 CrossRef.
- S. Corona-Avendaño, G. Alarcón Ángeles, M. Romero Romo, A. Merkoçi, A. Rojas Hernandez, M. T. Ramírez Silva and M. Palomar Pardavé, ECS Trans., 2011, 36, 385–392 Search PubMed.
- G. Alarcón-Ángeles, B. Pérez-López, M. Palomar-Pardavé, M. T. Ramírez-Silva, S. Alegret and A. Merkoçi, Carbon, 2008, 46, 898–906 CrossRef.
- Y. Wu, Z. Dou, Y. Liu, G. Lv, T. Pu and X. He, RSC Adv., 2013, 3, 12726–12734 RSC.
- J. A. Johnson, B. M. Petersen, A. Kormos, E. Echeverría, Y. S. Chen and J. Zhang, J. Am. Chem. Soc., 2016, 138, 10293 CrossRef CAS PubMed.
- E. Echeverría, F. L. Pasquale, J. A. Santana, L. Zhang, R. James, A. Sokolov, J. A. Kelber and P. A. Dowben, Mater. Lett., 2013, 110, 20–23 CrossRef.
- H. K. Jeong, L. Hong, X. Zhang, E. Vega and P. A. Dowben, Carbon, 2013, 57, 227–231 CrossRef CAS.
- I. Santoso, P. K. Gogoi, H. B. Su, H. Huang, Y. Lu, D. Qi, W. Chen, M. A. Majidi, Y. P. Feng, A. T. S. Wee, K. P. Loh, T. Venkatesan, R. P. Saichu, A. Goos, A. Kotlov, M. Rübhausen and A. Rusydi, Phys. Rev. B: Condens. Matter Mater. Phys., 2011, 84, 081403(R) CrossRef.
- M. Zhou, F. L. Pasquale, P. A. Dowben, A. Boosalis, M. Schubert, V. Darakchieva, R. Yakimova, L. Kong and J. A. Kelber, J. Phys.: Condens. Matter, 2012, 24, 072201–072206 CrossRef PubMed.
- H. Iwai, J. S. Hammond and S. Tanuma, J. Surf. Anal., 2009, 15, 264–270 CAS.
Footnote |
| † Electronic supplementary information (ESI) available: Details of XRD, FTIR, SEM, cyclic voltammetry results and a schematic. See DOI: 10.1039/c6ra26900a |
| This journal is © The Royal Society of Chemistry 2017 |


