 Open Access Article
Organic template-free synthesis of zeolite Y nanoparticle assemblies and their application in the catalysis of the Ritter reaction†
Ting Tang,
Lei Zhang,
Hai Dong,
Zhongxue Fang,
Wenqian Fu*,
Quanyong Yu and
Tiandi Tang *
*
Advanced Catalysis and Green Manufacturing Collaborative Innovation Center, School of Petrochemical Engineering, Changzhou University, Changzhou, Jiangsu 213164, P. R. China. E-mail: tangtiandi@wzu.edu.cn; fuwenqian@cczu.edu.cn; tangtiandi@cczu.edu.cn
First published on 23rd January 2017
Abstract
Zeolite Y nanoparticle assemblies (Y-NA) with a mesoporous structure were directly synthesized at 75 °C for 16 h without adding any organic templates. The changes in structure, morphology and textural parameters of the materials obtained after different crystallization times were investigated via powder X-ray diffraction (XRD), infrared spectroscopy (IR), scanning electron microscopy (SEM), transmission electron microscopy (TEM) and N2-sorption. The results show that Y-NA had a micro–mesoporous structure composed of highly crystalline particle assemblies with sizes of 400–900 nm. The H-form Y-NA (HY-NA) is strongly acidic, and exhibits a good catalytic performance in the Ritter reaction, as compared with the H-form microporous zeolite Y and mesoporous zeolite ZSM-5.
1. Introduction
Aluminosilicate zeolites are crystalline materials with a characteristic well-defined pore structure, strong acidity, and large surface area, and have been widely used as heterogeneous catalysts in the petrochemical and fine chemical industries.1–4 Among them, zeolite Y is one of the most important solid acid catalysts employed in hydrocracking, isomerization and hydrotreating processes5–7 due to its three-dimensional pore structure with 12-membered ring channels (0.74 nm).8,9 Despite the relatively large micropores in zeolite Y, they do not allow the diffusion of molecules of a size larger than 0.74 nm, greatly hindering its industrial applications.Conventionally, this issue can be overcome by introducing mesopores into the zeolite crystals by the steam dealumination process.8,10,11 However, the drawback of this method is that the microporous framework can be destroyed.10 In the last decade, several types of templating methods, including hard (nanostructured carbons)12,13 and soft templating (organic surfactants),14,15 were developed and successfully applied to prepare hierarchical porous and nanosized zeolites, such as ZSM-5,13,15 Beta,16 MOR17,18 and titanium silicalite zeolites.19,20 The hierarchical porous structure in zeolites and the relatively large outer surface of nanozeolites can greatly promote molecule diffusion and improve reaction rates and product selectivity in various transformations.9,10 Recently, we first synthesized mesoporous zeolite Y by directly templating with organosilane, and the supported Pd catalyst presented a good catalytic performance in the hydrodesulfurization of bulk 4,6-dimethyldibenzothiophene.21 Subsequently, zeolite Y nanoparticles were also synthesized, which could assemble to form flower-shaped card-like nanosheets with a micro–mesoporous structure.22 These Y nanoparticles-assembled Pd species show high activity and product selectivity in the vinylation of thiophenes. Despite the mesoporous zeolite Y and zeolite Y nanoparticles showing a good catalytic activity for the conversion of the bulk molecules, an organic template must be added to the initial synthesis gel, and a longer crystallization time (4 days) is required for the synthesis of zeolite Y nanoparticles. The use of organic templates not only increases the synthetic cost but also results in the production of environmentally unfriendly waste gases, generated during the removal of the organic templates by calcination at high temperatures.3,4 A three-stage temperature-controlled process without organic template was developed by Wang and coworkers for the synthesis of zeolite Y nanoparticles,23 but the method was complicated and the crystallization time was relatively long (96 h).23 Therefore, finding organic template-free, rapid and simple processes for the synthesis of mesoporous zeolite Y and zeolite Y nanoparticles is still a challenge.
Herein, zeolite Y nanoparticles (Y-NA) were synthesized via a simple process without adding organic template at 75 °C for 16 h. During the crystallization, the nanoparticles aggregated into large assemblies with a size of 400–900 nm, which were easily separated via filtration. In addition, these aggregates exhibited a mesoporous structure. The H-form Y-NA sample (HY-NA) was strongly acidic, similar to the microporous zeolite Y. Finally, HY-NA exhibited a good catalytic performance in the Ritter reaction of aromatic nitriles with tert-alcohols, compared to H-form microporous zeolite Y and mesoporous zeolite ZSM-5.
2. Experimental
2.1. Synthesis of zeolite Y nanoparticle assemblies
Zeolite Y nanoparticle assemblies (Y-NA) were hydrothermally synthesized from a starting gel with a molar composition of Al2O3/14.4Na2O/9.8SiO2/590H2O. In a typical synthesis, 9.9 mL of water glass, 5 g of NaOH and 25.4 mL of deionized water were mixed at room temperature and stirred for 2 h. Subsequently, 27 mL of 3.9 wt% NaAlO2 aqueous solution was added slowly under vigorous stirring. After stirring for 20 h, the obtained gel was crystallized at 75 °C for the required time inside a Teflon-coated stainless-steel autoclave of 50 mL capacity. The product was isolated by filtration, washed and dried at 120 °C overnight, and finally calcined at 300 °C for 4 h to eliminate crystal water. For reference, a conventional zeolite Y sample (Y) and mesoporous zeolite ZSM-5 (ZSM-5-M) were synthesized according to a literature procedure.24,25 The H-form of the samples was obtained via ion exchange with 1 M NH4NO3 solution at 80 °C for 4 h, followed by calcination at 500 °C in air for 4 h under a N2 stream; this process was repeated twice. The obtained samples were designated as HY-NA, HY and HZSM-5-M. The scale-up synthesis of Y-NA was performed in a 5 L stainless steel (316L) autoclave, and denoted as Y-NAL. The starting gel composition, synthetic procedure and reaction conditions were similar to those described above.2.2. Characterization
The X-ray diffraction (XRD) patterns of the sample were obtained with a RIGAKU SmartLab diffractometer using Cu Kα radiation. Nitrogen adsorption–desorption isotherms were recorded on a Micromeritics ASAP 2020M apparatus at the temperature of liquid nitrogen (−196 °C). Samples were degassed at 300 °C for 8 h prior to the measurements. Specific surface area was calculated using the Brunauer–Emmett–Teller (BET) equation according to the adsorption data. The pore size distribution was calculated according to the Barrett–Joyner–Halenda (BJH) model.IR spectra were recorded on a Nicolet iS50 instrument. Scanning electron microscopy (SEM) images were recorded on a field emission scanning electron microscope (SUPRA55) operating at an acceleration voltage of 5 kV. Transmission electron microscopy (TEM) images were obtained on a JEM-2100 microscope with a limited line resolution capacity of 1.4 Å at a voltage of 200 kV.
The acidity of the zeolite was measured using temperature-programmed desorption of ammonia (NH3-TPD) on a Micromeritics ASAP 2920 instrument equipped with a thermal conductivity detector. A quartz tubular reactor was loaded with 200 mg of the sample and heated under a He stream at a heating rate of 5 °C min−1 from room temperature to 450 °C and maintained at this temperature for 2 h. Once the sample was cooled to 120 °C under a He flow, a NH3–He mixed gas (10 vol% NH3) flow was passed over the sample for 30 min. After removing physically adsorbed NH3 by flowing He for 90 min, the sample was heated to 600 °C at a heating rate of 10 °C min−1.
The 27Al and 29Si solid-state NMR spectra of Y-NA were obtained on a Bruker AVANCE III 400WB spectrometer operated at 9.4 T using 4 and 7 mm od rotors (zirconia), respectively. The 27Al solid-state NMR spectra was recorded using a pulse of 0.5 μs (π/18) and a repeat time of 0.1 s with a rotor spinning rate of 14 kHz. The 29Si solid-state NMR spectra was recorded using a pulse of 4.5 μs (π/2) and a repeat time of 20 s with a rotor spinning rate of 6 kHz.
2.3. Catalytic test
All reagents, unless otherwise noted, were obtained from commercial sources (purity > 99%) and used without further purification. The reagent p-tolunitrile (98%) was purchased from Energy Chemical, and t-BuOH (99.5%) was purchased from Aladdin. The typical experimental procedure for the Ritter reaction was as follows: 100 mg of catalyst, p-tolunitrile (0.5 mmol) and t-BuOH (1.0 mL) were placed into a 10 mL glass vessel under N2 atmosphere. The reaction proceeded at 120 °C for 12 h. Subsequently, the catalyst was separated via centrifugation and filtered to obtain the liquid phase that was analyzed with an Agilent 7890B gas chromatograph equipped with a flame ionization detector. The final products were purified using flash column chromatography on silica gel employing petroleum ether and ethyl acetate as eluents. The 1H NMR (500 MHz) and 13C NMR (125 MHz) were recorded at 20 °C in CDCl3. Chemical shifts were given in parts per million relative to TMS as the internal standard at room temperature.The scale-up reaction and recycling experiments were performed in a Parr 4560 autoclave of 300 mL capacity. Typically, the synthetic procedure was: 10 g of catalyst, p-tolunitrile (50 mmol) and t-BuOH (100 mL) were heated at 120 °C and stirred for 12 h at 300 rpm. The used catalyst was carefully collected and dried at 120 °C for 10 h, and then calcined at 500 °C in air for the recycling experiment.
3. Results and discussion
3.1. Characterization
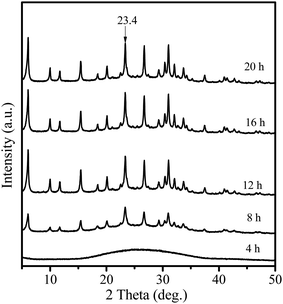
Fig. 1 shows the XRD patterns of the samples obtained after different crystallization times. When the sample was crystallized for 4 h, only a broad profile, attributed to an amorphous structure, is present in the XRD pattern. When the crystallization time increased to 8 h, the pattern displayed clear diffraction peaks at 6.1°, 15.5°, 23.4° and 26.7°, ascribed to the faujasite structure,21 indicating that crystalline zeolite Y had been formed. Furthermore, prolonging the crystallization time to 12 h led to a considerable increase in the intensity of the characteristic faujasite peaks. The diffraction peak intensity was slightly increased after 16 h, and almost no change for the sample crystallized for 20 h was observed. These results suggest that highly crystalline zeolite Y is rapidly formed within 16 h. Compared with those of the microporous zeolite Y (Fig. S1†), the diffraction peaks of the Y-NA sample were broader. The full width half maximum (FWHM) is 0.289 at 23.4° for the Y-NA sample, higher than that for the microporous zeolite Y sample (0.207), suggesting that Y-NA could be composed of relatively smaller crystal particles.To gain an insight into the evolution of the sample at different crystallization times, the obtained samples were characterized via SEM and TEM techniques. After 4 h crystallization, the SEM image shows irregular shapes consisting of amorphous nanoparticles with sizes of 30–70 nm (Fig. 2a). The nanoparticle morphologies are in agreement with the TEM image (Fig. 3a), where a hollow structure in the amorphous nanoparticles was observed (arrows in Fig. 3a). After crystallization for 8 h, most of the amorphous nanoparticles are aggregated into larger particles, and these particles seemingly present an irregular crystal morphology (Fig. 2b). However, the TEM image shows that amorphous particles are still present, and the amorphous and crystalline phases are interlaced (Fig. 3b). When the crystallization time was prolonged to 12 h, the particles displayed a crystal morphology and were composed of aggregated disordered nanoparticles (Fig. 2c). Mesopores (white zone) could be formed in these aggregates (Fig. 3c). The TEM image also confirms that these disordered nanoparticles are highly crystalline (Fig. 3c). Furthermore, prolonging the crystallization time to 16 h, the amorphous analogues disappear and the particles present a clear crystal outline with a particle size of 400–900 nm (Fig. 2d and 3d). From the SEM and TEM images, the interstitial mesopores could be observed in the nanoparticle aggregates.
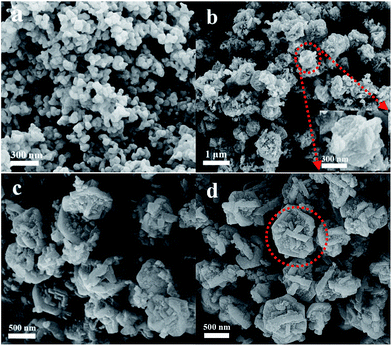 | ||
| Fig. 2 SEM images of the samples obtained at different crystallization times (a) 4 h, (b) 8 h, (c) 12 h and (d) 16 h. | ||
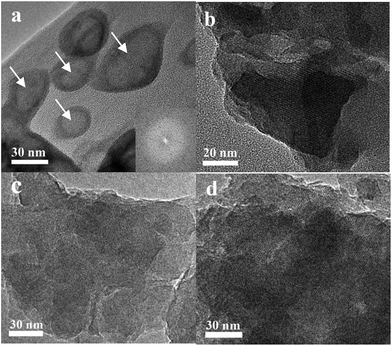 | ||
| Fig. 3 TEM images of Y-NA samples obtained at different crystallization times (a) 4 h, (b) 8 h, (c) 12 h and (d) 16 h. Inset of (a) electron diffraction pattern. | ||
Fig. S2† shows 29Si MAS NMR and 27Al MAS NMR spectra of the Y-NA sample obtained after a crystallization time of 16 h. The Y-NA sample displays the 29Si signals for Q4 at −85.4, −89.3 and −93.1 ppm (Fig. S2a†), which could be assigned to Si(4Al), Si(3Al) and Si(2Al), respectively.26,27 A very weak peak at −102.1 ppm could be attributed to the presence of surface SiOH (Q3) in the Y-NA sample.28 Interestingly, only one signal at 59.3 ppm, associated with tetrahedrally coordinated framework aluminum species, was observed,29 while no signal was found at 0 ppm, which is characteristic of extra-framework aluminium (Fig. S2b†).29,30 These results indicate that the Y-NA sample had a good crystallinity.
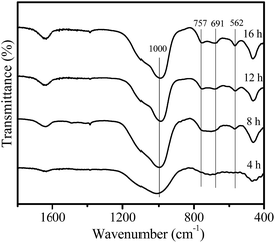
Fig. 4 shows the IR spectra of the samples crystallized for different times. After a crystallization time of 4 h, only an absorption band at 1000 cm−1 was observed, which should be attributed to the asymmetric stretching vibration of tetrahedral TO4 units (T = Si or Al).23 For the crystallization time of 8 h, the faujasite characteristic bands at 562, 691 and 757 cm−1 appear, which could be associated with the double ring vibration and symmetric stretching vibration of the Al–O–Si in the zeolite framework,23 indicating that zeolite Y crystals were formed. As crystallization time increases, these characteristic bands gradually become more intense.
According to the analyses of the crystal growing process, it can be concluded that zeolite Y nanoparticles were formed via a solution-mediated crystallization mechanism.31 As the crystallization time elapsed, the initial amorphous phase gradually disappeared, leaving cavities (arrows in Fig. 3a) in the amorphous particles. The amorphous particles may have dissolved into solution, and then relatively small zeolite crystals may have formed and grown to afford bulk zeolite crystals using the dissolved species as the crystal seeds.
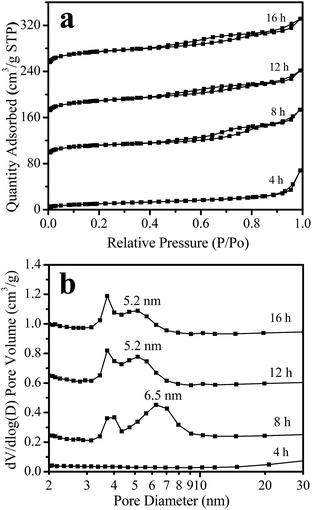
Fig. 5 shows the nitrogen adsorption isotherms and mesopore size distribution of the samples obtained after different crystallization times. For the sample crystallized for 4 h, the adsorption is very low; the sample has a BET surface area of only 37 m2 g−1 (Table 1). For the sample crystallized for 8 h, the isotherms display a hysteresis loop at a relative pressure of P/P0 = 0.45–0.85 (Fig. 5a), indicating a mesoporous structure for this sample with a BET surface area of 437 m2 g−1 (Table 1) and a pore size centered at 6.5 nm (Fig. 5b). These results indicate that a highly porous structure was formed in this sample. Furthermore, prolonging the crystallization time from 8 to 12 and 16 h, the isotherm shapes remained unchanged (Fig. 5a), but the adsorption of the sample greatly increased, the mesoporous size decreased to 5.2 nm (Fig. 5b), and the BET surface area increased from 437 m2 g−1 (8 h-sample) to 608 and 687 m2 g−1 for the 12 and 16 h-samples, respectively (Table 1). At the same time, the microporous volume also increased from 0.17 to 0.24 cm3 g−1. These results indicate that the sample crystallinity gradually increases with the crystallization time.
| Sample | SBETa (m2 g−1) | Smicb (m2 g−1) | Vmicc (cm3 g−1) | Sextd (m2 g−1) | Vmese (cm3 g−1) |
|---|---|---|---|---|---|
| a BET surface area.b Microporous surface area.c Microporous pore volume.d External surface area, including mesoporous surface area.e Mesoporous pore volume.f Sample crystallized for 4 h.g Sample crystallized for 8 h.h Sample crystallized for 12 h.i Sample crystallized for 16 h. | |||||
| Y-NAf | 37 | — | — | 37 | 0.09 |
| Y-NAg | 437 | 420 | 0.17 | 53 | 0.11 |
| Y-NAh | 608 | 522 | 0.21 | 85 | 0.13 |
| Y-NAi | 687 | 587 | 0.24 | 100 | 0.14 |
| Y-NAL | 647 | 556 | 0.23 | 111 | 0.15 |
| Y | 741 | 682 | 0.28 | 59 | 0.05 |
| ZSM-5-M | 418 | 250 | 0.1 | 168 | 0.37 |
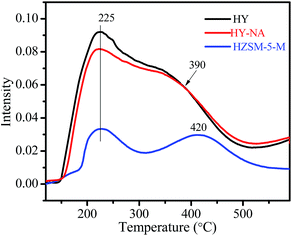
Fig. 6 shows the NH3-TPD curves of the HY-NA, HY and HZSM-5-M zeolites. It is clear that the HY-NA and HY samples present the same desorption profile. The low temperature desorption profile with a peak at 225 °C is related to moderately acidic sites, and the high temperature shoulder peak at 390 °C corresponds to strong acidic sites. Clearly, the acid site density of HY-NA and HY is much higher than that of the HZSM-5-M zeolite.
Fig. S3† shows the XRD pattern and SEM image of the Y-NAL sample. It is clear that the morphology of Y-NAL is similar to that of Y-NA, obtained at 50 mL bench scale. Notably, Y-NAL has a BET surface area, microporous volume and mesoporous volume of 647 m2 g−1, 0.23 and 0.15 m3 g−1, respectively, similar to the Y-NA sample (Table 1).
3.2. Catalyst performance
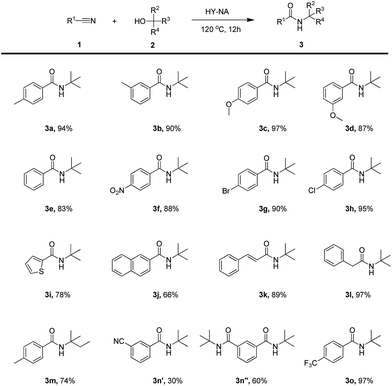
The activity of HY-NA, HZSM-5-M and HY catalysts was first investigated in the Ritter reaction of the p-tolunitrile with t-BuOH as the model reaction (Table 2). The HY-NA catalyst shows the highest activity and target product selectivity, affording the target product in 95% yield (Table 2, entry 2). As a comparison, the p-tolunitrile conversions over HY and HZSM-5-M catalysts are only 51% and 59%, respectively, much lower than that of the HY-NA catalyst (Table 2, entries 3, 4).The scope of the HY-NA-catalyzed Ritter reaction was investigated with various nitriles and tertiary alcohols, and the results are summarized in Table 3. Benzonitrile with either electron-rich or electron-withdrawing groups were successfully applied to this transformation to generate the corresponding amides 3a–3h in high yields. The nitriles bearing 2-thienyl and 2-naphthyl afforded 3i and 3j in moderate yields. When cinnamonitrile was used as substrate, the amide 3k was obtained with a good yield of 89%. To our delight, the aliphatic phenylacetonitrile was also successfully transformed, generating the corresponding amide 3l in 97% yield. When isoamylol was used as a substrate, the yield of the obtained amide 3m was 74%. In addition, 1,3-benzenedicarbonitrile was efficiently converted to the corresponding products 3n′ and 3n′′ (molar ratio 1![[thin space (1/6-em)]](https://www.rsc.org/images/entities/char_2009.gif) :
:![[thin space (1/6-em)]](https://www.rsc.org/images/entities/char_2009.gif) 2). Remarkably, the benzonitrile containing a trifluoromethyl group also afforded the target product 3o in a 97% yield.
2). Remarkably, the benzonitrile containing a trifluoromethyl group also afforded the target product 3o in a 97% yield.
| a Reaction conditions: p-tolunitrile (0.5 mmol), t-BuOH (1 mL), catalyst (100 mg), 120 °C. |
|---|
 |
The reusability of the zeolite HY-NA catalyst for the Ritter reaction of p-tolunitrile with t-BuOH was also tested under the standard reaction conditions. Fig. S4† shows the time dependence of p-tolunitrile conversion and the initial apparent reaction rates (robs) over the HY-NA catalyst for the first and fourth runs (for details please see the ESI†). Table 4 shows the reusability test results for the HY-NA catalyst. From Fig. S4a,† it can be seen that the initial reaction activity of the HY-NA catalyst in the first run is slightly higher than that of the reused catalyst in the fourth run, and the robs calculation results in Fig. S4b† also demonstrate that the robs (4.4 × 10⁻² mol kg−1 s−1) for the fresh HY-NA catalyst in the first run is much higher than that of the reused HY-NA catalyst (3.5 × 10⁻² mol kg−1 s−1) in the fourth run. Nevertheless, the p-tolunitrile conversions over fresh and reused HY-NA catalysts at a reaction time of 12 h were similar. The data in Table 4 also shows that the HY-NA catalyst exhibits a high activity even after the seventh run, indicating that the HY-NA catalyst has a good reusability.
| Entry | Recycle | Yield (%) |
|---|---|---|
| a Reaction conditions: 10 g catalyst, p-tolunitrile (50 mmol), t-BuOH (100 mL), 120 °C for 12 h, 300 rpm. | ||
| 1 | Run 1 | 94 |
| 2 | Run 2 | 93 |
| 3 | Run 3 | 92 |
| 4 | Run 4 | 93 |
| 5 | Run 5 | 91 |
| 6 | Run 6 | 92 |
| 7 | Run 7 | 90 |
The superior catalytic performance of the HY-NA catalyst should be attributed to its unique micro–mesoporous structure and the abundant strongly acidic sites. HY and HY-NA have a similar density of strong acid sites, but the p-tolunitrile conversion over HY-NA is higher than that over the HY zeolite catalyst. This could be due to the difference in the porous structure between Y and Y-NA zeolites. The Y-NA catalyst has a mesoporous surface area of 100 m2 g−1 and mesoporous volume of 0.14 cm3 g−1, whereas Y catalyst only has a low external surface area of 59 m2 g−1. Thus, the mesopores in the HY-NA catalyst could favor the reactant diffusion, enhancing the reaction rate. Similar phenomenon was also reported by Wu.32 He reported that microporous zeolite HY with a lower external surface area inhibited the diffusion of the reactants, resulting in an unsatisfactory catalytic activity and selectivity in the Ritter reaction of acrylonitrile with t-butanol, compared to that of ultrastable mesoporous zeolite. Compared with Y-NA, although ZSM-5-M has a high mesoporous surface area (168 m2 g−1) and mesopore volume (0.37 cm3 g−1), the p-tolunitrile conversion over HZSM-5-M is only 59% (Table 2). This is due to the fact that the acid site density on the HZSM-5-M catalyst is much lower than that on the HY-NA catalyst. Thereby, a high density of strongly acidic sites is critical for this transformation. On the other hand, Y-NA has a relatively large micropore size of 0.74 nm and a relatively high microporous surface area (587 m2 g−1), while ZSM-5-M has a relatively small micropore (0.53–0.56 nm) and low micropore surface area (250 m2 g−1). Therefore, the HY-NA catalyst, with a relatively large micropore size and high microporous surface area, could provide a higher number of accessible acid sites compared to that of HZSM-5-M, resulting in a higher catalytic activity for the HY-NA catalyst. Wu also reported that because of the steric hindrance effect due to the micropore size (0.55 nm) in mesoporous zeolite ZSM-5, t-butanol is not easily accessible to the acidic sites in the microporous channels, resulting in lower target product selectivity over mesoporous zeolite ZSM-5 in the Ritter reaction of acrylonitrile with t-butanol.32
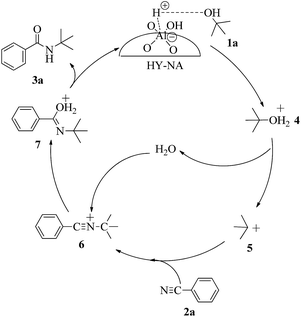
The possible reaction mechanism over HY-NA is shown in Fig. 7. The alcohol is easily protonated by the acidic sites on the HY-NA catalyst to give the oxonium ion 4 that can eliminate one water molecule to form the carbocation intermediate 5. This carbocation is attacked by electron-rich p-tolunitrile nucleophiles to form the nitrilium ion 6,32 which is subsequently attacked by a water molecule, followed by the elimination of a proton to generate the final compound.32
4. Conclusion
Crystalline zeolite Y nanoparticle assemblies (Y-NA) with micro–mesoporous structure were directly synthesized via a one-step crystallization method in the absence of an organic template. This synthesis process is cost-effective, environmentally friendly and capable of scale-up. The SEM and TEM characterization results indicate that the Y-NA zeolite may be formed via a solution-mediated crystallization mechanism. The obtained zeolite HY-NA catalyst not only is strongly acidic, but also has a micro–mesoporous structure. The strongly acidic sites in the HY-NA can facilitate the activation of the tertiary alcohols, and the mesoporous structure in the HY-NA can favor the diffusion of the reactants and products. Finally, the HY-NA catalyst could be recycled up to seven times and still maintain a good catalytic activity.Acknowledgements
This study was supported by the National Natural Science Foundation of China (U1463203, 21476030, U1662139) and the Natural Science Foundation of the Jiangsu Province of China (BK20150258).Notes and references
- A. Corma, Chem. Rev., 1995, 95, 559–614 CrossRef CAS.
- M. E. Davis, Nature, 2002, 417, 813–821 CrossRef CAS PubMed.
- X. Meng and F.-S. Xiao, Chem. Rev., 2014, 114, 1521–1543 CrossRef CAS PubMed.
- Q. Wu, X. Liu, L. Zhu, L. Ding, P. Gao, X. Wang, S. Pan, C. Bian, X. Meng, J. Xu, F. Deng, S. Maurer, U. Müller and F.-S. Xiao, J. Am. Chem. Soc., 2015, 137, 1052–1055 CrossRef CAS PubMed.
- Z. Qin, B. Shen, X. Gao, F. Lin, B. Wang and C. Xu, J. Catal., 2011, 278, 266–275 CrossRef CAS.
- J. García-Martínez, M. Johnson, J. Valla, K. Li and J. Ying, Catal. Sci. Technol., 2012, 2, 987–994 Search PubMed.
- B. Wang, M. Lin, X. Peng, B. Zhu and X. Shu, RSC Adv., 2016, 6, 44963–44971 RSC.
- A. H. Janssen, A. J. Koster and K. P. de Jong, J. Phys. Chem. B, 2002, 106, 11905–11909 CrossRef CAS.
- W. Jiao, W. Fu, X. Liang, Y. Wang and M. He, RSC Adv., 2014, 4, 58596–58607 RSC.
- S. van Donk, A. H. Janssen, J. H. Bitter and K. P. de Jong, Catal. Rev.: Sci. Eng., 2003, 45, 297–319 CAS.
- L. Zhang, W. Fu, Q. Ke, S. Zhang, H. Jin, J. Hu, S. Wang and T. Tang, Appl. Catal., A, 2012, 433–434, 251–257 CrossRef CAS.
- H. Zhu, Z. Liu, D. Kong, Y. Wang and Z. Xie, J. Phys. Chem. C, 2008, 112, 17257–17264 CAS.
- J.-B. Koo, N. Jiang, S. Saravanamurugan, M. Bejblová, Z. Musilová, J. Čejka and S.-E. Park, J. Catal., 2010, 276, 327–334 CrossRef CAS.
- M. Choi, H. S. Chi, R. Srivastava, C. Venkatesan, D.-H. Choi and R. Ryoo, Nat. Mater., 2006, 5, 718–723 CrossRef CAS PubMed.
- L. Zhang, W. Fu, Q. Yu, T. Tang, Y. Zhao and Y. Li, J. Catal., 2017, 345, 295–307 CrossRef CAS.
- J. Zhu, Y. Zhu, L. Zhu, M. Rigutto, A. van der Made, C. Yang, S. Pan, L. Wang, L. Zhu, Y. Jin, Q. Sun, Q. Wu, X. Meng, D. Zhang, Y. Han, J. Li, Y. Chu, A. Zheng, S. Qiu, X. Zheng and F.-S. Xiao, J. Am. Chem. Soc., 2014, 136, 2503–2510 CrossRef CAS PubMed.
- T. Tang, L. Zhang, W. Fu, Y. Ma, J. Xu, J. Jiang, G. Fang and F.-S. Xiao, J. Am. Chem. Soc., 2013, 135, 11437–11440 CrossRef CAS PubMed.
- T. Liu, W. Fu, X. Zheng, J. Jiang, M. Hu and T. Tang, RSC Adv., 2014, 4, 18217–18221 RSC.
- Z. Kang, G. Fang, Q. Ke, J. Hu and T. Tang, ChemCatChem, 2013, 5, 2191–2194 CrossRef CAS.
- M. Xiang, X. Ni, X. Yi, A. Zheng, W. Wang, M. He, J. Xiong, T. Liu, Y. Ma, P. Zhu, X. Zheng and T. Tang, ChemCatChem, 2015, 7, 521–525 CrossRef CAS.
- W. Fu, L. Zhang, T. Tang, Q. Ke, S. Wang, J. Hu, G. Fang, J. Li and F.-S. Xiao, J. Am. Chem. Soc., 2011, 133, 5346–15349 CrossRef PubMed.
- W. Fu, Y. Feng, Z. Fang, Q. Chen, T. Tang, Q. Yu and T. Tang, Chem. Commun., 2016, 52, 3115–3118 RSC.
- Y. Huang, K. Wang, D. Dong, D. Li, M. R. Hill, A. J. Hill and H. Wang, Microporous Mesoporous Mater., 2010, 127, 167–175 CrossRef CAS.
- S. Xu, Z. Yun, Y. Feng, T. Tang, Z. Fang and T. Tang, RSC Adv., 2016, 6, 69822–69827 RSC.
- W. Fu, L. Zhang, D. Wu, M. Xiang, Q. Zhuo, K. Huang, Z. Tao and T. Tang, J. Catal., 2015, 330, 423–433 CrossRef CAS.
- H. Zhang, X. Meng, Y. Li and Y. S. Lin, Ind. Eng. Chem. Res., 2007, 46, 4186–4192 CrossRef CAS.
- Y. C. Kim, J. Y. Jeong, J. Y. Hwang, S. D. Kim and W. J. Kim, J. Porous Mater., 2009, 16, 299–306 CrossRef CAS.
- B.-Z. Zhan, M. A. White, M. Lumsden, J. Mueller-Neuhaus, K. N. Robertson, T. S. Cameron and M. Gharghouri, Chem. Mater., 2002, 14, 3636–3642 CrossRef CAS.
- C. A. Fyfe, J. L. Bretherton and L. Y. Lam, J. Am. Chem. Soc., 2001, 123, 5285–5291 CrossRef CAS PubMed.
- K. Sato, Y. Nishimura, N. Matsubayashi, M. Imamura and H. Shimada, Microporous Mesoporous Mater., 2003, 59, 133–146 CrossRef CAS.
- C. S. Cundy and P. A. Cox, Chem. Rev., 2003, 103, 663–701 CrossRef CAS PubMed.
- S.-C. Wu, J. B. Wang and T.-C. Tsai, Top. Catal., 2010, 53, 1419–1429 CrossRef CAS.
Footnote |
| † Electronic supplementary information (ESI) available. See DOI: 10.1039/c6ra27129d |
| This journal is © The Royal Society of Chemistry 2017 |

