 Open Access Article
Evaluation of the performance of zero-electrolyte-discharge microbial fuel cell based on the type of substrate†
Lai Linkeab,
Zhang Lijuana and
Sam Fong Yau Li *b
*b
aDepartment of Chemistry, Faculty of Science, National University of Singapore, 3 Science Drive 3, Singapore 117543
bDepartment of Chemistry, Faculty of Science, NUS Graduate School for Integrative Sciences & Engineering (NGS), National University of Singapore, 28 Medical Drive, Singapore 117456. E-mail: chmlifys@nus.edu.sg; Tel: +65 6516 2681
First published on 16th January 2017
Abstract
In MFCs that are used to generate electricity, the discharging of phosphate electrolyte is not economical and environmentally friendly. To address this issue, the concept of “zero-electrolyte-discharge” MFCs was developed. In this study, the performance of “zero-electrolyte-discharge” air-cathode MFCs were critically evaluated using different types of substrates (sugar, alcohol, fatty acid, and salt). A final power loss of 68% and 48% was observed for the glucose- and ethanol-fed MFCs, respectively. This power loss was found to be mainly due to the substantially increased internal resistances under decreased electrolyte pH that is induced by the fast production of acidic metabolites. Moreover, cathodic biofilm growth was found to cause a higher electrolyte pH at the cathodic catalyst layer, resulted in a lower open circuit voltage (OCV) and power density. Among the studied substrates, our results suggest that acetic acid is the most suitable candidate for the zero-electrolyte-discharge MFC system since it provides a stable electrolyte environment and least cathodic biofilm growth. The drawbacks of using sodium acetate as an MFC substrate have also been discussed and it is compared with acetic acid.
1. Introduction
Microbial fuel cells (MFC) directly convert biomass energy into electricity using an electroactive bacteria as a biocatalyst. The possible applications of MFC for both power generation and wastewater treatment lead to its intensified research over the past few years.1–3 Among all the MFC set-ups, the single-chamber air-cathode MFC is to date the most prominent configuration since mediator or cathodic aeration is not required in its operation, thus saving cost and at the same time keeping the internal resistances at a minimum level.4–6A buffer solution is commonly used as an electrolyte in MFCs to alleviate the pH change. Phosphate buffer is the preferred electrolyte in the MFC systems due to its buffer capacity, which is close to neutral pH.7 MFCs are commonly operated in batch or continuous-flow mode.8–10 In both cases, the electrolyte still requires to be replaced, either intermittently or continuously, to restore the buffer pH. However, in wastewater treatment application, discharging the “electrolyte” (i.e. wastewater) is usually not an issue. However, for sole power generation purpose, discharging the electrolyte is not very appealing since it considerably increases the operational cost. On the other hand, the high phosphate content buffer of the discharged stream may cause serious eutrophication of the water system.11 To address this issue, alternative buffer systems, such as bicarbonate and saline, with lower buffer capacities or MFC performances have been reported.12,13 To address these issues, continuously operated MFCs without replacing the electrolyte, or “zero-electrolyte-discharge” MFCs, might be an ultimate solution. To realize a zero-electrolyte-discharge operation, maintenance of electrolyte properties becomes crucial. The internal environment of MFCs is highly dependent on the type of the substrate. An ideal substrate should completely and efficiently break down to the “clean” end products of water (in vapor form) and CO2, which are slowly removed from the system through the air-cathode. However, these substrates are rare. Intermediate products, such as fatty acids, are often produced as a result of diverse bacterial communities present in the anodic biofilm and distinct metabolic pathways undergone by the substrates.14,15
Previous studies on MFC substrates mostly focused on the issues of power density, energy conversion efficiencies or kinetics of degradation.4,16 However, a comprehensive study on the relationship between substrate type and operational sustainability under zero-electrolyte-discharge conditions has not been reported. In this study, four typical MFC substrates (glucose, ethanol, acetic acid (AA), and sodium acetate (SA)) were selected as energy sources for the single-chamber air-cathode MFCs. Polymeric substrates, such as cellulosic biomass, were not selected since they are not suitable for energy generation due to their low solubility and slow kinetics.4,17 During the experiments, the properties of the electrolyte were monitored by several key quality indicators including pH, buffer strength, and biomass accumulation. The effects of the changing electrolyte environment on MFC performance were monitored by analyzing the power densities and internal resistances of individual MFCs. Intermediate products were profiled by nuclear magnetic resonance (NMR) spectroscopy. Based on the results, we attempted to correlate the variations of electrolyte properties with the changes in the MFC performance and understand how the choice of substrate affects these properties.
2. Experimental
2.1 Materials & cell construction
A typical MFC reactor used in this study (Fig. S1†) was assembled by stacking an anode and air-cathode between four pieces of acrylic parts with thin silicone gaskets to form an air-tight cylindrical chamber, which was 4 cm in diameter and 2 cm in length with a total volume of approx. 25 mL, and the distance between the anode and cathode was maintained at 1 cm for all the experiments. The anodes and cathodes were made of plain and 30% wet proofing carbon cloth (Fuel Cell Earth LLC, USA), respectively. Both electrodes had an effective area of 12.5 cm2. The air-cathodes were made according to a reported method5 with 0.5 mg cm−2 Pt loading (10% Pt/C, Fuel Cell Earth LLC, USA). Thin titanium wires were tightly sandwiched between the electrodes and gaskets for use as current collectors.2.2 Microorganism and electrolytes
Domestic wastewater (primary clarifier effluent) obtained from the Ulu Pandan Water Reclamation Plant (Singapore) was initially used as an inoculum for our MFCs. For the past four years, the enrichment of electroactive species has been carried out by inoculating fresh anodes using effluents from the acclimated MFCs. Based on the 16S rRNA sequencing and bacterial identification (ESI Section 1†) performed by Axil Scientific Pte. Ltd, the anodic biofilm was found to contain common anodic species including Acetoanerobium (38%), Enterobacteriaceae (25%), Clostridium (13%), and Stenotrophomonas (13%).14,18,19 The phosphate buffer saline (PBS) stock solution (400 mM) contained the following compounds (per litre): NaH2PO4·H2O, 19.62 g; Na2HPO4·2H2O, 45.89 g; KCl, 1.04 g; NH4Cl, 2.48 g; minerals (12.5 mL) and vitamins (12.5 mL)20 were used as stock solutions for the subsequent appropriate dilutions. Concentrated substrate stock solutions were prepared by mixing the following: glucose, 2.34 g; ethanol, 1.20 g; sodium acetate, 3.20 g; and acetic acid, 2.34 g each with DI water to make 10 mL solutions with a COD value of 250![[thin space (1/6-em)]](https://www.rsc.org/images/entities/char_2009.gif) 000 mg L−1. Substrate stock solutions were kept in the fridge (4 °C) and restocked with fresh solutions on a weekly basis. All mineral salts and substrates were purchased from Sigma-Aldrich (USA) with a minimum purity of 99%.
000 mg L−1. Substrate stock solutions were kept in the fridge (4 °C) and restocked with fresh solutions on a weekly basis. All mineral salts and substrates were purchased from Sigma-Aldrich (USA) with a minimum purity of 99%.
2.3 Inoculation and experimental conditions
Typical anode inoculation was carried out in batch mode by repeatedly refilling the MFC chamber with effluent from the acclimated MFCs whose COD value was adjusted to 500 mg L−1 using sodium acetate, external resistor was changed from 10 kΩ in the beginning to a minimum value of 10 Ω, and inoculation was stopped when the peak working voltage reached a constant value for at least 3 consecutive runs. During the repetitively-fed experiment, individual MFCs were initially filled with 50 mM PBS buffer whose COD value was adjusted to 2000 mg L−1 by adding substrate stock solutions (0.20 mL). After adding the substrate, the pH value was adjusted to a common starting value of 7.1 by the addition of either phosphoric acid (85%) or sodium hydroxide solution (10 M). Resistors with a resistance of 465 Ω were used as the only external resistors for the entire experiment. During the experiment, samples of electrolytes were taken out from the MFCs every 10–20 hours using a plastic dropper for analysis. Substrate stock solution and DI water were then added to replenish the electrolyte solutions lost due to substrate depletion and water evaporation. After the completion of the analysis, electrolytes were backfilled into the respective MFCs. The amount of the added substrate stock solution was calculated using the method described in the ESI (Section 2).† Details of the bacteria culturing and impedance analysis are given in the ESI (Sections 3 and 4).† A continuous experiment was performed for a total of 130 hours. After this, separate batch-mode experiments were carried out using the same MFCs. In the batch mode experiments, electrolyte contents were analyzed via NMR spectroscopy after one hour of operation. The anodic and cathodic half-cell potential was analyzed against the Ag+/AgCl reference electrode after 24 hours of operation (ESI Section 5†). All MFCs were operated inside a homemade thermostatic chamber (Fig. S2†) and the internal temperature of the chamber was maintained at 25 °C. Holes drilled at the back of the chamber enabled the connection of MFCs with other devices (e.g. data acquisition system).2.4 Analytical methods and calculations
The working voltage was determined every 10 seconds by a workstation equipped with an 8-channel data acquisition (DAQ) module, ADAM-4017, and home-made data acquisition software (Fig. S2†). Average power densities were calculated using the following eqn (1):
 | (1) |
The pH value of the electrolyte was measured using a UB-10 Ultrabasic pH meter (Denver Instrument, USA). The conductivity of the electrolyte was analyzed using an HQ40d multi-parameter meter equipped with an IntelliCAL™ CDC401 conductivity probe (Hach Company, USA). COD analysis was performed using a standard method via UV-vis spectroscopy (Hach Company, USA). The dry mass of the cathodic biofilm was obtained by weighing the freeze-dried biomass scratched off from the cathode. Electrochemical impedances were analyzed using an IviumStat electrochemical station (Ivium Technologies, the Netherlands) in two different settings. Setting A: closed circuit with an external resistance of 465 Ω; two-electrode mode; and frequency range from 10![[thin space (1/6-em)]](https://www.rsc.org/images/entities/char_2009.gif) 000 Hz to 0.05 Hz. Setting B: open circuit; three-electrode mode; and frequency range from 10
000 Hz to 0.05 Hz. Setting B: open circuit; three-electrode mode; and frequency range from 10![[thin space (1/6-em)]](https://www.rsc.org/images/entities/char_2009.gif) 000 Hz to 0.05 Hz. Simulation of the EIS results was performed by the ZSimpWin software using the equivalent circuit, as shown in Fig. S3.† NMR spectra (1H with presaturation, sample contained 10% D2O) were obtained by a 600 MHz NMR Inova spectrometer (Agilent Technologies, USA), and subsequently the obtained spectra were profiled by the Chenomx NMR Suite to identify the metabolites and calculate their molar ratios.
000 Hz to 0.05 Hz. Simulation of the EIS results was performed by the ZSimpWin software using the equivalent circuit, as shown in Fig. S3.† NMR spectra (1H with presaturation, sample contained 10% D2O) were obtained by a 600 MHz NMR Inova spectrometer (Agilent Technologies, USA), and subsequently the obtained spectra were profiled by the Chenomx NMR Suite to identify the metabolites and calculate their molar ratios.
Typical results are presented in this study. All experiments and measurements were performed in at least 3 replicates to ensure reproducibility and creation of error bars.
3. Results & discussion
3.1 MFC performances
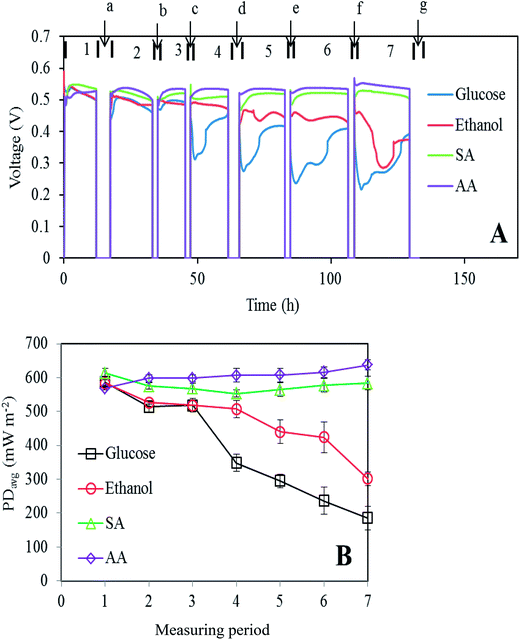
The continuous experiment was divided into 7 operational periods when the working voltages were obtained and 7 analysis periods (Fig. 1A) when the MFCs were disconnected from the DAQ, and the electrolyte was analyzed using various techniques. The results demonstrate how the use of different substrates as energy sources will affect the long-term performance of an MFC. The working voltage remained constant above 0.5 V for the sodium acetate and acetic acid fed MFCs. However, in the case of glucose or ethanol, the voltage showed a clear declining trend as the experiment time increased. An unexpected “S-shape” voltage profile was also observed in both the cases. When reflected in power densities, the drop in the working voltage for the glucose and ethanol fed MFCs corresponded to 68% and 48% average power density reduction, respectively, in period 7 as compared to that in period 1 (Fig. 1B). To understand this strange-looking graph, it is necessary to look into the changes that occurred in the electrolyte.3.2 Electrolyte pH & osmolarity
Most MFC studies used a relatively neutral medium (pH ∼7.0) as an electrolyte, which indicated that the nature of the anodic bacterial strains was essentially neutrophilic. Studies on the relationship between the pH value of the electrolyte and MFC performance also indicated that these electroactive strains are more tolerant to high pH. Low electrolyte pH often leads to poorer MFC performances such as lower power density or incomplete substrate degradation.21,22 An example of acidophilic biofilms has also been reported.23 Our results (Fig. S4†) indicate that the anodic electrogens in our MFCs are more tolerant to alkaline environment pH (8.0–9.0), whereas under acidic conditions (pH < 6.5), anodic impedance starts to rapidly increase. These results also indicate that the cathodic impedances are relatively independent of electrolyte pH.Starting from a common pH value of 7.1, the pH values for all four MFCs were continuously monitored at each analysis period and the results are shown in Fig. 2A. An increased electrolyte pH value of up to 8 in the sodium acetate fed MFC was caused by the introduction of each hydroxide ion resulting from the oxidation of one acetate molecule and reduction of two oxygen molecules at both electrodes (overall reaction: C2H3O2− + 2O2 → 2CO2 + H2O + OH−). The pH increase has only a minor effect on the working voltage of MFC (Fig. 1). In the cases of glucose and ethanol, the electrolyte pH decreased mainly due to the production of fatty acids, which will be discussed hereinafter. After 100 h of operation, the electrolyte pH of all the MFCs tended to stabilize; for the SA fed MFC, this is due to the reaction between dissolved carbon dioxide and hydroxide ions: CO2 + OH− → HCO3−, whereas for glucose and ethanol, it is probably resulted from the establishment of equilibrium between fatty acid production and consumption by the anodic bacteria.
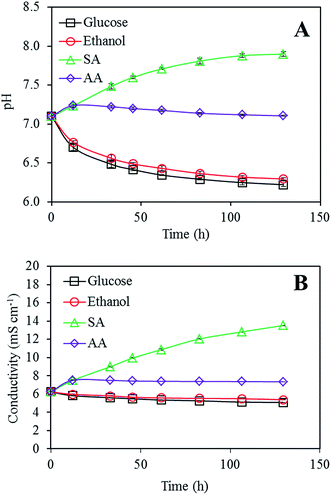 | ||
| Fig. 2 (A) Variations in the electrolyte pH with MFC operation time, with a common initial pH of 7.1. (B) Variations in the electrolyte conductivity (at 25 °C) with MFC operation time. | ||
Osmotic concentration is a measure of all solute concentrations in the electrolyte, and it plays an important role in maintaining the electrolytic balance and turgor of the bacterial cell wall. A too high or too low level of osmolarity may possibly affect the growth or even survival of bacteria. Ionic strength, a term used to indicate the concentration of ions in a solution, displays a proportional relationship with osmolarity if the solution contains only a fixed set of charged solutes, such as PBS medium. Therefore, it can also be used as an indicator of osmotic concentration. In our experiment, the ionic strength of the electrolyte was monitored by measuring its specific conductivity. Similar to the study on pH, we examined the electrochemical impedance of both electrodes under different electrolyte concentrations. The results (Fig. S5†) suggest that the optimal buffer strength was about 25 mM, which has the lowest activation resistance (i.e. smallest semi-circle in the Nyquist plot). A substantial increase in anodic impedance was observed after the electrolyte concentration exceeded 100 mM. Cathodic impedance again displayed no obvious correlation with the electrolyte concentration.
The conductivity of the electrolyte was monitored during the continuous experiment and the result is shown in Fig. 2B. The electrolyte conductivity of the SA fed MFC increased about two-fold at the end of the experiment due to the introduction of Na+ ion. Glucose, ethanol, and AA showed a similar pattern of slowly decreasing conductivities. Ion chromatography of the electrolyte (results not shown) suggests that the conductivity drop is related to the depletion of ammonium and phosphate ions in the electrolyte.
3.3 Biomass accumulations
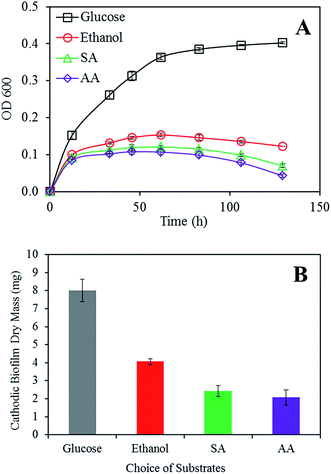
It is known that biofilm can be found in both anode and cathode in a single chamber MFC.24 Although homogenous covered biofilms on the anode are usually desirable, thicker biofilms do not necessary mean higher power production.25To investigate how the choice of substrate affects the bacterial growth, we monitored the concentration of bacteria in the electrolyte as well as the amount of newly formed biofilm on the cathodes (Fig. 3). Images of the electrolyte and a biofilm sample obtained at the end of experiment are also presented (Fig. S6†). Anodic biofilms were not included in our investigation since they showed no significant development during the short experiment period. The obtained results indicate a faster bacterial growth rate both on the electrode and in the electrolyte when glucose is present. When compared with two-carbon substrates, the six-carbon structure of glucose provides ready-to-use building blocks for the synthesis of larger biomolecules.26 The ability to be anaerobically utilized also makes glucose a favorable energy source for bacterial replication under oxygen depleted conditions. However, sodium acetate and acetic acid maintained the bacterial growth at a level of about 1/3 that of glucose, and similar results were observed for ethanol. A decreased bacterial growth rate (glucose) or concentration (ethanol, AA, and SA) was observed as the experiment progressed. This was probably caused by the depletion of necessary nutrients (e.g. NH4+, vitamins, and minerals) in the electrolyte, which is also consistent with our previous observation of a drop in the electrolyte conductivity.
3.4 Power analysis
To understand the changing trend of power densities, we first look at the factors that affect the power output, as shown in eqn (2).
 | (2) |
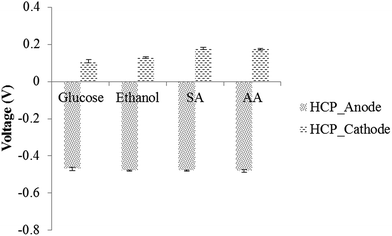
The power is determined by three factors, namely the open circuit voltage (OCV), the internal resistance of the MFC (Rint), and the external resistance (Rext). Since the external resistance was fixed throughout the experiment, power production will only be affected by the remaining two factors. From eqn (2), it can be seen that an increase in the internal resistance adversely affects the power output by increasing the total resistance (i.e. denominator in the parenthesized term). However, power output is proportional to the square of OCV. Note that unlike the standard cell electromotive force (E0), the OCV of any cell does not have a fixed value and it is easily affected by a change in the operation conditions. Eqn (3) and (4) show the calculation of OCV and half-cell potential, respectively.
| OCV = HCP′cat − HCP′an | (3) |
 | (4) |
The effect of choosing different substrates on the internal resistance and open circuit voltage of MFC is discussed below.
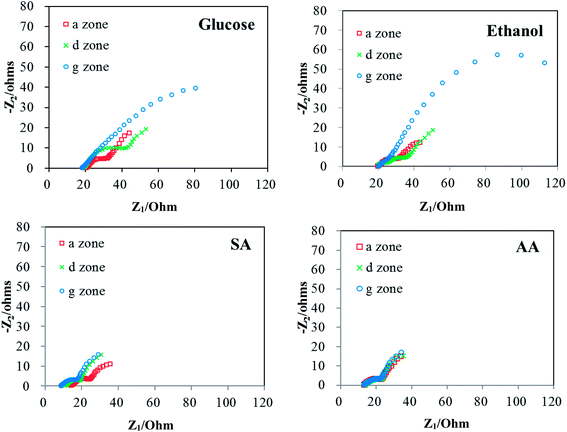 | ||
| Fig. 4 Electrochemical impedance (Nyquist plots) obtained at analysis period a, d, and g. Measurements were performed in the two-electrode closed circuit mode with a 465 ohm external resistor. | ||
Based on the abovementioned discussion, the increase in the internal resistance of the glucose and ethanol fed MFCs was mainly caused by drop in the electrolyte pH to below 6.5. The observation that the MFCs fed with sodium acetate showed a stable performance is consistent with our finding that an electrolyte concentration as high as 100 mM and an alkaline pH value as high as 9 are well tolerated by anodic bacteria. To better control the electrolyte pH under different circumstances, it is necessary to understand the reason behind the decrease in the pH value.
In a separate set of batch experiments, the identity and composition of the organics present in the electrode were analyzed and the results are summarized in Fig. 5. The suggested role of anodic bacteria species in producing these metabolites is shown in Fig. 6.15 The lack of Propionibacterium suggests that propionate may be produced by another species, following an unknown metabolic pathway.27
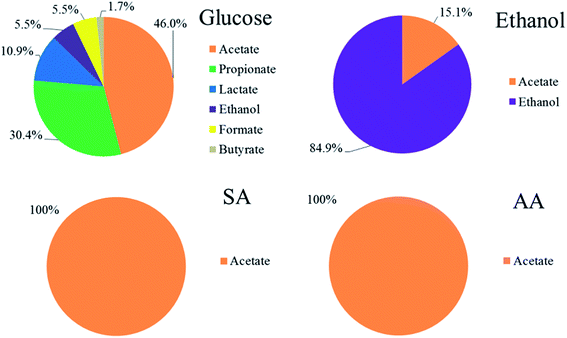 | ||
| Fig. 5 Composition (molar percentage) of organics detected in the electrolyte by 1H NMR spectroscopy after one hour operation using different substrates. | ||
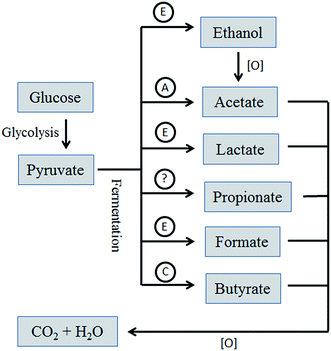 | ||
| Fig. 6 Simplified metabolic pathway of substrates and the suggested role of the identified anodic bacteria species. Symbols: (A) Acetoanerobium; (C) Clostridium; (E) Enterobacteriacea. | ||
These results suggest that the main reason for the decrease in pH in the glucose and ethanol fed MFCs is due to the production of fatty acids including acetic acid, propionic acid, formic acid, lactic acid, and butyric acid. Glucose was degraded into fatty acid due to the rapid fermentation processes, which resulted in electrolyte acidification. This explains the uncommon “S-shape” voltage profile in the glucose-fed MFC in the latter part of the experiment. The rapid voltage decline was caused by a rapid increase in the internal resistance due to low pH, and the slow climb in the voltage is due to the degradation of these fatty acids to produce CO2 and water. Similarly, the oxidation of ethanol to form acetic acid also caused the electrolyte pH to decline. The difference between the glucose and ethanol fed MFCs is that the kinetics of ethanol oxidation is not as fast as that of glucose fermentation and also electrolyte acidification. Since anaerobic fermentation of glucose does not require an electron acceptor (e.g. oxygen) to proceed, its kinetics is not restrained by the amount of current generated.
 | (5) |
A plot of the amount of cathodic biomass against the pH gradient is shown in Fig. 8. The results indicate that the pH gradients over the cathodic biofilm are correlated (R2 = 0.8367) with the amount of the biofilm developed. At the anode side, due to the lack of oxygen in the surrounding electrolyte, the metabolism of bacteria is limited by the electricity generation process, thus the energy required for bacterial reproduction is in limited supply unless it can be generated through alternative ways such as fermentation. The anodic biofilm thickness is also limited by the limited distance between the bacteria and electrode that electrons can travel. However, these limitations do not exist at the cathode side and the cathodic biofilm can grow to the scale of millimeters as compared with the merely dozens of micron thick (at most) biofilm on the anode. As more OH− is trapped inside the cathodic biofilm, less OH− will be available to neutralize the H+ in the electrolyte and the electrolyte becomes more acidic over time.24 Herein, this effect was confirmed in the experiment since the electrolyte pH of the acetic acid fed MFC showed a declining trend and that of the sodium acetate-fed MFC stopped increasing in the latter stage. The glucose and ethanol fed MFCs are expected to show a faster declining pH since they developed a thicker biofilm over the cathode.
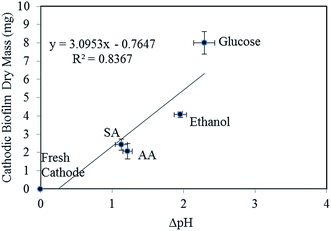 | ||
| Fig. 8 Relationship between the amount of cathodic biomass and the pH gradient over the cathodic biofilm. | ||
It can be seen that the increase in the catholyte pH will reduce the cathodic HCP. Note that a mere increase of 1 pH unit will lower the HCP by 0.059, which when reflected in power output equals a 14% drop (supposing that the original OCP is 0.83). The actual situation can be much worse if a thick biofilm is developed or if the MFC is operated at a high current density.
4. Conclusions
Continuous MFC operations under the zero-electrolyte-discharge condition using different types of substrates were conducted. Among the tested substrates, acetic acid was found to be the most suitable energy provider after close examination of several electrolyte quality indicators. The deteriorations in the performances observed in the glucose and ethanol-fed MFC are attributed to two factors. The long term effect of the decreasing electrolyte pH increases the internal resistance of the MFC. On the other hand, a thicker cathodic biofilm impedes OH− diffusion into the bulk electrolyte and leads to a higher pH at the surface of the cathode catalyst layer, which results in a lower OCV. To make MFC technology a sustainable source of electricity, effective strategies to suppress the cathodic biofilm growth are required.Acknowledgements
We acknowledge the financial support received from the National University of Singapore, Ministry of Education [R-143-000-582-112], the Environment and Water Industry Development Council Programme Office [EWI RFP 1301-IRIS-21 and EWI RFP 1301-IRIS-26]. Linke Lai would like to give special thanks to NUS Graduate School for Integrative Sciences & Engineering (NGS) for their generous scholarship to support his PhD studies.References
- X. Wang, Y. J. Feng and H. Lee, Water Sci. Technol., 2008, 57, 1117–1121 CrossRef CAS PubMed.
- S. Wu, H. Li, X. Zhou, P. Liang, X. Zhang, Y. Jiang and X. Huang, Water Res., 2016, 98, 396–403 CrossRef CAS PubMed.
- D. Hou, L. Lu and Z. J. Ren, Water Res., 2016, 98, 183–189 CrossRef CAS PubMed.
- Y. Fan, H. Hu and H. Liu, J. Power Sources, 2007, 171, 348–354 CrossRef CAS.
- H. Liu and B. E. Logan, Environ. Sci. Technol., 2004, 38, 4040–4046 CrossRef CAS PubMed.
- X. Zhang, W. He, L. Ren, J. Stager, P. J. Evans and B. E. Logan, Bioresour. Technol., 2015, 176, 23–31 CrossRef CAS PubMed.
- J. Y. Nam, H. W. Kim, K. H. Lim, H. S. Shin and B. E. Logan, Biosens. Bioelectron., 2010, 25, 1155–1159 CrossRef CAS PubMed.
- V. Lanas, Y. Ahn and B. E. Logan, J. Power Sources, 2014, 247, 228–234 CrossRef CAS.
- S. B. Pasupuleti, S. Srikanth, X. Dominguez-Benetton, S. V. Mohan and D. Pant, J. Chem. Technol. Biotechnol., 2016, 91, 624–639 CrossRef CAS.
- L. Ren, Y. Ahn, H. Hou, F. Zhang and B. E. Logan, J. Power Sources, 2014, 257, 454–460 CrossRef CAS.
- D. L. Correll, J. Environ. Qual., 1998, 27, 261–266 CrossRef CAS.
- Y. Ahn and B. E. Logan, Bioresour. Technol., 2013, 132, 436–439 CrossRef CAS PubMed.
- Y. Fan, H. Hu and H. Liu, Environ. Sci. Technol., 2007, 41, 5 CrossRef.
- A. S. Finch, T. D. Mackie, C. J. Sund and J. J. Sumner, Bioresour. Technol., 2011, 102, 312–315 CrossRef CAS PubMed.
- G. Gottschalk and S. Peinemann, in The Prokaryotes. A Handbook on the Biology of Bacteria: Ecophysiology, Isolation, Identification, Applications, ed. A. Balows, H. G. Tramper, M. Dworkin, W. Harder and K.-H. Schleifer, Springer-Verlag, New York, 2nd edn, 1992, vol. 1, pp. 300–311 Search PubMed.
- Y. Asensio, C. M. Fernandez-Marchante, J. Lobato, P. Canizares and M. A. Rodrigo, Water Res., 2016, 99, 16–23 CrossRef CAS PubMed.
- F. Ahmad, M. N. Atiyeh, B. Pereira and G. N. Stephanopoulos, Biomass Bioenergy, 2013, 56, 179–188 CrossRef CAS.
- G. Liu, M. D. Yates, S. Cheng, D. F. Call, D. Sun and B. E. Logan, Bioresour. Technol., 2011, 102, 7301–7306 CrossRef CAS PubMed.
- O. Tkach, L. Liu and A. Wang, J. Clean Energy Technol., 2015, 4, 36–42 CrossRef.
- D. R. Lovley and E. J. P. Phillips, Appl. Environ. Microbiol., 1988, 54, 1472–1480 CAS.
- Z. He, Y. Huang, A. K. Manohar and F. Mansfeld, Bioelectrochemistry, 2008, 74, 78–82 CrossRef CAS PubMed.
- E. R. Zhang, L. Liu and Y. Y. Cui, Adv. Mater. Res., 2013, 608–609, 884–888 Search PubMed.
- S. V. Raghavulu, S. V. Mohan, R. K. Goud and P. N. Sarma, Electrochem. Commun., 2009, 11, 371–375 CrossRef CAS.
- Y. Yuan, S. Zhou and J. Tang, Environ. Sci. Technol., 2013, 47, 4911–4917 CrossRef CAS PubMed.
- H. Yi, K. P. Nevin, B. C. Kim, A. E. Franks, A. Klimes, L. M. Tender and D. R. Lovley, Biosens. Bioelectron., 2009, 24, 3498–3503 CrossRef CAS PubMed.
- S. A. Ensign, Mol. Microbiol., 2006, 61, 274–276 CrossRef CAS PubMed.
- N. Reichardt, S. H. Duncan, P. Young, A. Belenguer, C. M. Leitch, K. P. Scott, H. J. Flint and P. Louis, ISME J., 2014, 8, 1323–1335 CrossRef CAS PubMed.
Footnote |
| † Electronic supplementary information (ESI) available. See DOI: 10.1039/c6ra27513c |
| This journal is © The Royal Society of Chemistry 2017 |

