 Open Access Article
Creative Commons Attribution 3.0 Unported Licence
Magnetic graphene oxide modified by chloride imidazole ionic liquid for the high-efficiency adsorption of anionic dyes†
Huan Wangab and
Yinmao Wei *a
*a
aKey Laboratory of Synthetic and Natural Function Molecule Chemistry of Ministry of Education, College of Chemistry & Materials Science, Northwest University, Xi'an 710069, China. E-mail: ymwei@nwu.edu.cn; Fax: +86-29-88302604; Tel: +86-29-88302604
bCollege of Chemistry and Chemical Engineering, Xianyang Normal College, Xianyang 712000, China
First published on 30th January 2017
Abstract
Magnetic graphene oxide modified with 1-amine-3-methyl imidazole chloride ionic liquid (LI-MGO) was prepared through chemical co-precipitation and modified using 1-amine-3-imidazolium chloride ionic liquid. The as-prepared LI-MGO was characterized using X-ray diffraction (XRD), transmission electron microscopy (TEM) and Fourier transform infrared spectrometry (FT-IR). The adsorption properties were evaluated through adsorption experiments with two kinds of anionic dyes, orange IV (OIV) and glenn black R (GR) and two kinds of cationic dyes, acridine orange (AO) and crystal violet (CV). The results indicated that the adsorption data fitted the Langmuir isotherm and followed pseudo-second-order kinetics. The maximum adsorption capacities for GR, OIV, AO and CV were 588.24, 57.37, 132.80 and 69.44 mg g−1 at 298 K, respectively. LI-MGO has better selective adsorption for anionic dyes than magnetic graphene oxide (MGO) due to electrostatic interactions. Moreover, the LI-MGO adsorbent can be magnetic separated and is easy to prepare. It demonstrated that LI-MGO would have great potential as an efficient environmentally friendly adsorbent for the removal of anionic dyes in water treatment.
1 Introduction
Organic dye wastewater discharged from industrial coloring and printing processes has many detrimental effects on the environment and human health.1 With better awareness of these problems, a number of techniques to remove dyes have been employed to treat wastewater, including degradation,2 electrochemical treatment,3 reverse osmosis,4 ion exchange, and adsorption.5,6 Among these methods, adsorption is believed to be the most effective way to remove dye from wastewater.7 Various adsorbents have been reported to remove dye from wastewater in the literature, such as clay minerals,8 oxides,9 zeolites10 and carbon materials.11,12 However, the performance of these materials is limited by their relatively low densities of surface functional groups.13 Graphene oxide, as a kind of carbon material, has attracted much attention as a potential adsorbent due to its high specific surface area and its ease of surface functionalization,14,15 which contains a large number of carboxyl, ketone, epoxy and hydroxyl groups on its surface.16 However, graphene oxide is usually collected through high-speed centrifugation, which increases the operational cost for its practical application.17 To overcome the challenges of its difficulty of separation, Fe3O4 magnetic nanoparticles have been increasingly utilized in magnetic separation, due to their distinguished magnetic properties.18,19Recently, graphene oxide20 and its hybrids were successfully synthesized with β-cyclodextrin and acrylic acid,21,22 metal oxides,23,24 4-aminothiophenol and 3-aminopropyltriethoxysilane,25 and tripolyphosphate26 to remove cationic dyes in wastewater, and showed enhanced adsorption properties because they combine the advantages of graphene oxide and functional groups. However, Ramesha et al.27 reported that graphene oxide showed removal efficiencies of up to 95% for cationic dyes, while the adsorption of anionic dyes was negligible, because the large negative charge density available in aqueous solutions helps the effective adsorption of cationic dyes on graphene oxide. Adsorbents for anionic dyes are usually surface cationic modified materials such as cationic surfactant hexadecylpyridinium bromide modified peanut shell,28 surfactant modified coir pith,29 cationic surfactant modified wheat straw,30 cationically modified orange peel powder31 and quaternary ammonium salt modified chitosan magnetic composites.32 But the adsorption capacity for anionic dyes on these adsorbents is lower. So there is an urgent need for the design of novel functional adsorbents for the efficient adsorption of anionic dyes. Changing the surface charge of graphene oxide through chemical modification is an important way to improve the effective adsorption of anionic dyes.
As a potential environmentally-friendly solvent, room temperature ionic liquids (ILs) are receiving much attention owing to their numerous advantages over conventional solvents, such as their good dissolving ability, recyclability, low volatility, non-flammability, high thermal and chemical stabilities, and high ionic conductivity.33,34 They have also been successfully applied in the areas of the separation of 2-phenylethanol,35 gas separation,36 and the recoveries of solvents37 and electrolytes in sensitized solar cells.38 Chen et al.39 has immobilized ammonium ionic liquids on LDHs to improve the adsorption properties for reactive orange 5. Liu et al.40 reported that a hyperbranched polymeric ionic liquid (hb-PIm+PF6−) with imidazolium backbones has been synthesized and it exhibited high adsorption capacity toward anionic dyes. An imidazolium-salt based IL containing nitrogen atoms can facilitate a high atomic percentage of nitrogen as a functional solvent due to the presence of more nitrogen atoms, which can further change the surface charge of the material.
Herein, novel LI-MGO nanocomposites were designed directly from MGO and chloride imidazole ionic liquid. In this paper, we introduced Fe3O4 nanoparticles to synthesize MGO through chemical co-precipitation, and then we utilized a chloride imidazole ionic liquid as a functional solvent to modify MGO, to prepare MGO-IL. The introduction of the Fe3O4 nanoparticles could well solve the difficulty of separation, and the IL not only increased the water-solubility of the composite but also could change the functional groups on the surface of MGO. MGO and LI-MGO were used for the adsorption of two anionic dyes and two cationic dyes from simulated wastewater with fast magnetic separation. The effects of treatment time, initial concentration and pH value on the dye adsorption capacity of the prepared LI-MGO are investigated. The adsorption kinetics and adsorption isotherms are also investigated by fitting the experimental data with different models and an adsorption mechanism is proposed. LI-MGO is found to possess a unique capability to remove anionic dyes very quickly and efficiently from wastewater.
2 Experimental section
2.1 Experimental reagents
Flake graphite (99.95%) was supplied by Qingdao Chenyang Graphite Co., Ltd. (Qingdao, China). Ferric chloride hexahydrate and ferrous chloride tetrahydrate were purchased from the National Medicine Group Chemical Reagent Co., Ltd. (Shanghai, China). Acridine orange (AO), crystal violet (CV), orange IV (OIV), glenn black R (GR), 1-methylimidazole and 1-amino-3-chloropropane hydrochloride were purchased from the Aladdin Chemical Reagent Co., Ltd. (Shanghai, China). The other reagents were of analytical grade.2.2 Preparation of adsorbents
2.3 Characterization of LI-MGO
1H NMR spectra of LI were obtained using an AV600 high resolution nuclear magnetic resonance spectrometer (Bruker, Germany). Transmission electron microscopy (TEM) images of MGO and LI-MGO were recorded using an H-600 electron microscope (Hitachi, Japan). Fourier transform infrared (FT-IR) spectra were obtained using a Nicolet iS10 FT-IR spectrophotometer (Thermo Fisher Scientific, USA). Wide-angle (5–70°, 40 kV/30 mA) powder X-ray diffraction (XRD) measurements were carried out using a D2 PHASER X-ray diffractometer (Bruker, Germany). The specific surface area and gas adsorption isotherms of the sample were measured using N2 physisorption measurements on an ASAP 2020C (Micromeritics, USA). Zeta potentials were measured on a Zetasizer Nano Series (Malvern, Britain).2.4 Adsorption experiments
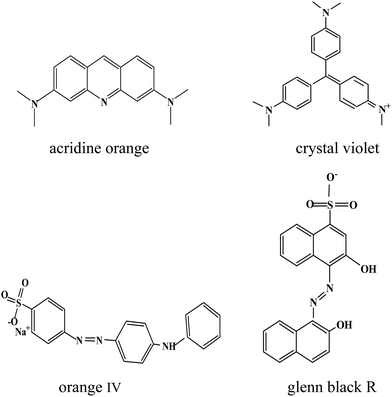
OIV and GR were chosen as the model of anionic dyes for dye adsorption studies, while AO and CV were chosen as the model of cationic dyes. The chemical structures of the four dyes are shown in Fig. 1. The adsorption processes for the dyes (initial concentration: 40 mg L−1) onto MGO and LI-MGO were carried out at the optimum pH and at different temperatures (4, 25, and 45 °C) in aqueous media. A sample of 0.01 g of MGO or LI-MGO was added to a conical flask with 25 mL of dye solution, and the mixture was shaken in a shaker for 12 h. Then the mixture was separated using a magnet and the final concentration of OIV, GR, AO and CV was determined using a UV-Vis spectrophotometer (SPECORD 50 PLUS, Analytikjena, Germany) at 440 nm, 520 nm, 490 nm and 580 nm, respectively. Similarly, the kinetics of adsorption were also measured at different dye concentrations (GR and AO: 20, 40, 60, 80, 100, and 120 mg L−1, and OIV and CV: 2, 4, 8, 12, 16, 20, 24, and 30 mg L−1) at the optimum pH and at different temperatures (4, 25, and 45 °C). The adsorption capacities for dyes adsorbed onto MG or LI-MGO were determined according the following eqn (1):
 | (1) |
The effect of pH on the adsorption performance was measured over the pH range of 2–10 at 25 °C. The desired pH of the solution was adjusted by adding Britton–Robinson buffer solution.
3 Results and discussion
3.1 Preparation and characterization of LI-MGO
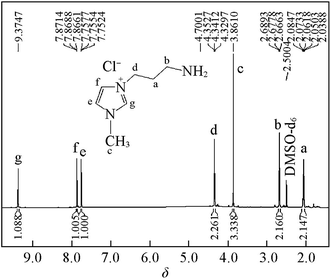
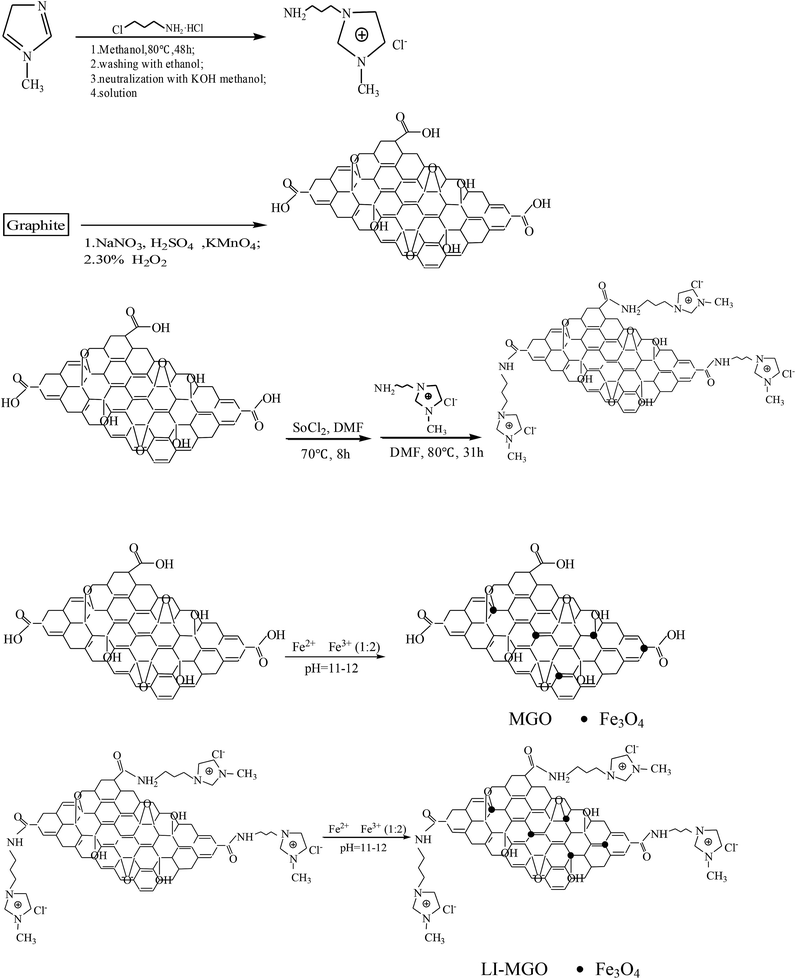
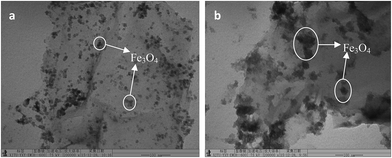
Fig. 2 shows a 1H NMR spectrum of 1-amine-3-methyl imidazole chloride. The H atoms annotated in the chemical structure of 1-amine-3-methyl imidazole chloride can be found in Fig. 2. This shows that 1-amine-3-methyl imidazole chloride was synthesized successfully. The synthesis steps of 1-amine-3-methyl imidazole chloride-functionalized MGO are shown in Fig. 3. The synthesis steps of 1-amine-3-methyl imidazole chloride-functionalized MGO are divided into two stages. Firstly, because the surface of graphene oxide contains a large number of carboxyl groups, the carboxyl groups on the surface of graphene oxide reacted with dichloro-sulfoxide to produce acyl chloride groups, which then reacted with the 1-amino-3-methyl imidazole chloride ionic liquid that was synthesized to produce 1-amine-3-methyl imidazole chloride-functionalized GO. In the second step, Fe3+ and Fe2+ were used as ion sources and 1-amine-3-methyl imidazole chloride-functionalized MGO was synthesized through chemical co-precipitation over the pH range of 11–12.TEM images of MGO and LI-MGO are presented in Fig. 4. The TEM image of MGO shows that the Fe3O4 nanoparticle distribution is uniform and that they have an average particle size of 10 nm (Fig. 4a). Fig. 4b reveals that the Fe3O4 nanoparticles on LI-MGO are larger compared to those on MGO and are present in a layer on the surface of GO. This phenomenon is due to magnetic attraction and the huge nanoparticle surface energy (100 dyn cm−1) of the Fe3O4 nanoparticles, so the Fe3O4 nanoparticles easily undergo particle agglomeration during the coprecipitation process of LI-GO with Fe2+ and Fe3+. After GO was functionalized with 1-amino-3-methyl imidazole chloride ionic liquid, it can be seen clearly that LI-MGO has a much rougher surface than MGO. The TEM images show that LI-MGO was fabricated successfully.
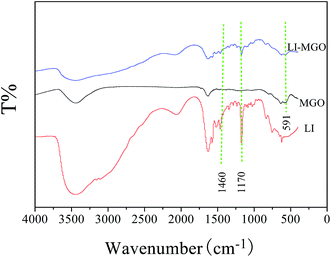
Fig. 5 shows FT-IR spectra of LI, MGO and LI-MGO. The peak shown by MGO and LI-MGO at 3440 cm−1 corresponds to the characteristic peak of the O–H stretching vibration, and the peak at 1690 cm−1 corresponds to C![[double bond, length as m-dash]](https://www.rsc.org/images/entities/char_e001.gif) O stretching vibrations of the –COOH groups. In the FTIR pattern of MGO, a strong adsorption band at 591 cm−1 was observed which was assigned to Fe–O vibrations;43 the characteristic peak from Fe–O vibration was also found in the FTIR pattern of LI-MGO. This revealed that Fe3O4 nanoparticles were effectively decorated on the surface of the GO layers. It is found that absorption bands at 1170 cm−1 and 1460 cm−1 both emerged in the FT-IR spectra of LI-MGO and LI, which were attributed to C–N and C
O stretching vibrations of the –COOH groups. In the FTIR pattern of MGO, a strong adsorption band at 591 cm−1 was observed which was assigned to Fe–O vibrations;43 the characteristic peak from Fe–O vibration was also found in the FTIR pattern of LI-MGO. This revealed that Fe3O4 nanoparticles were effectively decorated on the surface of the GO layers. It is found that absorption bands at 1170 cm−1 and 1460 cm−1 both emerged in the FT-IR spectra of LI-MGO and LI, which were attributed to C–N and C![[double bond, length as m-dash]](https://www.rsc.org/images/entities/char_e001.gif) C stretching vibrations, respectively. This indicated that LI has been added onto the MGO sheets.
C stretching vibrations, respectively. This indicated that LI has been added onto the MGO sheets.
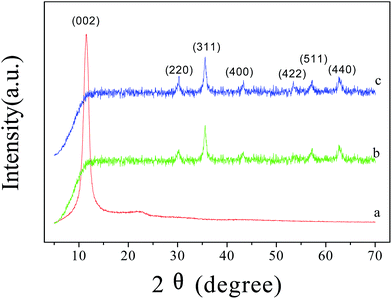
In order to further study the chemical compositions of LI-MGO, GO, MGO and LI-MGO, they were analyzed using XRD as shown in Fig. 6. From Fig. 6a, a strong peak is shown at 11.43° that resulted from the (002) plane of GO, and a weak wide peak is shown at 21.62°, which is due to the presence of abundant oxygen-containing functional groups on GO and is similar to the reported value for graphite oxide.44 As shown in Fig. 6b and c, six characteristic diffraction peaks appear at 2θ values of 30.2°, 35.6°, 43.3°, 53.7°, 57.1° and 62.8° in the XRD patterns of MGO and LI-MGO, which correspond to the (220), (311), (400), (422), (511) and (440) crystal planes of Fe3O4, respectively (JCPDS card: 019-0629). The diffraction peaks from Fe3O4 in the XRD pattern of LI-MGO are stronger than those in the pattern of MGO, but the diffraction peaks from GO were not found in the diffraction patterns of MGO and LI-MGO. The Wang45 group also found the peaks from GO missing, and they attributed this phenomenon to two possible reasons. Firstly, as graphene oxide sheet layer aggregation is reduced due to the presence of magnetite, more single layer graphene oxide appears, so in the diffraction pattern the carbon diffraction peak appears as weak. The second reason is that the strong diffraction peak signals from iron oxide weaken the diffraction signal from carbon.
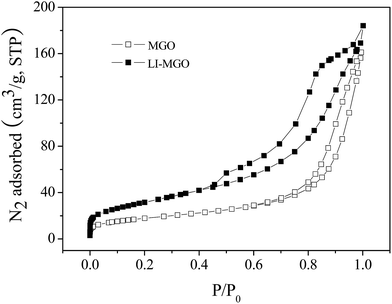
In addition, the specific surface areas of MGO and LI-MGO were examined using N2 physisorption at −196 °C. Representative N2 adsorption/desorption isotherms for such samples are shown in Fig. 7. Obviously, the isotherms for MGO and LI-MGO displayed similar features to a type IV isotherm, according to the IUPAC classification. The BET surface area and BJH cumulative pore volume of MGO were measured to be 64.20 m2 g−1 and 0.2492 cm3 g−1, respectively. The BET surface area and BJH cumulative pore volume of LI-MGO were measured to be 110.3 m2 g−1 and 0.2848 cm3 g−1, respectively. The BET surface area of LI-MGO is larger than MGO due to the surface of LI-MGO being rougher than MGO, after MGO was modified using LI, which is also seen in the TEM images for MGO and LI-MGO (Fig. 4).
3.2 Effect of pH on the adsorption capacity
pH is one of the important factors that affect adsorption performance. The effect of pH on the adsorption capacity for the four dyes is shown in Fig. 8. As illustrated in Fig. 8a, the adsorption capacity for GR on MGO and LI-MGO increases over the pH range from 2.0 to 3.0, while the adsorption capacity for GR on MGO decreases over the pH range from 3.0 to 7.0. However, when the pH is greater than 7.0, the adsorption capacity for GR on MGO increases gradually. The adsorption capacity for GR on LI-MGO decreases over the pH range from 3.0 to 10.0. The adsorption capacities for GR on MGO and LI-MGO both reach maximum values when the pH is 3.0. Fig. 8c shows that the adsorption capacity for OIV on MGO and LI-MGO is relatively lower at a low pH, such as pH 2.0, and the adsorption capacities for OIV on MGO and LI-MGO both reach a maximum at pH 3.0; then the adsorption capacity for OIV on MGO and LI-MGO gradually decreases with an increase in pH. As shown in Fig. 8b and d, the adsorption capacity for AO and CV increases along with an increase in pH. The adsorption capacity for AO reaches a maximum at pH 8.0, while the adsorption capacity for CV reaches a maximum at pH 9.0. Based on the experimental results, the most favorable pH values for GR, OIV, AO and CV adsorption on MGO and LI-MGO are around 3.0, 3.0, 8.0, and 9.0, respectively.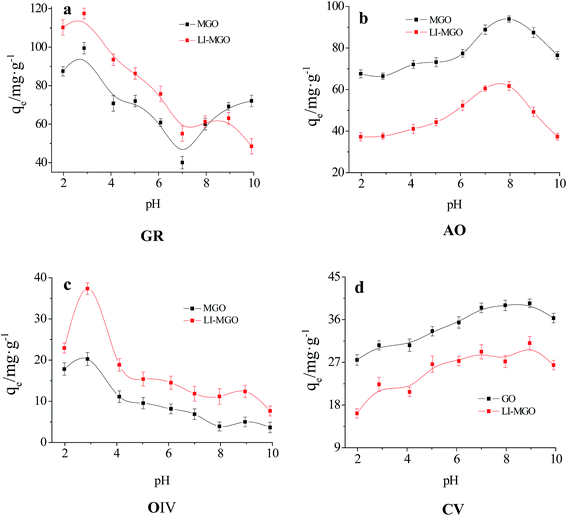 | ||
| Fig. 8 Effect of pH values on the adsorption capacities of MGO and LI-MGO: (a) GR; (b) AO; (c) OIV; and (d) CV. | ||
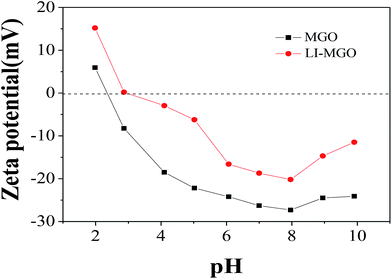
The effect of pH on adsorption capacity is not only related to the surface charge of the adsorbent, but also to the dissociated form of the dye. The zeta potentials of MGO and LI-MGO at different pH values are shown in Fig. 9. The zero potential points (pHpzc) of MGO and LI-MGO are 2.4 and 2.9, respectively (Fig. 9). When the pH < 2.4, the surface of MGO is positively charged, while when the pH > 2.4, the surface of MGO is negatively charged. When the pH < 2.9, the surface of LI-MGO is positively charged, while when the pH > 2.9, the surface of LI-MGO is negatively charged. The four dyes include two anionic dyes, GR and OIV, and two cationic dyes, AO and CV. GR and OIV can exist as anions when the pH > pKa; the negative charge on the surface of MGO and LI-MGO at around pH 3.0 is lower and close to zero, so the electrostatic interaction between GR and OIV and MGO and LI-MGO is strongest, and the adsorption capacity is maximal. AO and CV can existed as cations when the pH > pKa, and the negative charge on the surface of MGO and LI-MGO at around pH 8.0 is greatest. So the electrostatic interaction between AO and CV and MGO and LI-MGO is strongest, and the adsorption capacity reaches the maximum. In addition, the surface negative charge of MGO is stronger than LI-MGO at different pH values (Fig. 9). This also can explain why the adsorption capacity for anionic dyes on LI-MGO is greater than on MGO and why the adsorption capacity for cationic dyes on MGO is greater than on LI-MGO.
3.3 Adsorption kinetics
Fig. 10 describes the adsorption capacity for four dyes on LI-MGO versus time at 277 K, 298 K and 318 K. The four dyes are adsorbed rapidly over the first 100 min, and thereafter they proceed at a slow rate and finally achieve equilibrium at 300 min. The adsorption capacity at equilibrium for the four dyes on LI-MGO increases as the temperature increases.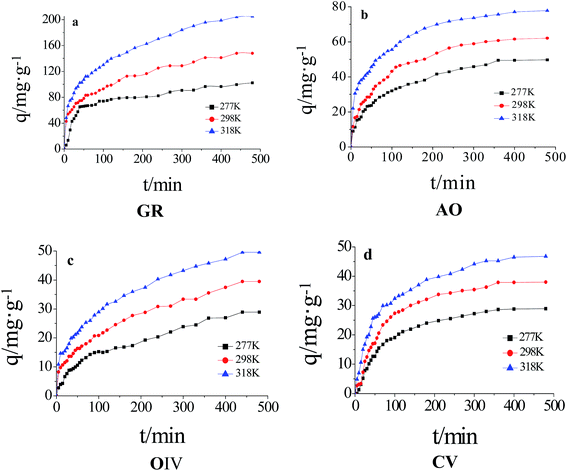 | ||
| Fig. 10 Kinetics of dye adsorption on LI-MGO at 277 K, 298 K and 318 K: (a) GR; (b) AO; (c) OIV; (d) CV. | ||
In order to study the mechanism of adsorption, the kinetic data were fitted using a pseudo-first-order kinetic model,46 pseudo-second-order kinetic model47 and intraparticle diffusion model;48 the three models are expressed using the following equations:
 | (2) |
 | (3) |
| qt = kintt1/2 | (4) |
k1 and qe were obtained from the slope and intercept of log(qe − qt) versus t, k2 and qe were obtained from the slope and intercept of t/qt versus t, and kint can be calculated from the slope of qt versus t0.5.
The kinetic parameters obtained from the pseudo-first-order equation, pseudo-second-order equation and intraparticle diffusion equation are listed in Table 1. The R2 values and the large discrepancy between the experimental and calculated qe indicates that the adsorption of the four dyes does not follow the pseudo first-order kinetic model or intraparticle diffusion model. As a result, the adsorption of the four dyes onto LI-MGO is in accordance with the pseudo second-order kinetic model, in which the adsorption process is the rate-limiting step, involving the surface.
| Dye | T/K | qeqex/mg g−1 | Pseudo-first-order kinetics model | Pseudo-second-order kinetics model | Intraparticle diffusion model | |||||
|---|---|---|---|---|---|---|---|---|---|---|
| k1 (×10 min−1) | qe/mg g−1 | R2 | k2 (×102 g mg−1 min−1) | qe/mg g−1 | R2 | kint (mg g−1 min−1/2) | R2 | |||
| GR | 277 | 102.2 | 0.0709 | 65.31 | 0.763 | 0.02138 | 106.4 | 0.988 | 3.960 | 0.806 |
| 298 | 147.8 | 0.0613 | 100.23 | 0.929 | 0.01320 | 156.3 | 0.986 | 5.647 | 0.952 | |
| 318 | 204.9 | 0.0627 | 143.22 | 0.936 | 0.00897 | 217.9 | 0.986 | 8.159 | 0.958 | |
| 277 | 28.90 | 0.0497 | 24.39 | 0.909 | 0.02790 | 33.3 | 0.962 | 1.318 | 0.987 | |
| OIV | 298 | 39.46 | 0.0557 | 31.94 | 0.967 | 0.02824 | 43.47 | 0.969 | 1.694 | 0.991 |
| 318 | 49.59 | 0.0617 | 38.84 | 0.963 | 0.02547 | 55.56 | 0.980 | 2.111 | 0.983 | |
| 277 | 49.74 | 0.0778 | 39.40 | 0.957 | 0.03157 | 54.44 | 0.987 | 2.741 | 0.978 | |
| AO | 298 | 62.08 | 0.0937 | 50.45 | 0.974 | 0.02720 | 68.63 | 0.992 | 3.763 | 0.979 |
| 318 | 77.81 | 0.0942 | 54.14 | 0.953 | 0.03449 | 81.97 | 0.994 | 4.196 | 0.945 | |
| 277 | 28.84 | 0.0814 | 26.01 | 0.986 | 0.03523 | 34.78 | 0.998 | 2.789 | 0.989 | |
| CV | 298 | 37.88 | 0.0947 | 32.70 | 0.978 | 0.03147 | 44.68 | 0.997 | 3.616 | 0.976 |
| 318 | 46.46 | 0.0859 | 36.10 | 0.972 | 0.03419 | 51.89 | 0.996 | 3.894 | 0.967 | |
3.4 Adsorption isotherms
The adsorption isotherms for OIV, GR, AO and CV on LI-MGO at 277 K, 298 K and 318 K are shown in Fig. 11. The adsorption capacity of LI-MGO reaches a maximum with an increase in initial dye concentration, as shown in Fig. 11.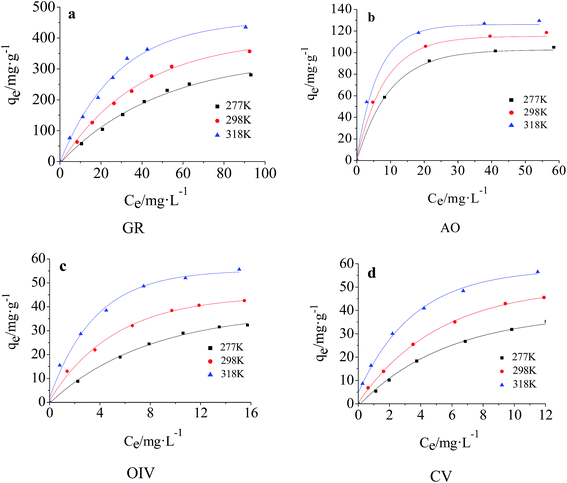 | ||
| Fig. 11 Adsorption isotherms for dye adsorption on LI-MGO at 277 K, 298 K and 318 K: (a) GR; (b) AO; (c) OIV; (d) CV. | ||
The study of adsorption equilibrium can be a good assessment of adsorption capacity. The adsorption data for the dyes on LI-MGO were fitted using two classical adsorption models – the Langmuir and Freundlich models. The Langmuir equation and Freundlich equation can be expressed in linear form using eqn (5) and (6), respectively.
 | (5) |
 | (6) |
As shown in Table 2, the R value from the Langmuir model is much larger than that from the Freundlich isotherm, and the adsorption capacity calculated from the Langmuir isotherm is closer to the experimental qe. Hence, the Langmuir model is more appropriate than the Freundlich model for describing the adsorption behavior of OIV, GR, AO and CV onto LI-MGO. This implies monolayer coverage of OIV, GR, AO and CV on LI-MGO and also a homogeneous distribution of active sites on the adsorbent, as the Langmuir equation assumes that the surface is homogeneous.
| Dye | T/K | Langmuir equation | Freundlich equation | ||||
|---|---|---|---|---|---|---|---|
| qm/mg g−1 | KL/L mg−1 | R | KF/mg g−1 | n | R | ||
| GR | 277 | 578.03 | 0.01137 | 0.9778 | 9.9136 | 1.2835 | 0.9709 |
| 298 | 588.24 | 0.01809 | 0.9907 | 15.541 | 1.3600 | 0.9792 | |
| 318 | 606.06 | 0.03080 | 0.9921 | 33.204 | 1.6273 | 0.9713 | |
| 277 | 55.52 | 0.09538 | 0.9934 | 5.3265 | 1.4269 | 0.9902 | |
| OIV | 298 | 57.37 | 0.1947 | 0.9969 | 11.385 | 1.9495 | 0.9925 |
| 318 | 65.65 | 0.3446 | 0.9988 | 19.136 | 2.5103 | 0.9697 | |
| 277 | 119.33 | 0.1328 | 0.9990 | 33.059 | 3.3436 | 0.9547 | |
| AO | 298 | 132.80 | 0.1615 | 0.9994 | 34.103 | 3.0276 | 0.9646 |
| 318 | 140.06 | 0.2449 | 0.9997 | 41.006 | 3.2066 | 0.9653 | |
| 277 | 65.96 | 0.09632 | 0.9958 | 6.2395 | 1.3786 | 0.9942 | |
| CV | 298 | 69.44 | 0.1642 | 0.9983 | 9.9234 | 1.5185 | 0.9938 |
| 318 | 70.03 | 0.3485 | 0.9994 | 18.001 | 1.9319 | 0.9928 | |
3.5 Adsorption thermodynamics
Thermodynamic parameter changes, such as in the standard free energy (ΔG°/kJ mol−1), enthalpy (ΔH°/kJ mol−1) and entropy (ΔS°/J mol−1 K−1), were calculated using the following equations:
ΔG° = −RT![[thin space (1/6-em)]](https://www.rsc.org/images/entities/char_2009.gif) ln ln![[thin space (1/6-em)]](https://www.rsc.org/images/entities/char_2009.gif) KC KC
| (7) |
| ΔH° = ΔG° + TΔS° | (8) |
 | (9) |
ΔH° and ΔS° were calculated from the slope and intercept of a linear plot of ln![[thin space (1/6-em)]](https://www.rsc.org/images/entities/char_2009.gif) KC versus 1/T (Fig. S3, ESI†). The values of ΔG°, ΔH° and ΔS° are listed in Table 3. The negative values of ΔG° indicate that adsorption is spontaneous at the studied temperatures. The positive values of ΔH° and ΔS° for the adsorption of the four dyes onto LI-MGO indicate that the adsorption process is endothermic and random, respectively. This also explains why the adsorption capacity at equilibrium for the four dyes on LI-MGO increases as the temperature increases.
KC versus 1/T (Fig. S3, ESI†). The values of ΔG°, ΔH° and ΔS° are listed in Table 3. The negative values of ΔG° indicate that adsorption is spontaneous at the studied temperatures. The positive values of ΔH° and ΔS° for the adsorption of the four dyes onto LI-MGO indicate that the adsorption process is endothermic and random, respectively. This also explains why the adsorption capacity at equilibrium for the four dyes on LI-MGO increases as the temperature increases.
| Dye | T/K | ΔG (kJ mol−1) | ΔH (kJ mol−1) | ΔS (J mol−1 K−1) |
|---|---|---|---|---|
| GR | 277 | −3.685 | 17.12 | 74.98 |
| 298 | −5.148 | |||
| 318 | −6.771 | |||
| 277 | −3.354 | |||
| OIV | 298 | −4.078 | 7.287 | 38.33 |
| 318 | −4.935 | |||
| 277 | −1.959 | |||
| AO | 298 | −3.046 | 12.88 | 53.52 |
| 318 | −4.157 | |||
| 277 | −2.469 | |||
| CV | 298 | −3.323 | 0.9550 | 42.34 |
| 318 | −4.209 |
3.6 Adsorption capacity comparison
A comparison of adsorbents from similar anionic dye studies reported in the literature is displayed in Table 4. The maximum adsorption capacity of glenn black R on LI-MGO is greater compared to other anionic dyes on absorbents reported in the literature. LI-MGO has superior adsorption efficiency for anionic dyes, which may be ascribed to the surface of MGO having increased positive charge after 1-amine-3-methyl imidazole chloride functionalization.| Adsorbent | Anionic dye | Maximum adsorption capacity (mg g−1) | Reference |
|---|---|---|---|
| Fe3O4@nSiO2@mSiO2@DHIM-NH2 | Orange II | 142.49 | 49 |
| NMC-3-800 | Amaranth | 79.84 | 50 |
| Methyl orange | 202.4 | ||
| GG-g-poly(DMAEMA) gels | Methyl orange | 25.8 | 51 |
| CTAB-modified pumice | Congo red | 27.32 | 52 |
| HCPZA | Eriochrome black T | 15.9 | 53 |
| Fe3O4@GPTMS@P-Lys | Orange I | 104.36 | 54 |
| Amaranth | 84.04 | ||
| Acid red 18 | 134.69 | ||
| PbO-NP-AC | Methyl orange | 333.33 | 55 |
| CMOPP | Congo red | 163 | 56 |
| Amine/Fe3O4-resin | Methyl orange | 101.0 | 57 |
| Reactive brilliant red K-2BP | 222.2 | ||
| Acid red 18 | 99.4 | ||
| Fe3O4/MIL-101(Cr) | Acid red 1 | 142.9 | 58 |
| Orange G | 200.0 | ||
| LI-MGO | glenn black R | 588.24 | This work |
| orange IV | 57.37 |
4 Conclusions
In summary, a novel LI-MGO adsorbent functionalized with 1-amine-3-methyl imidazole chloride ionic liquid was successfully prepared through a facile chemical co-precipitation and chemical modification method. LI-MGO exhibited a higher surface area than MGO. In order to research the adsorption properties of LI-MGO, two kinds of anionic dyes, OIV and GR, and two kinds of cationic dyes, AO and CV, were investigated as model dyes. LI-MGO showed remarkably higher adsorption capacities for the anionic dyes compared with MGO and referenced materials, due to LI-MGO being a surface cationic modified material and electrostatic interactions between LI-MGO and the anionic dyes. In addition, the advantages of its rapid separation from water and low cost give LI-MGO a good chance to be applied in the removal of anionic dyes from wastewater.Conflict of interest
The authors declare there is no conflict of interest.Acknowledgements
This work was supported by the Nation Natural Science Foundation of China (No. 21475104).References
- K. R. Ramakrishna and T. Viraraghavan, Water Sci. Technol., 1997, 36, 189–196 CrossRef CAS.
- N. R. Khalid, E. Ahmed, Z. Hong, L. Sana and M. Ahmed, Curr. Appl. Phys, 2013, 13, 659–663 CrossRef.
- D. Stergiopoulos, K. Dermentzis, P. Giannakoudakis and S. Sotiropoulos, Global NEST J., 2014, 16, 499–506 Search PubMed.
- M. F. Abid, M. A. Zablouk and A. M. Abidalameer, Iran. J. Environ. Health Sci. Eng., 2012, 9, 17–25 CrossRef PubMed.
- M. Wawrzkiewicz, Chem. Eng. J., 2013, 217, 414–425 CrossRef CAS.
- T. Ma, P. R. Chang, P. Zheng, F. Zhao and X. Ma, Chem. Eng. J., 2014, 240, 595–600 CrossRef CAS.
- N. Öztürk and T. E. Bektas, Fresenius Environ. Bull., 2006, 15, 489–496 Search PubMed.
- W. Hajjaji, R. C. Pullar, J. A. Labrincha and F. Rocha, Appl. Clay Sci., 2016, 126, 197–206 CrossRef CAS.
- S. Yang, L. Wang, X. Zhang, W. Yang and G. Song, Chem. Eng. J., 2015, 275, 315–321 CrossRef CAS.
- L. Gao, Q. Li, X. Hu, X. Wang, H. Song, L. Yan and H. Xiao, Appl. Clay Sci., 2016, 126, 299–305 CrossRef CAS.
- Y. Yu, B. N. Murthy, J. G. Shapter, K. T. Constantopoulos, N. H. Voelcker and A. V. Ellis, J. Hazard. Mater., 2013, 260, 330–338 CrossRef CAS PubMed.
- H. Gao, Y. Sun, J. Zhou, R. Xu and H. Duan, ACS Appl. Mater. Interfaces, 2013, 5, 425–432 CAS.
- M. S. Mauter and M. Elimelech, Environ. Sci. Technol., 2008, 42, 5843–5859 CrossRef CAS PubMed.
- J. Liu, W. Liu, Y. Wang, M. Xu and B. Wang, Appl. Surf. Sci., 2016, 367, 327–334 CrossRef CAS.
- D. Robati, B. Mirza, M. Rajabi, O. Moradi, I. Tyagi, S. Agarwal and V. K. Gupta, Chem. Eng. J., 2016, 284, 687–697 CrossRef CAS.
- D. Wang, L. Liu, X. Jiang, J. Yu, X. Chen and X. Chen, Appl. Surf. Sci., 2015, 329, 197–205 CrossRef CAS.
- S. T. Yang, S. Chen, Y. Chang, A. Cao, Y. Liu and H. Wang, J. Colloid Interface Sci., 2011, 359, 24–29 CrossRef CAS PubMed.
- G. Xie, P. Xi, H. Liu, F. Chen, L. Huang and Y. Shi, et al., J. Mater. Chem., 2012, 22, 1033–1039 RSC.
- V. K. Sharma, T. J. Mcdonald, H. Kim and V. K. Garg, Adv. Colloid Interface Sci., 2015, 225, 229–240 CrossRef CAS PubMed.
- O. Moradi, V. K. Gupta, S. Agarwal, I. Tyagi and M. Asif, et al., J. Ind. Eng. Chem., 2015, 28, 294–301 CrossRef CAS.
- J. Liu, G. Liu and W. Liu, Chem. Eng. J., 2014, 257, 299–308 CrossRef CAS.
- D. Wang, L. Liu, X. Jiang, J. Yu and X. Chen, Colloids Surf., A, 2015, 466, 166–173 CrossRef CAS.
- R. Rajesh, S. S. Iyer, J. Ezhilan, S. S. Kumar and R. Venkatesan, Spectrochim. Acta, Part A, 2016, 166, 49–55 CrossRef CAS PubMed.
- H. Wang, H. Gao, M. Chen, X. Xu and X. Wang, et al., Appl. Surf. Sci., 2016, 360, 840–848 CrossRef CAS.
- D. Chen, H. Zhang, K. Yang and H. Wang, J. Hazard. Mater., 2016, 310, 179–187 CrossRef CAS PubMed.
- P. N. Diagboya, B. I. Olu-Owolabi, D. Zhou and B. H. Han, Carbon, 2014, 79, 174–182 CrossRef CAS.
- G. K. Ramesha, A. V. Kumara, H. B. Muralidhara and S. Sampath, J. Colloid Interface Sci., 2011, 361, 270–277 CrossRef CAS PubMed.
- T. Zhou, W. Lu, L. Liu, H. Zhu, Y. Jiao, S. Zhang and R. Han, J. Mol. Liq., 2015, 211, 909–914 CrossRef CAS.
- C. Namasivayam and M. V. Sureshkumar, J. Appl. Polym. Sci., 2006, 100, 1538–1546 CrossRef CAS.
- Y. Su, B. Zhao, W. Xiao and R. Han, Environ. Sci. Pollut. Res., 2013, 20, 5558–5568 CrossRef CAS PubMed.
- V. S. Munagapati and D. S. Kim, J. Mol. Liq., 2016, 220, 540–548 CrossRef CAS.
- K. Li, P. Li, J. Cai, S. Xiao, H. Yang and A. Li, Chemosphere, 2016, 154, 310–318 CrossRef CAS PubMed.
- M. Armand, F. Endres, D. R. Macfarlane, H. Ohno and B. Scrosati, Nat. Mater., 2009, 8, 621–629 CrossRef CAS PubMed.
- N. V. Plechkova and K. R. Seddon, Chem. Soc. Rev., 2008, 37, 123–150 RSC.
- U. Domańska, P. Okuniewska and M. Królikowski, Fluid Phase Equilib., 2016, 423, 109–119 CrossRef.
- B. Lam, M. Wei, L. Zhu, S. J. Luo and R. Guo, et al., Polymer, 2016, 89, 1–11 CrossRef CAS.
- K. Moodley, M. Mabaso, I. Bahadur and G. G. Redhi, J. Mol. Liq., 2016, 219, 206–210 CrossRef CAS.
- B. Lin, H. Shang, F. Chu, Y. Ren, N. Yuan and B. Jia, et al., Electrochim. Acta, 2014, 134, 209–214 CrossRef CAS.
- Q. Zhou, F. Chen, W. Wu, R. Bu, W. Li and F. Yang, Chem. Eng. J., 2016, 285, 198–206 CrossRef CAS.
- W. Song, Y. Liu, L. Qian, L. Niu and L. Xiao, et al., Chem. Eng. J., 2016, 287, 482–491 CrossRef CAS.
- L. X. Gao and J. Yu, Chem. J. Chin. Univ., 2013, 34, 108–114 CAS.
- L. Sun, H. Yu and B. Fugetsu, J. Hazard. Mater., 2012, 203–204, 101–110 CrossRef CAS PubMed.
- F. Bianchi, V. Chiesi, F. Casoli, P. Luches, L. Nasi, M. Careri and A. Mangia, J. Chromatogr. A, 2012, 1231, 8–15 CrossRef CAS PubMed.
- P. Bradder, S. K. Ling, S. Wang and S. Liu, J. Chem. Eng. Data, 2011, 56, 138–141 CrossRef CAS.
- X. Yang, C. Chen, J. Li, G. Zhao, X. Ren and X. Wang, RSC Adv., 2012, 2, 8821–8826 RSC.
- A. Aluigi, F. Rombaldoni, C. Tonetti and L. Jannoke, J. Hazard. Mater., 2014, 268, 156–165 CrossRef CAS PubMed.
- Z. Chen, J. Zhang, J. Fu, M. Wang, X. Wang, R. Han and Q. Xu, J. Hazard. Mater., 2014, 273, 263–271 CrossRef CAS PubMed.
- S. Wan, F. He, J. Wu, W. Wan, Y. Gu and B. Gao, J. Hazard. Mater., 2016, 314, 32–40 CrossRef CAS PubMed.
- J. Cheng, L. Shi and J. Lu, J. Ind. Eng. Chem., 2016, 36, 206–214 CrossRef CAS.
- H. Li, N. An, G. Liu, J. Li, N. Liu and M. Jia, et al., J. Colloid Interface Sci., 2016, 466, 343–351 CrossRef CAS PubMed.
- J. S. Karthika and B. Vishalakshi, Int. J. Biol. Macromol., 2015, 81, 648–655 CrossRef CAS PubMed.
- H. Shayesteh, A. Rahbar-Kelishami and R. Norouzbeigi, J. Mol. Liq., 2016, 221, 1–11 CrossRef CAS.
- T. A. Saleh, A. M. Muhammad and S. A. Ali, J. Colloid Interface Sci., 2016, 468, 324–333 CrossRef CAS PubMed.
- Y. R. Zhang, P. Su, J. Huang, Q. R. Wang and B. X. Zhao, Chem. Eng. J., 2015, 262, 313–318 CrossRef CAS.
- M. Ghaedia, A. M. Ghaedi, B. Mirtamizdoust, S. Agarwal and V. K. Gupta, J. Mol. Liq., 2016, 213, 48–57 CrossRef.
- V. S. Munagapati and D. S. Kim, J. Mol. Liq., 2016, 220, 540–548 CrossRef CAS.
- W. Song, B. Gao, X. Xu, L. Xing and S. Han, et al., Bioresour. Technol., 2016, 210, 123–130 CrossRef CAS PubMed.
- T. Wang, P. Zhao, N. Lu and H. Chen, et al., Chem. Eng. J., 2016, 295, 403–413 CrossRef CAS.
Footnote |
| † Electronic supplementary information (ESI) available. See DOI: 10.1039/c6ra27530c |
| This journal is © The Royal Society of Chemistry 2017 |

