 Open Access Article
Creative Commons Attribution 3.0 Unported Licence
Simultaneous fluorescence analysis of the different carbohydrates expressed on living cell surfaces using functionalized quantum dots†
Dongxiu He‡
 *ab,
Danxia Wang‡a,
Xiaoxin Shi‡b,
Wenjie Quanb,
Runde Xiongb,
Cui-yun Yuab and
Honglin Huanga
aInstitute of Pharmacy & Pharmacology, University of South China, Hengyang, Hunan, China. E-mail: 1025165380@qq.com
bHunan Province Cooperative Innovation Center for Molecular Target New Drug Study, Hengyang, Hunan, China
First published on 21st February 2017
Abstract
The aberrant expression of carbohydrates has been associated with the occurrence, growth, progression and metastasis of tumors. Tumor-associated carbohydrates may have great potential as tumor markers for the early diagnosis of hepatocellular carcinoma (HCC). Therefore, characterizing HCC-associated carbohydrate expression is of great importance to assist the early diagnosis of HCC. A fluorescence method for characterizing carbohydrates expressed on both normal human cells (LO2 cells and endothelial cells) and HCC cells (HepG2 cells) using functionalized quantum dots (QDs) has been proposed in this study. The QDs were successfully fabricated and covalently conjugated with Datura stramonium agglutinin (DSA) or Lens culinaris agglutinin (LCA) via 1-ethyl-3-(3-dimethylaminopropyl) carbodiimide hydrochloride (EDC) coupling reaction. The formed functionalized QDs (lectin–QDs conjugates) were characterized using ultraviolet and fluorescence spectra, agarose gel electrophoresis, hemagglutination activity tests, lectin competitive-binding assay and carbohydrate inhibition assays. The functionalized QDs were found to retain stable fluorescence and carbohydrate recognition abilities. Significant differences of carbohydrates expressed between on the normal cells and the HepG2 cells were evaluated by fluorescence imaging and flow cytometric analysis. The experimental results illustrate that the functionalized QDs could be used as promising tools for monitoring in situ cell surface carbohydrate expression and evaluating the differences in the carbohydrates expressed on normal cells and tumor cells surfaces, which is very important for helping the early diagnosis of HCC.
Introduction
Carbohydrates are known to be involved in numerous biological events, including cell adhesion, fertilization, differentiation, immune responses, host–pathogen interactions, cellular communications, and tumor cell metastasis.1,2 A large corpus of evidence indicates that the aberrant expression of carbohydrates on cell surfaces has been associated with the occurrence, growth, progression and metastasis of many tumors.3–5 Tumor-associated carbohydrates have great potential as a source of tumor markers for the early diagnosis of cancer.6,7 Hepatocellular carcinoma (HCC) was ranked as the fifth most common and one of the deadliest human malignancies in the world.8 The success of treatment for HCC largely depends on the stage at which it is diagnosed.9 Imaging and measurement of biomarkers are considered valuable approaches for the early diagnosis of HCC. The sugar residues of glycoconjugates such as alpha-fetoprotein,10 transferrin,11 and Apo-J12 have been shown to become altered with consequent malignant transformation of the glycoconjugate-producing cells and tissues in HCC. Cancer-associated carbohydrates may act as potential biomarkers for early detection of HCC.13 Characterizing cancer-associated carbohydrates expressed on cell surfaces is critical both to understanding its role in the development of HCC and to diagnosing the HCC.In recent years, considerable efforts have been directed toward developing methods to identify and quantify carbohydrates. Several methodologies including cell sensing technology,14 optical imaging techniques,5 histochemical approaches, and mass spectrometry15,16 have been employed towards probing the type and structure of the carbohydrates. Mass spectrometry has emerged as a powerful technique for profiling carbohydrates, because of recent increases in measurement sensitivity and precision. However, mass spectrograph only detects carbohydrate in lysed cells, which could lead to carbohydrate loss. Additionally, the interpretation of spectral data is still a major bottleneck for carbohydrate analysis. In comparison with nucleic acids and proteins, carbohydrates possess certain unique properties that render their analysis difficult.2 The structural diversity and complexity of the sugar residues expressed on the cell surface have necessitated the development of novel methodologies to study them. Although histochemical approaches are powerful, they do have some shortcomings. The methods commonly used for cell and tissue fixation can render carbohydrates on glycoproteins and glycolipids inaccessible, because of protein denaturation or carbohydrate loss during the process. In addition, the overall process of the histochemical approaches is fairly lengthy and expensive because of multiple steps and expensive reagents. Therefore, it is very important to continue to develop facile, convenient and specific methods to characterize cell surfaces carbohydrates for the elucidation of differences in carbohydrate expression on normal cells and tumor cells. These techniques will aid in understanding the role of carbohydrate alterations in the formation and metastasis of malignant tumors, and contribute to the development of new methods for the diagnosis of cancer.
Recently, fluorescent probes have been considered a valuable detection method because of their ability to provide detailed and sensitive illumination in terms of cell structure and molecular content.17 In the past few decades, most studies have focused on traditional fluorescent probes such as organic dyes.18 Nevertheless, these organic-dye-based sensing platforms have restricted sensitivity due to the deficiency of dyes such as narrow excitation bands, broad emission bands with red spectral tails, poor resistance to photobleaching, and impossible simultaneous evaluation of several light-emitting fluorescent probes as a result of spectral overlap. Quantum dots (QDs) are emerging as a new tool for molecular fluorescent probes because of their unique advantages over traditional fluorescent dyes and fluorescent proteins, including their broad excitation spectra, narrow and symmetric photoluminescence bands, superior photostability and chemical stability, and versatility in surface modification.19 The broad absorption band of QDs allows QDs with different fluorescence emission wavelengths to be excited with a single excitation light, resulting in several emissions of different colors that may be detected simultaneously.20 Moreover, the photostability of QDs makes long-term tracking of biological molecules possible.21 The straight forward separation of excitation and emission of the QDs allow the fluorescence signal to be distinguished from cellular autofluorescence, thereby enhancing the specificity of the probe. Based on these promising properties, QDs combined with specific recognition molecules, represent a promising and attractive luminescent probe system for biomedical applications in detection and imaging22–25 and clinic diagnosis.26
Molecules capable of carbohydrate recognition such as lectins,17,27 antibodies,1 aptamers,28 nucleic acids1,29 and boric acid1,30 have been reported. The antibodies are generally directed towards terminal carbohydrate structures. In contrast, lectins can detect changes in the carbohydrate core structures. Lectin can recognize and bind to specific carbohydrate structural epitopes. For example, DSA can bind to N-acetylgalactosamine (GalNAc) and (β-1,4) triantennary N-linked glycans12 and LCA may recognize N-acetylglucosamine (GlcNAc) and mannose (Man).1 Moreover, lectins tagged with a fluorophore or enzyme can be used to stain tissue sections to provide information on the distribution and kind of carbohydrates within the sample. Therefore, lectins have great potential as carbohydrate research tools31 and imaging agents.32
Tumor biomarkers are useful for the early diagnosis of HCC.33 However, a single HCC biomarker lacks sufficient sensitivity and specificity.34 The level of DSA-reactive Apo-J allowed researchers to differentiate HCC from cirrhosis.12 Additionally, the LCA-reactive fraction of alpha-fetoprotein (AFP-L3) is only produced by malignant liver cells, binds to LCA with high affinity, and is the major glycoform found in individuals with HCC.34 Characterizing the DSA-binding carbohydrates and LCA-binding carbohydrate may be a useful approach for aiding in the early diagnosis of HCC.
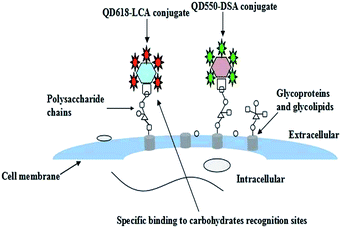
In this context, a simple and efficient fluorescence method was developed to characterize in situ cell surface HCC-associated carbohydrate expression using functionalized quantum dots. First, we synthesized carboxyl-terminated QDs of different emission wavelengths. Then the fabrication and characterization of two functionalized QDs (QDs–DSA conjugate, QDs–LCA conjugate) was carefully studied. The functionalized QDs were applied to detect HCC-associated carbohydrates expressed on the cell surface (as illustrated in Scheme 1).
Materials and methods
Reagents and materials
Cadmium perchlorate (CdCl2·2.5H2O), sodium borohydride (NaBH4) and tellurium (Te) were provided by Sinopharm Chemical Reagent Co, Ltd (Beijing, China). 1-Ethyl-3-(3-dimethylaminopropyl) carbodiimide hydrochloride (EDC), LCA, DSA, dimethyl sulfoxide (DMSO) and thioglycolic acid (TGA) were supplied from Sigma-Aldrich (St Louis, MO, USA). Dulbecco's Modified Eagle's Medium (DMEM), penicillin, streptomycin and fetal bovine serum (FBS) were obtained from Gibco (Grand Island, NY, USA). All other reagents were of analytical grade and used as received. Deionized water from a Milli-Q device (18.2 MΩ; Millipore, Molsheim, France) was used throughout this study. Endothelial cells (ECs), LO2, and HepG2 cell lines were obtained from the Shanghai cell bank of Chinese Academy of Science (Shanghai, China).Synthesis and characterization of QDs
Water-soluble CdTe QDs were synthesized using a two-step method with slight modification.35 TGA was used as a stabilizing and functionalizing agent. First, 0.1221 g of Te and 0.7620 g of NaBH4 (molar ratio of Te to NaBH4 was 1![[thin space (1/6-em)]](https://www.rsc.org/images/entities/char_2009.gif) :
:![[thin space (1/6-em)]](https://www.rsc.org/images/entities/char_2009.gif) 20) were added to 8 mL of O2-free ethanol-water (volume ratio of water to ethanol was 1
20) were added to 8 mL of O2-free ethanol-water (volume ratio of water to ethanol was 1![[thin space (1/6-em)]](https://www.rsc.org/images/entities/char_2009.gif) :
:![[thin space (1/6-em)]](https://www.rsc.org/images/entities/char_2009.gif) 3) in a flask for 2 h to prepare the NaHTe solution. Then, the mixture solution (0.4574 g CdCl2·2.5H2O and 340 μL of TGA were dissolved in 100 mL of deionized water, followed by adjustment of the pH by dropwise addition of 1 M solution of NaOH to 10.5. The mentioned pH values were experimentally found to be optimal for the synthesis of stable colloids) was placed in a three-necked flask fitted with a septum and valves, and it was degassed by nitrogen gas bubbling for 30 min. Subsequently, the freshly prepared NaHTe solution was quickly injected into the above mixture solution with vigorous stirring, followed by refluxing at a constant temperature of 98 °C under a nitrogen-saturated atmosphere. The CdTe QDs precursors with different fluorescence emission wavelengths can be obtained by varying the reflux time from 10 min to 10 h. To improve the photoluminescence properties of the CdTe QDs (enhancement of the band-edge and suppression of the trap-emission), the CdTe QDs precursors were irradiated with the “white light” of a 100 W xenon lamp (the intensity of the light was approximately 200 mW cm−2) for 1 h. The prepared QDs were precipitated using isopropanol and purified via centrifugation at 10
3) in a flask for 2 h to prepare the NaHTe solution. Then, the mixture solution (0.4574 g CdCl2·2.5H2O and 340 μL of TGA were dissolved in 100 mL of deionized water, followed by adjustment of the pH by dropwise addition of 1 M solution of NaOH to 10.5. The mentioned pH values were experimentally found to be optimal for the synthesis of stable colloids) was placed in a three-necked flask fitted with a septum and valves, and it was degassed by nitrogen gas bubbling for 30 min. Subsequently, the freshly prepared NaHTe solution was quickly injected into the above mixture solution with vigorous stirring, followed by refluxing at a constant temperature of 98 °C under a nitrogen-saturated atmosphere. The CdTe QDs precursors with different fluorescence emission wavelengths can be obtained by varying the reflux time from 10 min to 10 h. To improve the photoluminescence properties of the CdTe QDs (enhancement of the band-edge and suppression of the trap-emission), the CdTe QDs precursors were irradiated with the “white light” of a 100 W xenon lamp (the intensity of the light was approximately 200 mW cm−2) for 1 h. The prepared QDs were precipitated using isopropanol and purified via centrifugation at 10![[thin space (1/6-em)]](https://www.rsc.org/images/entities/char_2009.gif) 000 rpm for 5 min. The collected samples of QDs were stored in the dark at 4 °C.
000 rpm for 5 min. The collected samples of QDs were stored in the dark at 4 °C.
The characterization of QDs including optical properties, transmission electron microscopy (TEM), Fourier transform infrared spectroscopy (FT-IR) chemical analysis and cytotoxicity is very important for the conjugation and bioapplication of QDs. The optical properties, TEM, FT-IR analysis and cytotoxicity of QDs have been investigated carefully. The UV-vis absorption spectra of the QDs and functionalized QDs were characterized by a Shimadzu UV-1750 spectrophotometer (Shimadzu Corporation, Japan) and fluorescence spectra were measured using an F-7000 fluorescence spectrophotometer (Shimadzu Instruments Corporation, Japan). Experimentally, the quantum yield (QY) of the QDs can be estimated following the procedure of ref. 34 at room temperature comparing the fluorescence of both the test sample and a dye of a known QY (rhodamine 6G in water as a standard, the reference QY was 0.95).36 The chemical characterization of the QDs was carried out using a Perkin-Elmer FT-IR spectrometer (Perkin Elmer Co., UK). The spectra were recorded after eight scans by correcting the background. The surface morphology of the QDs was examined using JEM 2100 transmission electron microscopy running a LaB6 (lanthanum hexaboride crystal) emitter at 200 kV (S-3400N, Hitachi, Tokyo, Japan).
Fabrication and characterization of functionalized QDs
The purified carboxyl-terminated QDs (QD550 or QD618, 160 pM) were activated in the presence of 160 nM EDC for 30 min. The resulting activated QDs were covalently linked to the lectin (QD550: DSA molar ratio in the reaction was 1![[thin space (1/6-em)]](https://www.rsc.org/images/entities/char_2009.gif) :
:![[thin space (1/6-em)]](https://www.rsc.org/images/entities/char_2009.gif) 5, QD618: LCA molar ratio in the reaction was 1
5, QD618: LCA molar ratio in the reaction was 1![[thin space (1/6-em)]](https://www.rsc.org/images/entities/char_2009.gif) :
:![[thin space (1/6-em)]](https://www.rsc.org/images/entities/char_2009.gif) 10) in 20 mM boric acid buffer (pH 8.4). The reaction was gently stirred for 2 h at room temperature. Finally, the final QD–lectin conjugates were purified by ultrafiltration (100 kDa, 12000 rpm, 5 min) using amicon ultra-4 centrifugal filter devices.
10) in 20 mM boric acid buffer (pH 8.4). The reaction was gently stirred for 2 h at room temperature. Finally, the final QD–lectin conjugates were purified by ultrafiltration (100 kDa, 12000 rpm, 5 min) using amicon ultra-4 centrifugal filter devices.
To confirm whether the QDs were successfully conjugated with lectins, agarose gel electrophoresis was performed on a Tanon EPS-300 (Tanon Technology Corporation, Shanghai, China). After polymerization, aliquots of free QDs or functionalized QDs were mixed with glycerol at a ratio of 5![[thin space (1/6-em)]](https://www.rsc.org/images/entities/char_2009.gif) :
:![[thin space (1/6-em)]](https://www.rsc.org/images/entities/char_2009.gif) 1 (v/v) and then loaded into the gel wells, respectively. The gels were immersed in electrophoresis running buffer (0.5 × TAE) and the 1% agarose gel ran at 140 V for 30 min. The running profiles of the samples were observed by AlphaImager HP Fluorescent and Visible Light Gel Imaging System (Protein Simple Corporation USA) (excitation wavelength at λ = 302 nm).
1 (v/v) and then loaded into the gel wells, respectively. The gels were immersed in electrophoresis running buffer (0.5 × TAE) and the 1% agarose gel ran at 140 V for 30 min. The running profiles of the samples were observed by AlphaImager HP Fluorescent and Visible Light Gel Imaging System (Protein Simple Corporation USA) (excitation wavelength at λ = 302 nm).
The cytotoxicity of the free QDs (QD550 and QD618) and the functionalized QDs (QD550-DSA and QDs618-LCA) was determined using the MTT [3-(4,5-dimethylthiazol-2-yl)-2,5-diphenyltetrazolium bromide] assay. HepG2 cells and LO2 cells (2 × 10⁵ cells per mL) were cultured in DMEM supplemented with 10% FBS and 100 U mL−1 penicillin-streptomycin at 37 °C and 5.0% CO2 in 96-well plates. After an incubation of 24 h, the cells were washed with PBS (pH 7.4, sterilized, 3 times) and then incubated with 100 μL of fresh DMEM or medium containing free QDs or functionalized QDs (0.02, 0.05, 0.1, 0.2, 0.5, or 1.0 μM) for 24 h and 48 h, respectively. Subsequently, 20 μL MTT solution (5 mg mL−1) was added to each well and cultured for 4 h at 37 °C. Then the supernatant was removed and replaced with 150 μL of DMSO for 15 min until crystals were dissolved. MTT quantification was measured at 570 nm with a microplate reader.
Hemagglutination activity of the lectin and the functionalized QDs was evaluated using hemagglutination tests. QD550-DSA, DSA, QD618-LCA and LCA underwent serial two-fold dilutions in 96-well plates and were incubated with a 2% (v/v) trypsinated rabbit erythrocyte cell suspension in 150 mM NaCl for 45 min at room temperature. The highest dilution of the lectin or the functionalized QDs causing visible hemagglutination was regarded as the titer and the minimum concentration of the lectin required for agglutination was considered as one unit of hemagglutination activity. The specific hemagglutination activity of the functionalized QDs was defined as the ratio of the activity of the functionalized QDs and lectin to the activity of the same content of lectin.
The carbohydrate inhibition assays were performed by incubating the functionalized QDs with monosaccharide (50 nM GalNAc for QD550-DSA and 20 nM Man for QD618-LCA, respectively) for 1 h at 25 °C prior to incubation with rabbit erythrocytes, and then the hemagglutination state of the rabbit erythrocyte cell was observed using an inverted fluorescence microscope (IX71, Olympus Corporation, Japan).
The stability of the fluorescence signal, specific targetability, lectin competitive-binding assay and the effect of the concentration of the functionalized QDs were investigated using flow cytometry (FCM) analysis. The FCM assay were measured on a BD FACS Calibur flow cytometer equipped with an argon ionlaser (Becton Dickenson, USA). The fluorescence was excited at λ = 488 nm and the different emitted fluorescence signals were measured simultaneously with an FL1 filter (530 nm/30 nm) or FL2 filter (585 nm/42 nm) for QD550-DSA and QD618-LCA, respectively. All parameters were collected as logarithmic signals. Data analyses were carried out with FlowJo7.6.1 obtained from BD Biosciences. For FCM studies, the cells were harvested using a 0.25% trypsin digestion, and then concentrated by centrifugation (1000 rpm min−1, 5 min). Subsequently, the cells were resuspended with 300 μL PBS in 5 mL polystyrene tubes (Falcon, Becton-Dickinson).
To investigate the effect of the concentration of the functionalized QDs, the functionalized QDs (QD550-DSA, or QD618-LCA) at desired concentrations (2.4, 4.7, 9.4, 23.5 and 37.6 nM) was introduced to the resuspended cells (1 × 10⁶) and shaken at room temperature for 20 min (the endocytosis of the functionalized QDs was observed when incubation time was prolonged) at 450 rpm in the dark, respectively. Then, the functionalized QDs stained cells were washed once with 500 μL of incubation buffer (consisting of PBS supplemented with 2.0% FBS) to remove unbound functionalized QDs. Subsequently, cells were suspended in 300 μL of PBS for FCM analysis. The experimental procedure of the stability of the fluorescence signal, specific targetability and lectin competitive-binding assay of the functionalized QDs were given in ESI.†
Fluorescence microscopy
The cells (HepG2, ECs and LO2) were cultured at 37 °C and 5.0% CO2 for 24 h in six-well plates with (initially) 2 × 10⁵ cells per mL, the cells were rinsed with PBS and then incubated with fresh serum-free media containing functionalized QDs at 23.5 nM for QD550-DSA and 9.4 nM for QD618-LCA for 20 min. After incubation, excess functionalized QDs were rinsed off the cells with PBS. Then, the functionalized QDs stained cells were imaged by an IX71 inverted fluorescence microscope with a 40 × 10 magnification objective and the exposure times for each filter were kept constant for each image series.Flow cytometry analysis of carbohydrates after functionalized QDs staining
The profiling of carbohydrates expressed on the HepG2, ECs and LO2 cells was detected through the mean fluorescence intensity of the functionalized QDs stained cells using FCM analysis. Proper gates for the detection of green-labeled cells (QD550, gate Q3), red-labeled cells (QD618, gate Q1) and simultaneously green-labeled and red-labeled cells (gate Q2) fluorescence events were set with a blank solution containing an equivalent amount of unlabeled cells (gate Q4). These unlabeled cells were also prepared and analyzed before the functionalized QDs stained cells assays. Compensation was performed for dual color detection and a total of 10![[thin space (1/6-em)]](https://www.rsc.org/images/entities/char_2009.gif) 000 fluorescence events from the cells were recorded for subsequent analysis.
000 fluorescence events from the cells were recorded for subsequent analysis.
Results and discussion
Synthesis and characterization of the QDs
The synthesis conditions of the QDs were systematically optimized and the optimal proportion of Cd2+![[thin space (1/6-em)]](https://www.rsc.org/images/entities/char_2009.gif) :
:![[thin space (1/6-em)]](https://www.rsc.org/images/entities/char_2009.gif) Te
Te![[thin space (1/6-em)]](https://www.rsc.org/images/entities/char_2009.gif) :
:![[thin space (1/6-em)]](https://www.rsc.org/images/entities/char_2009.gif) NaBH4 = 1
NaBH4 = 1![[thin space (1/6-em)]](https://www.rsc.org/images/entities/char_2009.gif) :
:![[thin space (1/6-em)]](https://www.rsc.org/images/entities/char_2009.gif) 0.5
0.5![[thin space (1/6-em)]](https://www.rsc.org/images/entities/char_2009.gif) :
:![[thin space (1/6-em)]](https://www.rsc.org/images/entities/char_2009.gif) 10 was ultimately determined. A typical temporal evolution of the absorption and photoluminescence of the crude solution of CdTe QDs during the synthesis are shown in Fig. S1 (ESI†). A growth of the QDs during reflux is indicated by a low-energy shift of the absorption and emission. The crude solutions of QD550 (showing green fluorescence) and QD618 (showing red fluorescence) were chosen for following studies because they can provide better contrast with cellular autofluorescence.
10 was ultimately determined. A typical temporal evolution of the absorption and photoluminescence of the crude solution of CdTe QDs during the synthesis are shown in Fig. S1 (ESI†). A growth of the QDs during reflux is indicated by a low-energy shift of the absorption and emission. The crude solutions of QD550 (showing green fluorescence) and QD618 (showing red fluorescence) were chosen for following studies because they can provide better contrast with cellular autofluorescence.
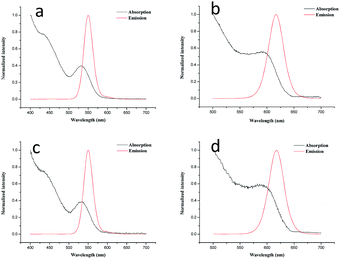
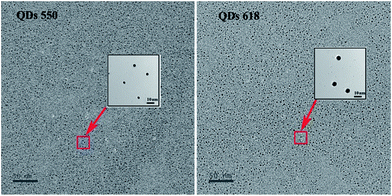
As shown in Fig. 1a and b, the absorption spectra of the original QD550 and QD618 suspensions were broad and QD550 and QD618 suspensions show an emission maximum at 550 nm and 618 nm, with a full width at half maximum of 27 nm and 35 nm, respectively. The accurate geometry of the QDs was investigated with TEM (Fig. 2). The QD550 and QD618 samples were almost homogeneously spherical-shaped particles. The diameter of the particles was 2–4 nm, which was consistent with the diameters estimated at 2.9 nm and 3.5 nm for QD550 and QD618, respectively, according to the empirical formula.37 The QY of QD550 and QD618 was 25.7% and 28.9% under the optimized synthesis conditions, respectively. When the prepared QD550 and QD618 solution was exposed to light for 1 h, the QY of the QDs was significantly enhanced, by nearly 50%, which was probably because the irradiation resulted in an incorporation of sulfur into the particles and the formation of CdTe(S) alloyed nanocrystals.38 The experimental results show that the synthesized QD suspensions are stable for at least 3 months at 4 °C in the dark.
FTIR patterns of QDs were shown in Fig. S1 (ESI†), the peaks at 1588 cm−1 and 1388 cm−1 show the asymmetric and symmetric vibrations of COO−, respectively.39 This is in accordance with the pH of the cadmium precursor solution (pH 10.5). The stretching vibration of S–H (2564 cm−1) was not observed in the as-prepared CdTe QDs with TGA used as the stabilizing and functionalizing agent. This was attributed to the thiol bound to the surface of QDs, which can dramatically remove the traps states.
Fabrication and characterization of functionalized QDs
The thiol group of TGA is linked to the surface of CdTe QDs by thiol group-Cd coordination, and the functional carboxylic group is free, which can be easily coupled to lectin with amine, most commonly by using EDC. Here, the EDC was used as a carboxyl-activating reagent for the lectin conjugation. The fabrication conditions of the functionalized QDs were systematically optimized and an optimal proportion (QDs![[thin space (1/6-em)]](https://www.rsc.org/images/entities/char_2009.gif) :
:![[thin space (1/6-em)]](https://www.rsc.org/images/entities/char_2009.gif) EDC
EDC![[thin space (1/6-em)]](https://www.rsc.org/images/entities/char_2009.gif) :
:![[thin space (1/6-em)]](https://www.rsc.org/images/entities/char_2009.gif) DSA/LCA = 1
DSA/LCA = 1![[thin space (1/6-em)]](https://www.rsc.org/images/entities/char_2009.gif) :
:![[thin space (1/6-em)]](https://www.rsc.org/images/entities/char_2009.gif) 1
1![[thin space (1/6-em)]](https://www.rsc.org/images/entities/char_2009.gif) :
:![[thin space (1/6-em)]](https://www.rsc.org/images/entities/char_2009.gif) 5/10) for the synthesis of stable functionalized QDs was ultimately determined.
5/10) for the synthesis of stable functionalized QDs was ultimately determined.
The optical properties of QD550-DSA (Fig. 1c) and QD618-LCA (Fig. 1d) did not show significant changes compared with free QD550 (Fig. 1a) and QD618 (Fig. 1b), demonstrating that the conjugation process did not change the optical characteristics of the QDs. In addition, the mean fluorescence intensity of the lectin-functionalized QDs/HepG2 complexes did not appear any changes in an hour (Fig. S2, ESI†), proving that the functionalized QDs are photostable, which is crucial for biolabeling applications.
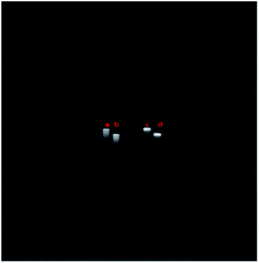
Fig. 3 shows that the functionalized QDs exhibited slower mobility than the free QDs, which could be attributable to their different surface charges and sizes. The difference in the mobility of the QDs versus the functionalized QDs indicates that the functionalized QDs are successfully conjugated with lectin.
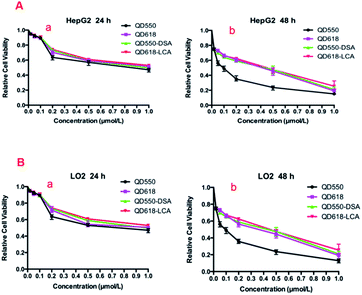
The results of the MTT assay are shown in Fig. 4. Low concentrations (<0.1 μM) of QDs and functionalized QDs did not produce noticeable reduction in cell viability during 24 h of incubation. In addition, the functionalized QDs produced lower cytotoxicity compared with free QDs at the same concentration. This was attributed to the lectin bound to the surface of the functionalized QDs, which can dramatically reduce the leakage of Cd. However, the cytotoxicity of QDs and functionalized QDs increased gradually as the spiked QDs or functionalized QDs concentration was increased.
The hemagglutination activity of the lectin was analyzed using a hemagglutination test before and after conjugation of the QDs (Table S1, ESI†). Clearly, under the same conditions, the QD618 alone did not show hemagglutination activity, whereas the QD618-LCA displayed activity equal to that of the LCA lectin. The same behavior was observed for QD550-DSA. This suggests that the crosslinking process of the functionalized QDs did not affect the hemagglutination activity of lectin.
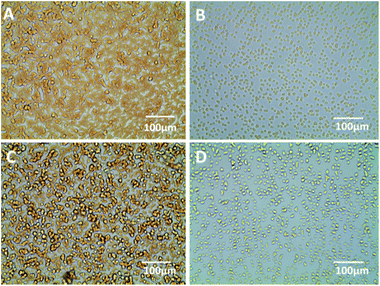
The results of the carbohydrate inhibition assays are shown in Fig. 5. The rabbit erythrocyte cells were agglutinated tightly together when incubated with QD618-LCA (see in Fig. 5C). However, the rabbit erythrocyte cells were homodisperse when QD618-LCA was incubated with Man for 1 h at 25 °C prior to incubation with the cells (Fig. 5D). The experimental results suggests in the presence of Man, the agglutinated rabbit erythrocyte cells was decreased, which indicates that the interaction of QD618-LCA with rabbit erythrocyte cells is inhibited by Man. The same behavior was observed for QD550-DSA, as shown in Fig. 5A and B. The results also further suggest that QD618-LCA and QD550-DSA retain the hemagglutination activity of lectin, which is capable of recognizing specific carbohydrates, even after the conjugation process.
The experimental results of the effect of concentration of the functionalized QDs indicate that the fluorescence signal increased gradually with an increase in the concentration of functionalized QDs, which is attributed to more HepG2 cells being stained by the functionalized QDs. However, when the concentration of QD550-DSA was increased to 23.5 nM and the concentration of QD618-LCA was increased to 9.4 nM, the fluorescence intensity remained stable (Fig. S3, ESI†). Based on these results, the optimal concentrations of 23.5 nM for QD550-DSA and 9.4 nM for QD618-LCA were chosen in the following assay.
HepG2 cells treated with QDs alone showed low fluorescence intensity (7.54 ± 0.311 for QD550 and 74.66 ± 2.435 for QD618, Fig. S4, ESI†). In contrast, cells treated with functionalized QDs demonstrated a high gated fluorescence intensity (23.04 ± 1.474 for QD550-DSA and 313.2 ± 5.362 for QD618-LCA, Fig. S4†), indicating that the functionalized QDs probe can be used for liver cancer cell-specifc imaging.
Low fluorescence intensity (16.30 ± 1.718 for QD550-DSA and 176.7 ± 15.63 for QD618-LCA, Fig. S5, ESI†) was observed when the HepG2 cells were pretreated with lectin. In contrast, cells untreated with lectin showed a higher gated fluorescence intensity (24.38 ± 0.8783 for QD550-DSA and 404.2 ± 7.508 for QD618-LCA, Fig. S5†), indicating that HepG2 cells express GalNAc, GlcNAc or Man residues in their surface glycoconjugates, which further verify that the cell-targeting ability of the functionalized QDs is caused by the interaction between lectin and cell surface carbohydrate.
Applications of functionalized quantum dots
Qualitative fluorescence analysis of carbohydrates using functionalized QDs by fluorescence imaging
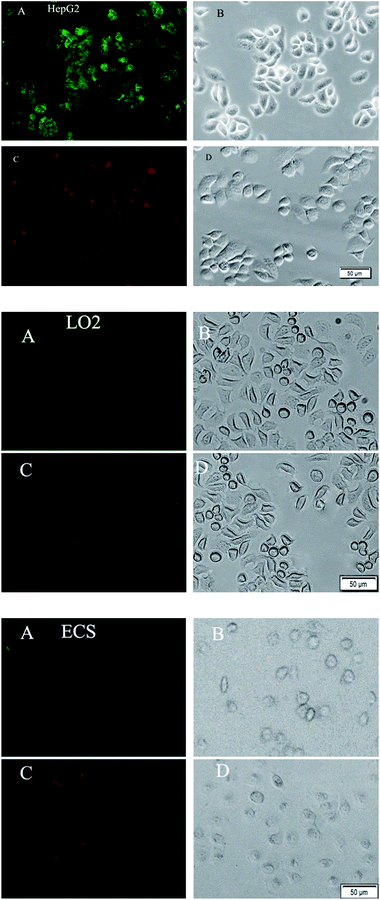
The expression profiles of GalNAc and GlcNAc/Man on HepG2, ECs and LO2 cells were characterized by fluorescence microscopy images. As shown in Fig. 6, stronger green and red fluorescent signals were observed on the HepG2 cells than on normal human cells (ECs and LO2), which suggests that the level of DSA-binding and LCA-binding carbohydrates expressed on the HepG2 cells was higher than ECs and LO2 cells. This could be attributed to the difference in expression levels of glycosyl complexes between cancer cell and normal cell. The result is consistent with a literature report demonstrating that altered glycoconjugate has been observed in hepatocellular carcinoma.10 The experimental results indicate that the functionalized QDs could be used as effective probes for evaluating the difference of HCC-associated carbohydrate expression on the cell surface.Flow cytometry analysis of carbohydrates after functionalized QDs staining
Keeping other parameters (including the number of collected cells, the analysis conditions) fixed, the expression level of carbohydrates was positively correlated with the mean fluorescence intensity of the functionalized QDs stained cells by FCM assay. The mean fluorescence intensities of the cells after incubation with QD550-DSA or QD618-LCA were shown in Table 1. The green fluorescence intensity of the HepG2 cells stained with QD550-DSA was 2.76-fold and 3.69-fold greater than that of the LO2/ECs cells, confirming that the level of DSA-binding carbohydrates expression on the HepG2 cells was higher than normal cells. The mean red fluorescence intensity of the HepG2 cells stained with QD618-LCA was nearly 2.00-fold and 2.03-fold greater than that of the LO2/ECs cells. This confirmed that the level of LCA-binding carbohydrate expression on the HepG2 cells was considerably higher than that of on normal cells, which is consistent with the results obtained by fluorescence images. This further verified that the there is difference in expression of the DSA-binding carbohydrate and LCA-binding carbohydrate between cancer cells and normal cells, which suggesting that carbohydrate expression may be used as important indicator of liver cancer.| Cells | Functionalized QDs | Mean fluorescence intensity (![[X with combining macron]](https://www.rsc.org/images/entities/i_char_0058_0304.gif) ± s) ± s) |
|---|---|---|
| HepG2 | QD550-DSA (green) | 28.37 ± 1.501 |
| HepG2 | QD618-LCA (red) | 404.2 ± 7.508 |
| LO2 | QD550-DSA | 10.27 ± 1.36 |
| LO2 | QD618-LCA | 201.7 ± 16.71 |
| ECs | QD550-DSA | 7.69 ± 1.18 |
| ECs | QD618-LCA | 198.7 ± 13.21 |
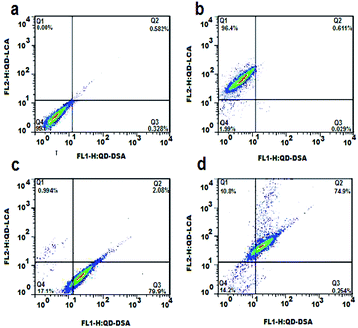
The dot-plot of the green fluorescence burst area versus the red fluorescence burst area is shown in Fig. 7. A negative control experiment using the same amount of unlabeled HepG2 cells demonstrated that there was no appreciable fluorescence burst observed in the fluorescence channels (Fig. 7a). Fig. 7b and c demonstrate the fluorescence burst of the HepG2 cells incubated with QD550-DSA (detected in gate Q3) and QD618-LCA (detected in gate Q1), respectively. As shown in Fig. 7d, when HepG2 cells were incubated with QD550-DSA and QD618-LCA simultaneously, the green fluorescence bursts and red fluorescence bursts simultaneously generated from 74.9% of the HepG2 cells were detected in gate Q2, demonstrating that 74.9% of the HepG2 cells were successfully labeled by QD618-LCA and QD550-DSA concurrently. Clearly, it is feasible to simultaneously label HepG2 cells using two functionalized QDs to concurrently monitor cell surface carbohydrate expression.
Conclusions
In this work, we have demonstrated a fluorescence method for characterizing carbohydrates on cells surfaces using functionalized QDs. The as-proposed functionalized QDs are highly stable in biological medium and could be used as a fluorescence probe to detect the differential expression of glycosyl complexes on cellular surfaces. The differences in GalNAc and GlcNAc/Man residue expression on normal cells and HCC cells can be evaluated simultaneously using the proposed detecting strategy. These differences in carbohydrate expression may help detection and treatment of HCC.Conflict of interest
The authors declare no competing financial interest.Acknowledgements
The authors gratefully acknowledged financial supports from National Natural Science Foundation of China (81471777) and financial supports from Administration of Traditional Chinese Medicine of Hunan Province (201412) and financial supports from Natural Science Foundation of Hunan province (16JJ66126).References
- S. Jin, Y. Cheng, S. Reid, M. Li and B. Wang, Med. Res. Rev., 2010, 30, 171 CAS.
- L. Krishnamoorthy and L. K. Mahal, ACS Chem. Biol., 2009, 4, 715 CrossRef CAS PubMed.
- T. Lange, M. Kupfernagel, D. Wicklein, F. Gebauer, H. Maar, K. Brügge, I. Müller, R. Simon, T. Schlomm, G. Sauter and U. Schumacher, Clin. Cancer Res., 2014, 20, 1791 CrossRef CAS PubMed.
- S. Chen, T. Zheng, M. R. Shortreed, C. Alexander and L. M. Smith, Anal. Chem., 2007, 79, 5698 CrossRef CAS PubMed.
- B. Gallegos, E. Pérez-Campos, R. Martinez, P. Leyva, M. Martinez, R. Hernández, S. Pina, C. Hernández, E. Zenteno and P. Hernández, Prep. Biochem. Biotechnol., 2010, 40, 1 CrossRef CAS PubMed.
- S. A. Fry, B. Afrough, H. J. Lomax-Browne, J. F. Timms, L. S. Velentzis and A. J. Leathem, Glycobiology, 2011, 21, 1060 CrossRef CAS PubMed.
- H. J. An, S. R. Kronewitter, M. L. de Leoz and C. B. Lebrilla, Curr. Opin. Chem. Biol., 2009, 13, 601 CrossRef CAS PubMed.
- H. W. Ressom, J. F. Xiao, L. Tuli, R. S. Varghese, B. Zhou, T. H. Tsai, M. R. Ranjbar, Y. Zhao, J. Wang, P. C. Di, A. K. Cheema, M. G. Tadesse, R. Goldman and K. Shetty, Anal. Chim. Acta, 2012, 743, 90 CrossRef CAS PubMed.
- P. J. Trivedi and S. Cullen, Dig. Dis. Sci., 2011, 56, 276 CrossRef PubMed.
- P. C. Kelleher, C. J. Walters, B. D. Myhre, B. C. Tennant, J. L. Gerin and P. J. Cote, Cancer Lett., 1992, 63, 93 CrossRef CAS PubMed.
- K. Yamashita, N. Koide, T. Endo, Y. Iwaki and A. Kobata, J. Biol. Chem., 1989, 264, 2415 CAS.
- M. A. Comunale, M. Wang, L. Rodemich-Betesh, J. Hafner, A. Lamontagne, A. Klein, J. Marrero, B. A. M. Di, R. Gish, T. Block and A. Mehta, Cancer Epidemiol., Biomarkers Prev., 2011, 20, 1222 CrossRef CAS PubMed.
- C. S. Wu, C. J. Yen, R. H. Chou, S. T. Li, W. C. Huang, C. T. Ren, C. Y. Wu and Y. L. Yu, PLoS One, 2012, 7(7), e39466 CAS.
- E. Han, L. Ding, S. Jin and H. Ju, Biosens. Bioelectron., 2011, 26, 2500 CrossRef CAS PubMed.
- M. Wuhrer, Glycoconjugate J., 2013, 30, 11 CrossRef CAS PubMed.
- T. W. Powers, E. E. Jones, L. R. Betesh, P. R. Romano, P. Gao, J. A. Copland, A. S. Mehta and R. R. Drake, Anal. Chem., 2013, 85, 9799 CrossRef CAS PubMed.
- C. G. Andrade, F. P. E. Cabral, D. P. Tenório, B. S. Santos, E. I. Beltrão, A. Fontes and L. B. Carvalho, Int. J. Nanomed., 2013, 8, 4623 Search PubMed.
- M. A. Model, J. L. Reese and G. C. Fraizer, Cytometry, Part A, 2009, 75, 874 CrossRef PubMed.
- A. Valizadeh, H. Mikaeili, M. Samiei, S. M. Farkhani, N. Zarghami, M. kouhi, A. Akbarzadeh and S. Davaran, Nanoscale Res. Lett., 2012, 7, 480 CrossRef PubMed.
- P. K. Chattopadhyay, S. P. Perfetto, J. Yu and M. Roederer, Wiley Interdiscip. Rev.: Nanomed. Nanobiotechnol., 2010, 2, 334 CrossRef CAS PubMed.
- A. Lyashchova, A. Dmytruk, I. Dmitruk, G. Klimusheva, T. Mirnaya and V. Asaula, Nanoscale Res. Lett., 2014, 9, 88 CrossRef PubMed.
- S. Li, L. Xu, W. Ma, X. Wu, M. Sun, H. Kuang, L. Wang, N. A. Kotov and C. Xu, J. Am. Chem. Soc., 2016, 138, 306 CrossRef CAS PubMed.
- X. Zhao, L. Xu, M. Sun, W. Ma, X. Wu, H. Kuang, L. Wang and C. Xu, Small, 2016, 12(34), 4662 CrossRef CAS PubMed.
- M. Sun, L. Xu, P. Fu, X. Wu, H. Kuang, L. Liu and C. Xu, Adv. Funct. Mater., 2016, 40, 7352 CrossRef.
- Li. Xu, S. Zhao, W. Ma, X. Wu, S. Li, H. Kuang, L. Wang and C. Xu, Adv. Funct. Mater., 2016, 26, 1602 CrossRef CAS.
- C. W. Peng, Q. Tian, G. F. Yang, M. Fang, Z. L. Zhang, J. Peng, Y. Li and D. W. Pang, Biomaterials, 2012, 33, 5742 CrossRef CAS PubMed.
- K. L. Hsu, K. T. Pilobello and L. K. Mahal, Nat. Chem. Biol., 2006, 2, 153 CrossRef CAS PubMed.
- A. Matsumoto, H. Cabral, N. Sato, K. Kataoka and Y. Miyahara, Angew. Chem., Int. Ed., 2010, 49, 5494 CrossRef CAS PubMed.
- S. Hoffmann, J. Hoos, S. Klussmann and S. Vonhoff, Curr Protoc Nucleic Acid Chem., 2011, 46, 1 Search PubMed.
- S. Gamsey, A. Miller, M. M. Olmstead, C. M. Beavers, L. C. Hirayama, S. Pradhan, R. A. Wessling and B. Singaram, J. Am. Chem. Soc., 2007, 129, 1278 CrossRef CAS PubMed.
- X. Chen, Y. He, Y. Zhang, M. Liu, Y. Liu and J. Li, Nanoscale, 2014, 6, 11196 RSC.
- E. L. Bird-Lieberman, A. A. Neves, P. Lao-Sirieix, M. O'Donovan, M. Novelli, L. B. Lovat, W. S. Eng, L. K. Mahal, K. M. Brindle and R. C. Fitzgerald, Nat. Med., 2012, 18, 315 CrossRef CAS PubMed.
- S. A. Gonzalez and E. B. Keeffe, Clin Liver Dis., 2011, 15, 297 CrossRef PubMed.
- D. Li, T. Mallory and S. Satomura, Clin. Chim. Acta, 2001, 313, 15 CrossRef CAS.
- N. Duan, S. Wu, Y. Yu, X. Ma, Y. Xia, X. Chen, Y. Huang and Z. Wang, Anal. Chim. Acta, 2013, 804, 151 CrossRef CAS PubMed.
- X. Wang, Q. Liu, F. Qi, L. Li, H. D. Yu, Z. Liu and W. Huang, Dalton Trans., 2016, 45, 17274 RSC.
- A. Swarnkar, A. R. Marshall, E. M. Sanehira, B. D. Chernomordik, D. T. Moore, J. A. Christians, T. Chakrabarti and J. M. Luther, Science, 2016, 354, 92 CrossRef CAS PubMed.
- A. Shavel, N. Gaponik and A. Eychmuller, J. Phys. Chem. B, 2004, 108, 5905 CrossRef CAS.
- Y. Miao, P. Yang, J. Zhao, Y. Du, H. He and Y. Liu, J. Nanosci. Nanotechnol., 2015, 15, 4462 CrossRef CAS PubMed.
Footnotes |
| † Electronic supplementary information (ESI) available. See DOI: 10.1039/c6ra27612a |
| ‡ These authors contributed equally to this work. |
| This journal is © The Royal Society of Chemistry 2017 |

