 Open Access Article
Creative Commons Attribution 3.0 Unported Licence
Large electrocaloric strength and broad electrocaloric temperature span in lead-free Ba0.85Ca0.15Ti1−xHfxO3ceramics
Xiangjian Wang a,
Jiagang Wub,
Brahim Dkhilc,
Chunlin Zhaob,
Tangyuan Lia,
Wei Lia and
Xiaojie Lou*ad
aMulti-disciplinary Materials Research Center, Frontier Institute of Science and Technology, State Key Laboratory for Mechanical Behavior of Materials, Xi'an Jiaotong University, Xi'an, China. E-mail: xlou03@mail.xjtu.edu.cn
bDepartment of Materials Science, Sichuan University, 610064, China
cLaboratoire Structures, Propriétés et Modélisation des Solides, CentraleSupélec, CNRS-UMR 8580, Université Paris-Saclay, ChâtenayMalabry Cedex 92295, France
dMOE Key Laboratory for Nonequilibrium Synthesis and Modulation of Condensed Matter, Xi'an Jiaotong University, Xi'an 710049, China
First published on 17th January 2017
Abstract
The electrocaloric (EC) effect of Ba0.85Ca0.15Ti1−xHfxO3 (abbreviated as: BCTHx) ceramics has been systematically investigated using an indirect method. Our results indicate that the BCTH0.06 ceramic exhibits a sharp ferroelectric–paraelectric phase transition, around which a large EC value of 1.03 K is obtained under the electric field of 35 kV cm−1, associated with a relatively broad electrocaloric temperature span. The giant EC strength of the BCTH0.06 ceramic is 0.29–0.31 K mm kV−1 under an external electric field of 9 to 35 kV cm−1, which is larger than most previous values. The temperature of the EC peak shifts to higher temperature as the electric field increases, which implies that electric field may be another powerful tool to obtain a large EC value and modulate the EC peak. The ceramics with higher Hf contents display a strong diffusive character. The BCTH0.15 ceramic shows a relatively small EC strength (0.10–0.13 K mm kV−1) with a broader EC temperature span. The diffusive feature of the BCTHx ceramics with high Hf concentrations broaden the electrocaloric temperature span and meanwhile decrease the EC strength considerably. Our results indicate that compositional modification in BaTiO3-based ceramics offers a promising route for designing potential dielectric cooling materials with excellent EC properties.
Introduction
Recently, the exploration of new types of solid-state refrigeration has attracted considerable attention due to the risks associated with greenhouse gas emissions and the urgent need for next-generation solid-state cooling devices.1,2 Promising candidates for solid-state refrigeration that have triggered extensive studies recently are mainly focused on caloric materials, especially electrocaloric (EC) materials.2–4 In EC materials, the EC effect results from the temperature change induced by the change in polarization of dielectric materials via the application/removal of the electric field under adiabatic conditions. In 2006, A. S. Mischenko et al.2 reported a giant EC value of 12 K at 480 kV cm−1 in PbZr0.95Ti0.05O3 films of 350 nm in thickness. This work has stimulated many researchers to explore the EC effect in inorganic and organic materials.3,5–18 It is well known that large EC values could be readily achieved at thin films, due to their high breakdown field. For instance, a giant EC value of 45.3 K was obtained in relaxor Pb0.8Ba0.2ZrO3 thin films with the coexistence of antiferroelectric and ferroelectric phases at room temperature by Peng et al.8 Unfortunately, the lower heat capacity of thin films hinders their application in medium and large-scale solid-state cooling devices. Recently, bulk EC materials have been extensively studied to enhance their EC values. These include BaTiO3-based single crystals,3,19 ceramics,7,20,21 Bi0.5Na0.5TiO3-based ceramics6,22–24 and K0.5Na0.5NbO3-based ceramics.25 The BaTiO3-based materials are considered favorably as suitable EC materials due to their relative low and tunable Curie temperature, low coercive field and lead-free character. However, it remains as a big challenge for scientists to further increase EC temperature change up to 2 K for commercial usage in BaTiO3-based ceramics due to their relative lower breakdown field. In the past few years, it was suggested that a good way to enhance the EC effect of the ceramic is to construct a morphotropic phase boundary through compositional modifications. The piezoelectric, electromechanical and electrocaloric properties of the ceramics are enhanced significantly, which is attributed to the comparable energy in the energy landscape at the coexistence of multi-phases.7 Based on this theory, large EC values have been achieved using this theory in (1 − x)BaTi0.8Zr0.2O3–xBa0.7Ca0.3TiO3 ceramics,26 BaTi1−xSnxO3 ceramics7 and Ba0.94Ca0.06Ti1−xSnxO3 ceramics.20 For (1 − x)BaTi0.8Zr0.2O3–xBa0.7Ca0.3TiO3 ceramics, the best EC properties were achieved for x = 0.30 by Bai et al.27 and x = 0.4 by Zhou et al.28 respectively. Such discrepancy may be related to the grain size of ceramic and compositional fluctuations. To date, the mechanism underlying the electrocaloric effect is not yet fully established.1 In addition, the magnitude of electric field is significant element to influence the EC effect. High electric field in ceramics may induce significant Joule heating,29,30 breakdown and fatigue which hinder their future application in efficient EC cooling. EC strength η (η = ΔT/ΔE) is another important parameter to characterize EC effect in different materials. Generally speaking, large EC temperature are achieved at higher electric field, provided that the ceramic does not suffer electrical breakdown. On the other hand, EC strength has been observed to decrease at higher electric field using indirect or direct method in BaTiO3-based ceramics,20,21,31 and 0.45BaZr0.2Ti0.8O3–0.55Ba0.7Ca0.3TiO3 single crystal.19 The decreasing EC strength is attributed to phase transition from the first-order to more diffusive second-order under higher electric field.20 Kutnjak et al. studied the EC effect using high-resolution calorimeter, their results indicate that the maximum of EC strength is occurred at electric field critical point in lead-based ceramic relaxors32 and BaTiO3 single crystal.33Previous results suggest that the diffuse or relaxor phase transition in PbMg1/3Nb2/3O3–xPbTiO3 relaxors29,32,34,35 and BaZr0.2T0.8O3 relaxor ceramic21 broadens the electrocaloric temperature peak span, and is favorable for future refrigeration applications. However, it remains as a big challenge to design EC materials withstanding high electric field. It is highly warranted to enhance EC effect under low electric field. Therefore, it is desirable to study systemically the relationship between EC effect and the magnitude of electric field. Previous studies36,37 indicate that the compositional modification of B-site in BaTiO3 ceramic modulates the nature of phase transition. Here, the EC effect of Ba0.85Ca0.15Ti1−xHfxO3 ceramics is studied at various electric fields using thermodynamics Maxwell relations. Our results show that the largest EC value of 1.03 K is obtained at 35 kV cm−1 in the BCTH0.06 ceramic, associated with a giant EC strength of 0.29–0.31 K mm kV−1 under an external electric field of 9 to 35 kV cm−1. The BCTH0.15 ceramic with strong diffuse character exhibits broad electrocaloric temperature range associated with relatively low EC strength.
Experimental
The Ba0.85Ca0.15Ti1−xHfxO3 (x = 0.06, 0.10, 0.125, and 0.15) ceramics were fabricated by conventional solid state method as described elsewhere.38 The ceramics were coated with silver pastes on the upper and bottom surfaces and sintered at 600 °C for 10 min for electrical measurements. The crystal structures of all ceramics were examined using X-ray diffraction (XRD Shimadzu 7000). The density of all the ceramics was measured using Archimedes methods. The dielectric measurements were conducted with a HIOKI 3532 LCR meter from −100 °C to 180 °C. The ferroelectric hysteresis loops (P–E) were measured at different electric fields and temperatures using Radiant precise workstation at 10 Hz. Heat flow analysis of these ceramics was conducted by a differential scanning calorimeter (DSC, TA Instruments Q200).Results and discussion
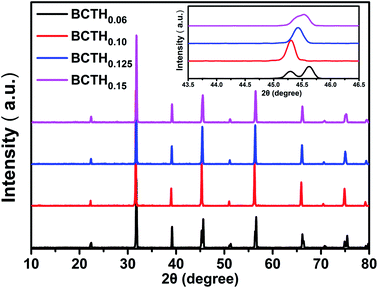
The room temperature XRD patterns of BCTHx ceramics are shown in Fig. 1. These ceramics show a pure perovskite phase without secondary impurity phase, indicating that Ca2+ and Hf4+ ions have diffused into the BaTiO3 lattice to form Ba0.85Ca0.15Ti1−xHfxO3 solid solution. The splitting of the (200) and (310) peaks exist the mixture of tetragonal and monoclinic phase in the BCTH006 ceramics. The overlapping of the diffraction peak around 45° at x > 0.10 indicates that the structure transforms from tetragonal phase to pseudocubic one.To investigate the phase transition behavior of BCTHx ceramics, their dielectric constants as a function of temperature were collected at 10 Hz, 100 Hz, 1000 Hz, 10![[thin space (1/6-em)]](https://www.rsc.org/images/entities/char_2009.gif) 000 Hz and 100
000 Hz and 100![[thin space (1/6-em)]](https://www.rsc.org/images/entities/char_2009.gif) 000 Hz and 1 V during cooling process, as shown in Fig. 2. The Curie temperature of all the ceramics decreases successively with increasing of Hf contents, it changes from Tc = 104 °C (x = 0.06) to Tc = 55 °C (x = 0.15). The dielectric permittivity peaks of the ceramics become broader at higher Hf contents, which indicates the existence of a composition-induced diffuse ferroelectric phase transition. It was found that the frequency dispersion of dielectric permittivity of BCTH0.15 ceramic becomes obvious, indicating that the phase transition indeed becomes more diffuse.
000 Hz and 1 V during cooling process, as shown in Fig. 2. The Curie temperature of all the ceramics decreases successively with increasing of Hf contents, it changes from Tc = 104 °C (x = 0.06) to Tc = 55 °C (x = 0.15). The dielectric permittivity peaks of the ceramics become broader at higher Hf contents, which indicates the existence of a composition-induced diffuse ferroelectric phase transition. It was found that the frequency dispersion of dielectric permittivity of BCTH0.15 ceramic becomes obvious, indicating that the phase transition indeed becomes more diffuse.
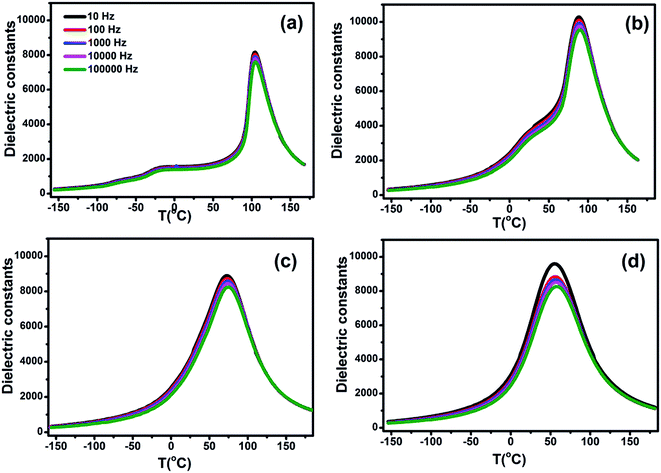 | ||
Fig. 2 The dielectric constants of BCTHx (a) x = 0.06, (b) x = 0.10, (c) x = 0.125, (d) x = 0.15 ceramics as a function of temperature at 10 Hz, 100 Hz, 1000 Hz, 10![[thin space (1/6-em)]](https://www.rsc.org/images/entities/char_2009.gif) 000 Hz and 100 000 Hz and 100![[thin space (1/6-em)]](https://www.rsc.org/images/entities/char_2009.gif) 000 Hz. 000 Hz. | ||
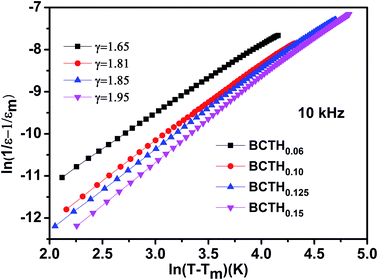
In order to further present diffuseness character of the phase transition in these ceramics, the modified the Curie–Weiss law39,40 are suggested to determine the diffuse exponent γ, as follows: 1/ε − 1/εm = (T − Tm)γ/C, where εm is the maximum of dielectric constant and Tm is the corresponding temperature. γ and C are assumed to be constant. Fig. 3 shows the plot of ln(1/ε − 1/εm) as a function of ln(T − Tm) of BCTHx ceramics at 10![[thin space (1/6-em)]](https://www.rsc.org/images/entities/char_2009.gif) 000 Hz. For γ = 1, a normal Curie–Weiss law is satisfied, and γ = 2 means a complete diffuse phase transition to relaxor behavior. The diffuse exponent γ is found to be ∼1.65, 1.81, 1.85 and 1.95 for BCTHx ceramics with x = 0.06, x = 0.10, x = 0.125 and x = 0.15, respectively. The diffuseness of these ceramics is affected by the competition between Hf4+ (0.71 Å) and Ti4+ (0.61 Å) cations occupied in B-site of perovskite in nature. In addition, previous study has also reported that the sintering temperature also influence the diffuseness of phase transition of BaTiO3-based ceramics.41
000 Hz. For γ = 1, a normal Curie–Weiss law is satisfied, and γ = 2 means a complete diffuse phase transition to relaxor behavior. The diffuse exponent γ is found to be ∼1.65, 1.81, 1.85 and 1.95 for BCTHx ceramics with x = 0.06, x = 0.10, x = 0.125 and x = 0.15, respectively. The diffuseness of these ceramics is affected by the competition between Hf4+ (0.71 Å) and Ti4+ (0.61 Å) cations occupied in B-site of perovskite in nature. In addition, previous study has also reported that the sintering temperature also influence the diffuseness of phase transition of BaTiO3-based ceramics.41
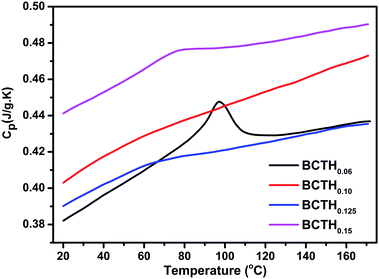
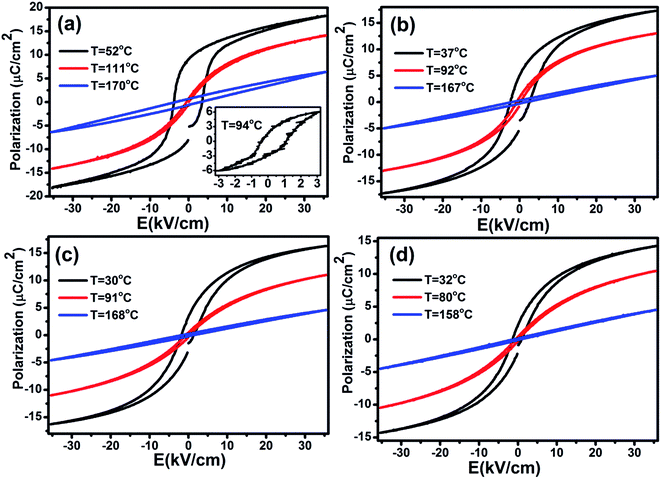
The heat capacity (Cp) of BCTHx ceramics is displayed in Fig. 4. The obvious heat flow peak is only observed in BCTH0.06 compound. That implies the diffuseness weakens the heat flow peak in other three ceramics. Obviously, Cp increases with increasing temperature, our data are in good agreement with the previous results on other BaTiO3-based ceramics.5,20 In order to evaluate the EC effect of BCTHx ceramics, the P–E hysteresis loops were measured at different temperature at 10 Hz. Fig. 5 displays the P–E hysteresis loops of BCTHx ceramics at three different temperatures. Both polarization and coercive field decrease as the temperature increases. The P–E hysteresis loops indicate these ceramics are ferroelectric below Curie temperature. The temperature is higher than its Curie temperature, the P–E hysteresis loops shrink to an approximate line, implies the nature of paraelectric feature. The inset of Fig. 5(a) shows the pinched P–E hysteresis loop at low electric field of 3 kV cm−1. From Fig. 5(d), one can see that the BCTH0.15 ceramic shows relaxor-like feature, which agrees well with dielectric permittivity results. It is also observed that both polarization and coercive field decrease with increasing of Hf content. The P–T curves of BCTHx ceramics under various electric fields are shown in Fig. 6. One can see that large polarization value is induced by large external electric field at the same temperature. The value of polarization decreases with increasing temperature. However, the polarization of BCTH0.06 ceramic starts to increase with increasing of temperature and then decreases at 3 kV cm−1, as seen in Fig. 6(a). This result can be expected to obtain negative EC effect.
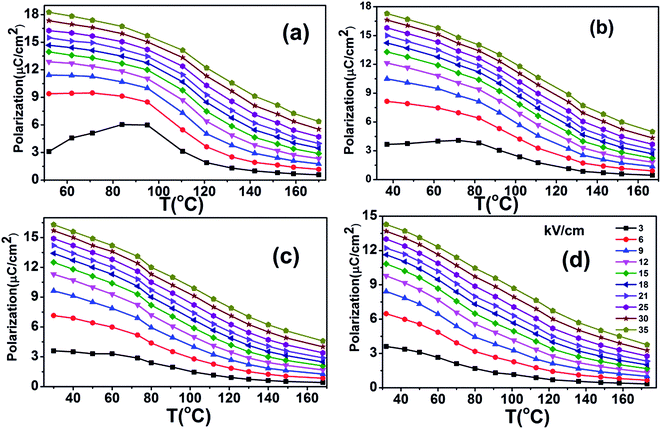 | ||
| Fig. 6 The P–T curves of BCTHx (a) x = 0.06, (b) x = 0.10, (c) x = 0.125, (d) x = 0.15 ceramics at various electric field. | ||
According to the thermodynamics Maxwell relation, the adiabatic temperature change ΔT and isothermal entropy change ΔS are calculated by the temperature dependence of polarization by:2
 | (1) |
 | (2) |
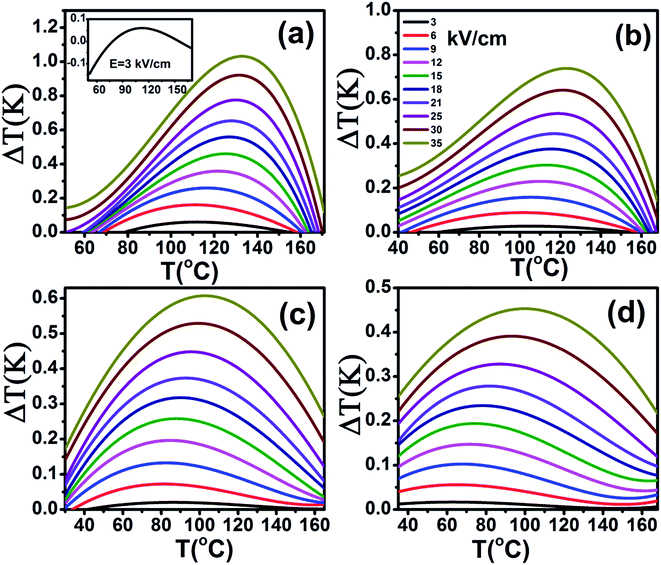
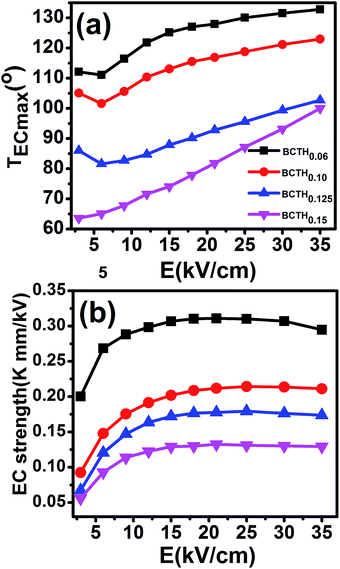
The adiabatic temperature change ΔT (in Fig. 7) and isothermal entropy change ΔS (in Fig. 8) in BCTHx ceramics are obtained at various electric fields. It is found that negative EC effect is observed at 3 kV cm−1 in BCTH0.06 ceramic, as shown in the inset of Fig. 7(a). Negative EC effect can be attributed to the pinched ferroelectric hysteresis loops induced by the existence of multiphase.42 Large EC values are obtained at higher electric field in all ceramics. However, at higher temperature, the ceramic becomes more leaky and readily breakdown. The highest electric field of 35 kV cm−1 has been applied for the four ceramics at measured temperature. Table 1 and Fig. 7 show that the largest EC values at 35 kV cm−1 are 1.03 K for BCTH0.06, 0.74 K for BCTH0.10, 0.61 K for BCTH0.125, and 0.45 K for BCTH0.15, respectively, all occurring near the ferroelectric–paraelectric phase transition. The isothermal entropy change ΔS shows the same change trend as the electrocaloric temperature change ΔT. The corresponding isothermal entropy change ΔS are 0.98 J kg−1 K−1 for BCTH0.06, 0.77 J kg−1 K−1 for BCTH0.10, 0.64 J kg−1 K−1 for BCTH0.125, and 0.54 J kg−1 K−1 for BCTH0.15, respectively, under the electric field of 35 kV cm−1, as displayed in Fig. 8. It is well known that both large EC value and high EC strength are beneficial for the application of cooling device. The temperature of maximum ΔT and EC strength at various electric fields are displayed in Fig. 9(a) and (b). For BCHT0.06 ceramic, the EC temperature change ΔT of 0.36 K occurs at 121 °C under electric field of 12 kV cm−1, while ΔT increases to 1.03 K occurring at 132 °C as electric field increases to 35 kV cm−1. Similar results are observed for other three ceramics, see Fig. 7. Obviously, the temperature at which the maximum ΔT is obtained for all the ceramics shifts to higher temperature with increasing of the electric filed, see Fig. 9(a). Such phenomenon indicates that the Curie temperature of these ceramics is shifted to higher temperature under higher electric field, which agrees well with previous works on 0.71PbMg1/3Nb2/3O3–0.29PbTiO3 single crystal,34 BaTiO3 single crystals3,43 and BaTiO3-based ceramics.44,45 The elevated Curie temperature under higher electric field is attributed to the electric-induced phase transition or change in domain configuration.45
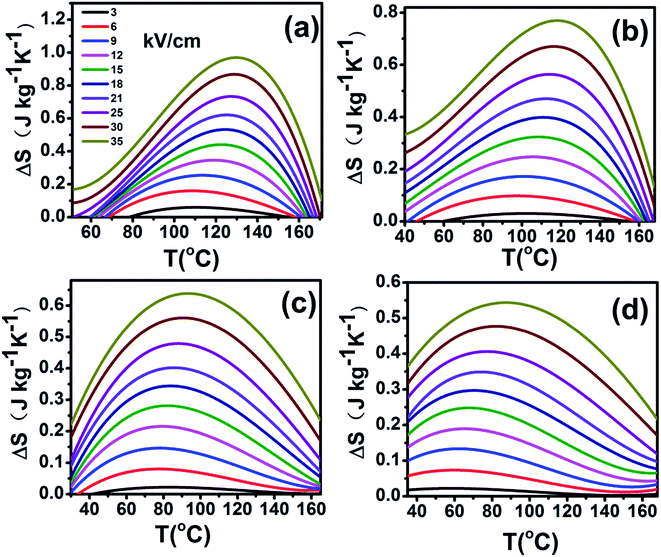 | ||
| Fig. 8 Entropy change (ΔT) as a function of temperature of BCTHx (a) x = 0.06, (b) x = 0.10, (c) x = 0.125, (d) x = 0.15 ceramics at various electric fields. | ||
| Ceramic | E (kV cm−1) | TEcmax (°C) | ΔT (K) | ΔT (TEcmax − 20) | ΔT (TEcmax + 20) |
|---|---|---|---|---|---|
| BCTH0.06 | 35 | 133 | 1.03 | 0.89 | 0.81 |
| 21 | 128 | 0.65 | 0.55 | 0.50 | |
| 9 | 117 | 0.26 | 0.22 | 0.21 | |
| BCTH0.10 | 35 | 123 | 0.74 | 0.67 | 0.64 |
| 21 | 117 | 0.44 | 0.40 | 0.38 | |
| 9 | 106 | 0.16 | 0.14 | 0.14 | |
| BCTH0.125 | 35 | 103 | 0.61 | 0.57 | 0.57 |
| 21 | 93 | 0.37 | 0.34 | 0.35 | |
| 9 | 83 | 0.13 | 0.12 | 0.12 | |
| BCTH0.15 | 35 | 100 | 0.45 | 0.43 | 0.43 |
| 21 | 82 | 0.28 | 0.26 | 0.26 | |
| 9 | 68 | 0.10 | 0.09 | 0.09 |
The EC strength of all ceramics increases sharply below 15 kV cm−1, as shown in Fig. 9(b). The enhanced EC strength at low electric field is dominantly attributed to the entropy contribution of non-180 domain switching.46,47 Above 15 kV cm−1, the EC strength is nearly constant. Such results suggest that high EC strength can be obtained at relative low electric field. Higher electric field may induce electrical fatigue, mechanical cracks and Joule heating, which are not desirable for practical applications. The polarization of BCTH0.06 ceramic is saturated easily at a relatively low electric field of 9 kV cm−1. However, more diffusive second order phase transition is induced, along with reduced EC strength with increasing of electric field. For example, for BCTH0.06 ceramic, the EC strength is up to 0.31 K mm kV−1 at 21 kV cm−1, it decreases to 0.29 K mm kV−1 under an electric field of 35 kV cm−1. The EC strength is larger than most of lead-free ceramics24,25,27 and even lead-based ceramic.16 For BCTH0.06 ceramic, the EC values are 1.03 K at 133 °C, 0.89 K at 113 °C and 0.81 K at 153 °C under electric filed of 35 kV cm−1, respectively, as shown in Table 1 and Fig. 7(a). Obviously, the decrease in ΔT above the TEmax temperature is more significant than that below the TEmax temperature. This implies that superior EC effect can be obtained below Curie temperature. The responding EC strength is 0.29 K mm kV−1, 0.25 K mm kV−1 and 0.23 K mm kV−1, respectively, at 35 kV cm−1. Both the EC value and EC strength decrease slightly below or above 20 °C of EC peak temperature. The EC strength is 0.23–0.29 K mm kV−1 at the temperature span of 40 °C, which displays a relatively broad EC temperature span. The EC strength of BCTH0.15 is nearly constant, although this value is only 0.13 K mm kV−1 at the range of 40 °C. For these ceramics, the maximum temperature span becomes broader with increasing Hf content, which can be attributed to the diffuseness character of the ceramics with higher Hf doping level. Our dielectric and heat capacity datas also confirm the diffuseness character with increasing Hf content. Unfortunately, both EC value and EC strength decrease dramatically in the ceramics with diffuse phase transition.
Conclusions
In summary, the BCTHx ceramics are fabricated using solid state reaction route. We systematically investigated their EC effect of these four ceramics as a function of temperature and electric field using indirect method based on thermodynamics Maxwell relation. The BCTH0.06 ceramic displays a sharp ferroelectric–paraelectric phase transition, large EC value of 1.03 K at 35 kV cm−1 is reported, associated with a relatively broad EC temperature span. Under the electric field of 9 to 35 kV cm−1, the EC strength is 0.29–0.31 K mm kV−1, which are comparable to the best results of previous studies. With increasing Hf contents, the dielectric analysis shows that the ceramics display strong diffusive character. The BCTH0.15 ceramic has relative small EC strength (0.10–0.13 K mm kV−1) and exhibit a broader EC temperature span. The decreasing EC strength and broad EC temperature span are attributed to the nature of diffuse feature of ceramic. In addition, the temperature of EC peak shifts to higher temperature as the electric field increases, which suggests that electric field can be an useful tool to tune the temperature of EC peak. Our results indicate that compositional modification of BaTiO3 ceramics may offer a promising route for designing potential EC materials.Acknowledgements
This work was supported by National Science Foundation of China (NSFC No. 51372195, 41372055), fundamental Research Funds for Central Universities (2013JDGZ03), the CSS project (Grant No. YK2015-0602006) and Grant No. IRT13034. X. J. Lou would like to thank the “One Thousand Youth Talents” program for support.References
- T. Correia and Q. Zhang, Electrocaloric Materials, Springer, 2014 Search PubMed.
- A. Mischenko, Q. Zhang, J. Scott, R. Whatmore and N. Mathur, Science, 2006, 311(5765), 1270–1271 CrossRef CAS PubMed.
- X. Moya, E. Stern-Taulats, S. Crossley, D. González-Alonso, S. Kar-Narayan, A. Planes, L. Mañosa and N. D. Mathur, Adv. Mater., 2013, 25(9), 1360–1365 CrossRef CAS PubMed.
- G. Zhang, X. Zhang, H. Huang, J. Wang, Q. Li, L.-Q. Chen and Q. Wang, Adv. Mater., 2016, 28(24), 4811–4816 CrossRef CAS PubMed.
- B. Asbani, J.-L. Dellis, A. Lahmar, M. Courty, M. Amjoud, Y. Gagou, K. Djellab, D. Mezzane, Z. Kutnjak and M. El Marssi, Appl. Phys. Lett., 2015, 106(4), 042902 CrossRef.
- Y. Bai, G.-P. Zheng and S.-Q. Shi, Mater. Res. Bull., 2011, 46(11), 1866–1869 CrossRef CAS.
- Z. Luo, D. Zhang, Y. Liu, D. Zhou, Y. Yao, C. Liu, B. Dkhil, X. Ren and X. Lou, Appl. Phys. Lett., 2014, 105(10), 102904 CrossRef.
- B. Peng, H. Fan and Q. Zhang, Adv. Funct. Mater., 2013, 23(23), 2987–2992 CrossRef CAS.
- S. Lu, B. Rožič, Q. Zhang, Z. Kutnjak and B. Neese, Appl. Phys. Lett., 2011, 98(12), 122906 CrossRef.
- G. Zhang, Q. Li, H. Gu, S. Jiang, K. Han, M. R. Gadinski, M. A. Haque, Q. Zhang and Q. Wang, Adv. Mater., 2015, 27(8), 1450–1454 CrossRef CAS PubMed.
- W. Geng, Y. Liu, X. Meng, L. Bellaiche, J. F. Scott, B. Dkhil and A. Jiang, Adv. Mater., 2015, 27(20), 3165–3169 CrossRef CAS PubMed.
- M. Ye, T. Li, Q. Sun, Z. Liu, B. Peng, C. Huang, P. Lin, S. Ke, X. Zeng, X. Peng, L. Chen and H. Huang, J. Mater. Chem. C, 2016, 4(16), 3375–3378 RSC.
- H. Khassaf, J. V. Mantese, N. Bassiri-Gharb, Z. Kutnjak and S. P. Alpay, J. Mater. Chem. C, 2016, 4(21), 4763–4769 RSC.
- H. Kaddoussi, Y. Gagou, A. Lahmar, J. Belhadi, B. Allouche, J.-L. Dellis, M. Courty, H. Khemakhem and M. El Marssi, Solid State Commun., 2015, 201, 64–67 CrossRef CAS.
- F. Han, Y. Bai, L.-J. Qiao and D. Guo, J. Mater. Chem. C, 2016, 4(9), 1842–1849 RSC.
- B. Rožič, M. Kosec, H. Uršič, J. Holc, B. Malič, Q. Zhang, R. Blinc, R. Pirc and Z. Kutnjak, J. Appl. Phys., 2011, 110(6), 064118 CrossRef.
- Z. Y. Jiang, X. C. Zheng and G. P. Zheng, RSC Adv., 2015, 5(76), 61946–61954 RSC.
- G. Zhang, Z. Chen, B. Fan, J. Liu, M. Chen, M. Shen, P. Liu, Y. Zeng, S. Jiang and Q. Wang, APL Mater., 2016, 4(6), 064103 CrossRef.
- G. Singh, I. Bhaumik, S. Ganesamoorthy, R. Bhatt, A. Karnal, V. Tiwari and P. Gupta, Appl. Phys. Lett., 2013, 102(8), 082902 CrossRef.
- X. Wang, F. Tian, C. Zhao, J. Wu, Y. Liu, B. Dkhil, M. Zhang, Z. Gao and X. Lou, Appl. Phys. Lett., 2015, 107(25), 252905 CrossRef.
- X. S. Qian, H. J. Ye, Y. T. Zhang, H. Gu, X. Li, C. Randall and Q. Zhang, Adv. Funct. Mater., 2014, 24(9), 1300–1305 CrossRef CAS.
- M. Zannen, A. Lahmar, B. Asbani, H. Khemakhem, M. El Marssi, Z. Kutnjak and M. Es Souni, Appl. Phys. Lett., 2015, 107(3), 032905 CrossRef.
- F. Le Goupil, J. Bennett, A.-K. Axelsson, M. Valant, A. Berenov, A. J. Bell, T. P. Comyn and N. M. Alford, Appl. Phys. Lett., 2015, 107(17), 172903 CrossRef.
- F. Le Goupil and N. M. Alford, APL Mater., 2016, 4(6), 064104 CrossRef.
- J. Koruza, B. Rožič, G. Cordoyiannis, B. Malič and Z. Kutnjak, Appl. Phys. Lett., 2015, 106(20), 202905 CrossRef.
- W. Liu and X. Ren, Phys. Rev. Lett., 2009, 103(25), 257602 CrossRef PubMed.
- Y. Bai, X. Han and L. Qiao, Appl. Phys. Lett., 2013, 102(25), 252904 CrossRef.
- Y. Zhou, Q. Lin, W. Liu and D. Wang, RSC Adv., 2016, 6(17), 14084–14089 RSC.
- J. Peräntie, H. N. Tailor, J. Hagberg, H. Jantunen and Z.-G. Ye, J. Appl. Phys., 2013, 114(17), 174105 CrossRef.
- M. Quintero, L. Ghivelder, F. Gomez-Marlasca and F. Parisi, Appl. Phys. Lett., 2011, 99(23), 232908 CrossRef.
- X. Zhang, L. Wu, S. Gao, J. Liu, B. Xu, Y. Xia, J. Yin and Z. Liu, AIP Adv., 2015, 5(4), 047134 CrossRef.
- B. Rožič, M. Kosec, H. Uršič, J. Holc, B. Malič, Q. M. Zhang, R. Blinc, R. Pirc and Z. Kutnjak, J. Appl. Phys., 2011, 110(6), 064118 CrossRef.
- N. Novak, R. Pirc and Z. Kutnjak, Phys. Rev. B: Condens. Matter Mater. Phys., 2013, 87(10), 104102 CrossRef.
- L. Luo, M. Dietze, C.-H. Solterbeck, M. Es-Souni and H. Luo, Appl. Phys. Lett., 2012, 101(6), 062907 CrossRef.
- Y. P. Shi and A. K. Soh, Acta Mater., 2011, 59(14), 5574–5583 CrossRef CAS.
- S. Anwar, P. R. Sagdeo and N. P. Lalla, Solid State Commun., 2006, 138(7), 331–336 CrossRef CAS.
- X. G. Tang, K. H. Chew and H. L. W. Chan, Acta Mater., 2004, 52(17), 5177–5183 CrossRef CAS.
- C. Zhao, W. Wu, H. Wang and J. Wu, J. Appl. Phys., 2016, 119(2), 024108 CrossRef.
- K. Uchino and S. Nomura, Ferroelectrics, 1982, 44(1), 55–61 CrossRef CAS.
- X. G. Tang, K. H. Chew and H. L. W. Chan, Acta Mater., 2004, 52(17), 5177–5183 CrossRef CAS.
- P. Mishra and P. Sonia Kumar, J. Alloys Compd., 2012, 545, 210–215 CrossRef CAS.
- B. Xu, C. Paillard, B. Dkhil and L. Bellaiche, Phys. Rev. B: Condens. Matter Mater. Phys., 2016, 94(14), 140101 CrossRef.
- N. Novak, R. Pirc and Z. Kutnjak, Ferroelectrics, 2014, 469(1), 61–66 CrossRef CAS.
- M. Sanlialp, V. V. Shvartsman, M. Acosta, B. Dkhil and D. C. Lupascu, Appl. Phys. Lett., 2015, 106(6), 062901 CrossRef.
- H. Guo, B. K. Voas, S. Zhang, C. Zhou, X. Ren, S. P. Beckman and X. Tan, Phys. Rev. B: Condens. Matter Mater. Phys., 2014, 90(1), 014103 CrossRef.
- S. Gupta and S. Priya, Appl. Phys. Lett., 2013, 102(1), 012906 CrossRef.
- Q. M. Zhang, H. Wang, N. Kim and L. E. Cross, J. Appl. Phys., 1994, 75(1), 454–459 CrossRef CAS.
| This journal is © The Royal Society of Chemistry 2017 |

