 Open Access Article
Luminescent properties of europium titanium phosphate thin films deposited by atomic layer deposition†
Michael N. Getz ,
Per-Anders Hansen,
Helmer Fjellvåg and
Ola Nilsen*
Department of Chemistry, Centre for Materials Science and Nanotechnology, University of Oslo, Sem Sælandsvei 26, 0371 Oslo, Norway. E-mail: Ola.Nilsen@kjemi.uio.no
First published on 23rd January 2017
Abstract
In the present contribution we assess the luminescent properties of amorphous europium titanium phosphate thin films. The films have been deposited by atomic layer deposition, using the precursor combinations Eu(thd)3 (thd = 2,2,6,6-tetramethyl-3,5-heptanedione) and O3, TiCl4 and H2O, and Me3PO4, H2O and O3 at a deposition temperature of 300 °C. UV light is absorbed in the (TiO6)8− complex and subsequently transferred to Eu3+, from which characteristic visible red emission takes place. The inclusion of phosphate is expected to reduce the symmetry around Eu3+ compared to the pure oxide structure, which should increase the f–f transition rate and improve the luminescence efficiency. The as deposited samples display a high degree of photobleaching when subjected to UV or X-rays. The bleaching rate has been quantified for the as deposited samples and can be controlled by adjusting the Ti-content in the samples. Annealing the samples at 500–700 °C increases both the photostability and the luminescence of all compositions, while annealing at 800 °C and above quenches the Eu3+ luminescence. Annealing at 1000 °C results in a broad NIR emission centred around 820 nm for most of the samples. The structure, roughness, thickness and composition of the deposited films have been studied by X-ray diffraction, atomic force microscopy, ellipsometry, and X-ray fluorescence, respectively. The optical properties have been characterized with excitation and photoluminescence spectroscopy and spectroscopic ellipsometry, while field emission scanning electron microscopy has been used to determine the morphology of the annealed samples.
Introduction
Luminescent materials, and the lanthanides in particular, are key components in a wide range of applications, like lasers,1 LEDs,2,3 scintillators,4 sensors5 and biological markers.6,7 The lanthanide oxides are thermodynamically very stable with high melting points, enabling applications at high temperatures and under harsh environments as well as bifunctional materials such as protective luminescent coatings.8 They are also stable in contact with silicon, which is a requirement for silicon based technologies such as photovoltaics.9One of the limiting factors in present silicon based photovoltaics is losses due to thermalization. These losses can be reduced by application of thin films of luminescent materials that convert UV photons to visible light. In this manner, the visible light can be tuned to better fit the optical absorption profile of the silicon solar cell and with an overall increase in efficiency.10–12 However, in order to realise such implementations, highly efficient converter materials have to be produced as thin films or coatings. Chen et al. for instance observed an efficiency increase of a silicon cell from 17.1% to 17.7% by adding a luminescent UV conversion layer.13 Another related application of such thin films is as coatings for green houses to increase crop growth.14
Eu3+ is known for its characteristic red luminescence and is able to convert UV to red. However, as the absorption bands of Eu3+ are narrow, it is common to incorporate it into hosts that can absorb UV light and then transfer the energy to Eu3+, from which characteristic red emission takes place. In our current work the charge-transfer (CT) absorption of (TiO6)8− is used as the absorbing material, and the energy is transferred to Eu3+ via Förster resonant energy transfer (FRET).
Atomic layer deposition (ALD) is a unique gas-phase deposition technique and is considered a powerful method for depositing thin and conformal films for ultra-scaled conventional and novel microelectronic devices at low temperatures.15–17 The development of ALD processes for ternary and quaternary oxides has recently seen a rapid increase.18–22
We here demonstrate successful ALD synthesis of an amorphous europium titanium phosphate system (EuxTiyPzOu), as an extension of our prior work on the luminescent properties of europium titanate thin films.23,24 The inclusion of phosphate results in an increased emission, which is expected to be due to reduced symmetry of the lanthanide surroundings, increasing the spontaneous emission rate. As solid solubility between EuPO4 and any Ti–P–O structure does not seem to occur, the samples are completely amorphous up to relatively high temperatures, before decomposing into multiple crystalline phases.
We also demonstrate materials exhibiting a decrease in emission while being subjected to UV light, i.e. a form of photobleaching. As this effect can be desirable or not, depending on the application it is intended for (UV stable or UV reactive), it is useful to determine if it can be controlled. Photobleaching is often related to reversible or irreversible photoinduced structural changes,25–27 and if the changes are reversible, they can potentially be useful for applications like optical storage and holography.28
Experimental
The films were deposited with an F-120 research-type ALD-reactor (ASM Microchemistry Ltd) at 300 °C and at a reactor pressure of 2.2 mbar. The β-diketonate chelate Eu(thd)3 (thd = 2,2,6,6-tetramethyl-3,5-heptanedione) (Strem Chemicals, >99.9%), was used as the europium precursor. TiCl4 (Aldrich, >99.9%) was used as titanium precursor. Me3PO4 (Merck Chemicals, >98%) was used as the phosphorous precursor. Ozone was used as the oxygen source and was produced from >99.9% O2 in an In USA ozone generator (AC-2025). Nitrogen was used as carrier and purge gas and was separated from air in a nitrogen generator (Schmidlin UHPN3001 N2 purifier, >99.999% N2 + Ar purity). All depositions were preceded by an in situ 30 minute ozone cleaning consisting of 300 cycles of 3 s O3 pulse and 3 s N2 purge at the deposition temperature in order to remove any organic remains.The sublimation temperature used for Eu(thd)3 was 145 °C. Pulse durations for the deposition of Eu2O3 layers were 1.5/1/4/1.5 s for Eu(thd)3/purge/O3/purge, respectively. For TiO2, pulse durations were 0.95/2/1/1.5 s for TiCl4/purge/H2O/purge, while for the deposition of phosphate, a pulse duration of 2/3/0.5/2/0.5/2 s for Me3PO4/purge/H2O/O3 + H2O/H2O/purge was used. The Me3PO4 was kept at room temperature and assisted with N2 carrier gas. The europium and titanium processes were previously described by Hansen et al.,24 while the phosphate process was previously described by Gandrud et al.29 and all the process parameters were chosen to be well within saturating conditions according to prior investigations of these binary systems on the same equipment.
The thickness of the native oxide layer on the silicon substrates ranged from 2–4 nm and was measured by spectroscopic ellipsometry before each deposition.
For each deposition, the following substrates were used: one 3 × 3 cm2 Si substrate for X-ray fluorescence purpose, ten 0.5 × 0.5 cm2 Si substrates for annealing purposes and photoluminescence measurements, and two 4 × 0.5 cm2 Si substrates placed at the back and front of the reaction chamber to monitor the conformality of the films across the whole chamber.
The produced layers will in this article be referred to as EPO and TPO for europium phosphate and titanium phosphate layers respectively, with an EPO cycle consisting of one europium oxide cycle followed by one phosphate cycle. Similarly, TPO cycles are constructed from one titanium oxide cycle followed by a phosphate cycle. A complete cycle will thus be referred to as an MP-cycle, where M can be either Eu or Ti.
The composition of the samples was controlled by adjusting the EPO![[thin space (1/6-em)]](https://www.rsc.org/images/entities/char_2009.gif) :
:![[thin space (1/6-em)]](https://www.rsc.org/images/entities/char_2009.gif) TPO cycle ratio, e.g. 30 pulse% EPO was achieved by three pulses of EPO and seven pulses of TPO. The pulses were alternated in such a way that that the EPO cycles were as evenly distributed between the TPO cycles as possible. N pulse% EPO will be abbreviated N EPO from here on.
TPO cycle ratio, e.g. 30 pulse% EPO was achieved by three pulses of EPO and seven pulses of TPO. The pulses were alternated in such a way that that the EPO cycles were as evenly distributed between the TPO cycles as possible. N pulse% EPO will be abbreviated N EPO from here on.
The film thickness was kept to ca. 100 nm in order for this parameter to have minimal impact on the properties of interest.
The crystallinity of the samples was determined with a Bruker D8 Discovery X-ray diffractometer, using CuKα1 radiation and a Ge(111) monochromator. The film thickness, extinction coefficient and refractive index were determined with a J. A. Woollam variable angle spectroscopic ellipsometer (VASE) in the 270–1000 nm range. The Tauc–Lorentz formalism was used to model and parameterize the ellipsometry experimental data. The model utilizes two layers, one for the substrate and one for the thin film. Surface roughness, Rq, of the as deposited samples was measured with a Park XE70 atomic force microscope (AFM) in tapping mode over a 5 × 5 μm2 area and with a scan rate of 0.4 Hz. The chemical composition was determined by X-ray fluorescence (XRF) on a Phillips PW2400 Spectrometer and interpreted with the Uniquant analysis software. Photoluminescence (PL) measurements were performed with a 325 nm, CdHe laser with a power of 0.16 W mm−2 and a USB4000 photospectrometer from OceanOptics in the 350–1000 nm range. The emission spectra are not calibrated for the detector sensitivity. For recording photoluminescence excitation spectra (PLE) and performing quantum efficiency measurements we used an Edinburgh Instruments FLS920 fluorescence spectrometer, using a 450 W Xe lamp as excitation source and a Hamamatsu R928 PMT with a grating blazed at 300 nm for detection. The quantum efficiency measurements were performed on samples deposited on silica substrates, using an integrating sphere. PL decay measurements were performed with an optical parametric oscillator (OPO) system (Opotek HE 355 II) pumped by the third harmonic of a Nd:YAG laser as excitation source. For the PL decay measurements, the OPO system was set at λexc = 355 nm, with a repetition rate of 20 Hz. The PL decay was recorded with the same equipment used for the excitation measurement.
The PL data shown in Fig. 5 was recorded with 20 s integration time after an initial 1–2 s of laser exposure, and averaged over two spots near the centre of the sample. The emission in general appeared to be independent of where the beam hit the sample with the exception of the edges and some of the samples annealed at 800–1000 °C, which is expected to be due to variance in surface roughness across the sample surface after being exposed to high temperatures. This is thus not expected to impact the conclusions drawn in this study.
A SU8230 field emission scanning electron microscope (FE-SEM) from Hitachi was used to study the surface morphology.
The 0.5 × 0.5 cm2 substrates for the various compositions were annealed inside an open quartz ampoule in air in a tube furnace for 10 min at 400, 500, 600, 700, 800 and 1000 °C.
Results and discussion
At a deposition temperature of 300 °C, the deposition rate of EPO and TPO was determined to be 1.0 Å per MP-cycle and 0.8 Å per MP-cycle respectively. The cation concentrations and deposition rate of the as deposited samples are shown in Fig. 1. The thin films all appear to be conformal across the whole deposition chamber and the surface roughness, Rq, of all samples is less than 0.4 nm, as determined by AFM. Additional information about number of regular cycles, thickness, cation concentrations, and roughness of the samples is provided in Table S1.† XRD was performed to obtain structural information about the samples, and revealed that all of them were amorphous as deposited (300 °C). A few samples showed signs of crystallization at 900 °C, though most did not appear to crystallize before being annealed at 1000 °C (Fig. S1†), which is expected to be due to the lack of a stable Eu–Ti–P–O phase. The samples may contain grains too small to be detected in θ–2θ geometry at temperatures lower than what we observe by XRD, as small grains were observed by AFM for some samples below 1000 °C (Fig. S2 and S3†). Fig. 2 shows diffraction patterns for all compositions annealed at 1000 °C. All the peaks in the pattern of the sample containing 80 EPO were found to correspond to the EuPO4 phase30 (Fig. S4†), indicating that all the peaks from 50–90 EPO that overlap with these peaks also originate from this phase. The small peak observed at 53° for the 60 and 70 EPO samples could also belong to EuPO4, though various titanium oxide phases also have a reflection at this point, making it unclear which phase is responsible. The peak at ∼25° of the samples containing 20–40 EPO corresponds to anatase TiO2.31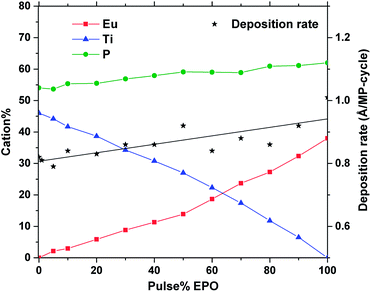 | ||
| Fig. 1 Cation% and deposition rate vs. pulse% EPO of as deposited samples, as determined by XRF and ellipsometry. | ||
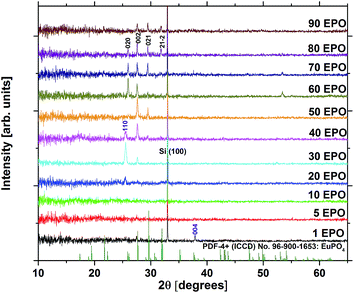 | ||
| Fig. 2 X-ray diffraction patterns of all compositions annealed at 1000 °C. EuPO4 reflections are highlighted in black, while anatase TiO2 reflections are highlighted in purple. | ||
The extinction coefficient, k, and refractive index, n, are important parameters that describe how the samples interact with light and are crucial in determining whether the material can be used for applications, such as a conversion layer for solar cells. Approximations of these parameters were determined for the as deposited samples using ellipsometry and the resulting data are presented in Fig. 3. It is evident that both n and k increase with increased TPO pulsing, demonstrating that the growth can be controlled by ALD. The UV-absorption is rather weak, particularly for samples with low Ti-content, which means that a thick layer would be required for applications where UV to visible conversion is desired.
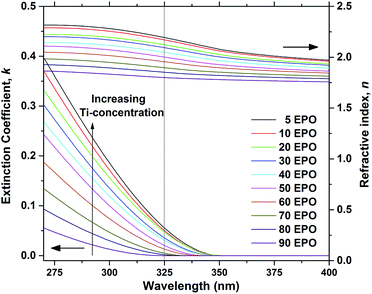 | ||
| Fig. 3 Extinction coefficient, k, and refractive index, n, as a function of wavelength, shown for as deposited samples. The dotted line shows the wavelength of the laser used in the PL measurements. | ||
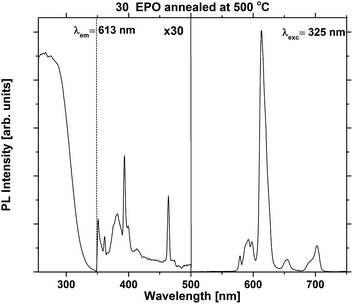
The excitation and emission spectra were recorded in order to compare the shape and emission intensity of the samples. This is shown for one of the most emissive samples in Fig. 4. The shape of the spectrum was identical for all the as deposited samples (Fig. S5 and S6†), suggesting that the local coordination around Eu3+ is independent of composition for this set of samples. Additional excitation and emission spectra for samples annealed at 500 °C can be found in Fig. S7.†
Fig. 5 shows the total emission intensity of every sample plotted against the pulse% EPO and annealed at increasing temperatures up to 800 °C. The overall trend appears to be that annealing at 500–700 °C increases the luminescence of every sample significantly, while annealing at 800 °C quenches it. The photostability under UV or X-ray illumination of the as deposited samples and the samples annealed at 400 °C was poor in general (Fig. S8†), particularly for the samples with 30 EPO or less. The long integration time required to obtain reproducible results (20 s) thus had a significant impact on the detected emission from these samples. The luminescence of the samples could be completely recovered by tempering at 300 °C for 1 h, proving the process to be reversible (Fig. S9†). Reversible photostructural effects are well documented in amorphous chalcogenides,27,32 and has previously been observed in amorphous Sb2O3–SbPO4,26 as well as crystalline Tb3Ga5O12:Eu3+.33 The mechanisms governing these processes are not fully understood and several models have been proposed,26,27 though, it has not been possible to verify if the EPO–TPO system follows any of these models. The emission did not recover by keeping the samples in the dark for any amount of time. No Eu2+ emission could be detected and no change in colour or refractive index could be observed after the bleaching. It is, however, our interpretation that both P and Ti are involved in the process, as the bleaching is most prominent in samples with high Ti concentrations and the effect was not observed for any of the europium titanate samples investigated in our previous work.23,24 This indicates that phosphorous is required for the process to take place, either directly or indirectly by increasing the disorder.
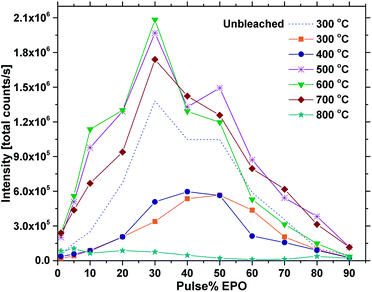 | ||
| Fig. 5 Total PL intensity vs. pulse% EPO for samples annealed at different temperatures (300 °C is as deposited) at 325 nm excitation. | ||
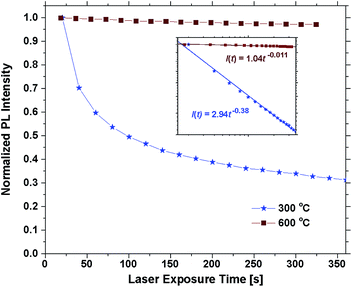
Annealing the samples at 400 °C had no effect on the emission of some samples and only a slight effect on others. The photostability was still poor and differences between 300 °C are mainly attributed to uncertainty related to the bleaching effect. Annealing at 500 °C or above resulted in a sharp increase in the photostability. Fig. 6 shows the emission intensity of the 30 EPO sample plotted against the laser exposure time. It is evident that the photostability is dramatically increased after annealing at 600 °C for 10 min, though, the samples are not perfectly photostable and still bleach gradually over time (Fig. S10†). The inset shows a log–log plot that can be used to determine the bleaching rate, β, defined by:
| I(t) = I0t−β, |
| EPO | 5 | 10 | 20 | 30 | 40 | 50 | 60 | 70 | 80 |
| β | 0.48 | 0.46 | 0.44 | 0.38 | 0.28 | 0.21 | 0.20 | 0.10 | 0.03 |
The most important factors that impact the luminescence, and consequently help explain the observations in Fig. 5, are expected to be the energy transfer rate from the (TiO6)8− complex to Eu3+, and from Eu3+ to Eu3+, as well as the symmetry around Eu3+ and the amount of quenching centres in the material. As the shape of the emission is identical for all the as deposited samples, the symmetry cannot explain the differences in emission intensity. The energy transfer rates, however, are highly dependent on the distance between the involved atoms and should vary significantly between the samples. The distances can be challenging to determine in amorphous materials, but can nevertheless be estimated in materials made by ALD. The Eu–Eu distance from a single Eu(thd)3/O3 cycle in the plane of the surface is for instance easily approximated by the size of the organic ligands, which in this case is slightly above 1 nm.34 The longest distance at which efficient energy transfer between two dipoles takes place, i.e. the Förster radius, R0, is only a few angstroms for the Eu3+–Eu3+ couple35,36 and amorphous mixtures of Eu and Ti have previously been shown to be resistant to concentration quenching23,37 due to this. It follows that several consecutive EPO cycles would be required for the Eu–Eu distance to be reduced below R0.
The lifetime of the excited state is very sensitive to all kinds of quenching, including concentration quenching, and it could thus be used to determine how many consecutive EPO cycles can be deposited before concentration quenching becomes dominant. Fig. 7 shows PL decay measurements of the as deposited samples. It is evident that the lifetime of the 80 and 90 EPO samples is severely reduced compared to the samples with less EPO. 80 EPO corresponds to a 1![[thin space (1/6-em)]](https://www.rsc.org/images/entities/char_2009.gif) :
:![[thin space (1/6-em)]](https://www.rsc.org/images/entities/char_2009.gif) 4 pulse ratio of TPO and EPO, i.e. four consecutive EPO cycles. With a deposition rate of ∼0.8 Å per MP-cycle this should correspond to slightly more than a monolayer. A 1
4 pulse ratio of TPO and EPO, i.e. four consecutive EPO cycles. With a deposition rate of ∼0.8 Å per MP-cycle this should correspond to slightly more than a monolayer. A 1![[thin space (1/6-em)]](https://www.rsc.org/images/entities/char_2009.gif) :
:![[thin space (1/6-em)]](https://www.rsc.org/images/entities/char_2009.gif) 3 pulse ratio of TPO and EPO thus appears to be the limit before concentration quenching becomes dominant. The samples with 5–40 EPO have a fast decaying component hardly noticeable in the 50–90 EPO samples, and can only be fitted with a biexponential decay function (Fig. S12†), while the 50–90 EPO samples can be fitted to a single exponential decay function (Fig. S13†).
3 pulse ratio of TPO and EPO thus appears to be the limit before concentration quenching becomes dominant. The samples with 5–40 EPO have a fast decaying component hardly noticeable in the 50–90 EPO samples, and can only be fitted with a biexponential decay function (Fig. S12†), while the 50–90 EPO samples can be fitted to a single exponential decay function (Fig. S13†).
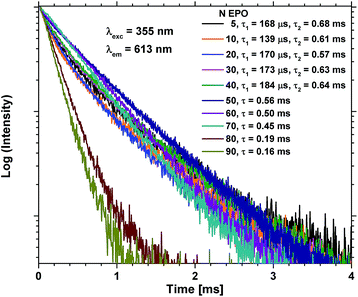 | ||
| Fig. 7 PL decay measurements of as deposited samples with 5–90 EPO. 5–40 EPO were fitted using a biexponential decay function (Fig. S12†), while 50–90 EPO were fitted using a single exponential decay function (Fig. S13†). | ||
The Ti–Eu distance should decrease with increased EPO content, and the ideal pulse ratio required in order to achieve optimal energy transfer between (TiO6)8− and Eu3+, while also avoiding concentration quenching, should thus be 1![[thin space (1/6-em)]](https://www.rsc.org/images/entities/char_2009.gif) :
:![[thin space (1/6-em)]](https://www.rsc.org/images/entities/char_2009.gif) 3 between EPO and TPO (i.e. 75 EPO should be ideal). For ∼100 nm thickness films we observe that 30 EPO displays the strongest emission intensity, however, from the ellipsometry measurements in Fig. 3, it is evident that absorption is a limiting factor for the observed emission in these samples, particularly for samples with low Ti-concentrations. By taking the absorption into account, the relative emission intensities become shifted towards higher EPO, as shown in Table 2. With a sufficiently thick film the 70 EPO sample is expected to exhibit the strongest emission, in agreement with the PL decay measurements. Samples with less than 30 EPO also display a sharply reduced emission. This suggests that energy transfer from (TiO6)8− is reduced when depositing more than 3 consecutive cycles of TPO.
3 between EPO and TPO (i.e. 75 EPO should be ideal). For ∼100 nm thickness films we observe that 30 EPO displays the strongest emission intensity, however, from the ellipsometry measurements in Fig. 3, it is evident that absorption is a limiting factor for the observed emission in these samples, particularly for samples with low Ti-concentrations. By taking the absorption into account, the relative emission intensities become shifted towards higher EPO, as shown in Table 2. With a sufficiently thick film the 70 EPO sample is expected to exhibit the strongest emission, in agreement with the PL decay measurements. Samples with less than 30 EPO also display a sharply reduced emission. This suggests that energy transfer from (TiO6)8− is reduced when depositing more than 3 consecutive cycles of TPO.
| EPO | 5 | 10 | 20 | 30 | 40 | 50 | 60 | 70 | 80 |
| Ir | 0.05 | 0.08 | 0.26 | 0.69 | 0.52 | 0.77 | 0.84 | 1 | 0.73 |
Annealing at 500–700 °C could have a positive effect on the emission beyond reducing the bleaching, provided that the approximation of the emission of the unbleached samples is valid. This would indicate that a change beyond increased photostability takes place. Fig. 8 shows that the lifetime of a sample with 40 EPO is increased after annealing at 500–700 °C and is strongly correlated to the detected emission intensities (a similar measurement of a 30 EPO sample can be found in Fig. S14†). The radiative lifetime is sensitive to quenching of any kind as well as the local symmetry around Eu3+. As the emission from the 5D0 → 7F2 is hypersensitive to the local symmetry around Eu3+, the shape of the emission spectrum can be used to determine whether a change in symmetry actually occurs. Fig. 9 shows that the shape of the PL emission of samples containing 40 EPO and annealed at different temperatures remains constant up to 800 °C. At that point a shoulder appears in the 5D0 → 7F2 peak (perhaps more obvious in Fig. S15†), while annealing beyond this quenches the luminescence. The increased lifetime observed after annealing at 500–700 °C can consequently only be due to a reduction in luminesce quenching. As concentration quenching should not be relevant for this sample and Eu-diffusion would result in an observable change in local coordination, it is our interpretation that the increased lifetime must be due to a reduction in the number of quenching sites, or access to these. As the emission rate of the unbleached samples is similar to the samples annealed at 500 °C, where bleaching takes place at a considerably slower rate, it appears that the bleaching is related to these quenching sites. Annealing at 500–700 °C removes a number of the quenching sites and thus also reduces the bleaching.
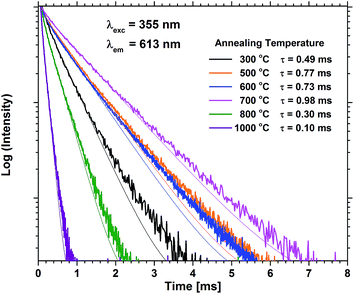 | ||
| Fig. 8 PL decay measurements of samples containing 40 EPO for various annealing temperatures. τ is the lifetime obtained by fitting to a single exponential decay function. | ||
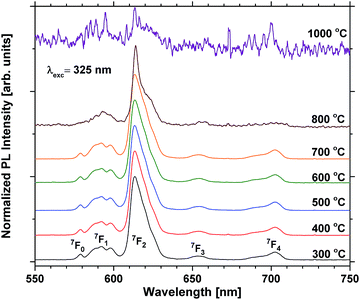 | ||
| Fig. 9 Normalized PL scans of samples containing 40 EPO. The peaks are a result of emission from the 5D0 state to the states shown in the figure. | ||
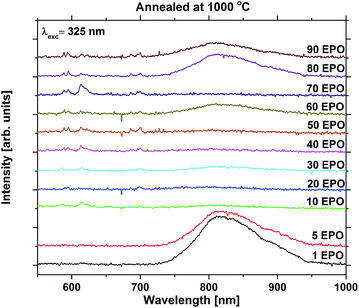
For the high temperature annealed samples, the exact crystallographic and chemical changes are important factors, and the discussion of emission efficiencies of these samples is more complex. The reduced emission intensity and lifetime observed at 800 °C are interpreted as an increase in the non-radiative decay rate, possibly due to concentration quenching. The change in symmetry around Eu3+ is indicative of Eu3+ diffusion taking place, probably reducing the Eu–Eu distance. The shoulder present at 800 °C was also observed for all the other samples annealed at the same temperature whose emission could be detected, apart from the sample with 1 EPO (Fig. S16 and S17†). This sample displayed a broad emission in the NIR range, which was enhanced dramatically when the sample was annealed at 1000 °C. This also becomes apparent for some of the other samples, as can be seen in Fig. 10. The NIR emission is most prominent in the samples containing, 1, 5, 60, 80 and 90 EPO, and noticeable in the sample containing 30 EPO. This could be caused by luminescence of rutile TiO2, which can luminesce at around 850 nm.38 As the observed emission is not due to an f–f transition, the emission wavelength is strongly affected by the surrounding ligands and it is thus not possible to deduce what kind of titanium phase is actually responsible. The presence of this luminescence implies, however, that some of the titanium ions no longer transfer their energy to nearby europium ions, indicating that the distance between europium and titanium has become too large for efficient energy transfer to take place.
NIR emission has also previously been reported in KTiOPO4,39 and the NIR emission was enhanced by europium doping. The Eu3+ emission observed is similar in shape to EuPO4 emission40 (Fig. S18†) for all samples, except for the 10 and 70 EPO sample, whose emission still resembles that of the as deposited samples. These samples do not exhibit any NIR emission, which implies that energy transfer still takes place for these samples. As the XRD pattern shows that the EuPO4 phase is present in most of the samples that have been annealed at 1000 °C, and the samples display broad luminescence, which f–f transitions do not display, it can be concluded that most of the Ti and Eu atoms have segregated and formed separate phases. As the separation between Eu-atoms in crystalline EuPO4 is only a few angstroms, the concentration quenching should be very efficient. Combined with a very narrow absorption, the formation of crystalline EuPO4 is expected to be extremely weak. This explains the dramatic drop in the luminescence intensity at 1000 °C, and could also have an effect on the samples annealed at 800 °C.
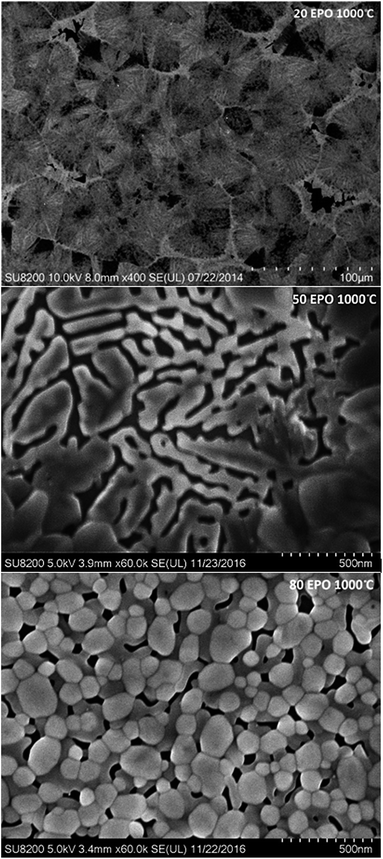
Diffusion of the various elements in the sample is expected to cause significant changes in the morphology. The samples were consequently investigated with FE-SEM to obtain a better understanding of the processes taking place during annealing. The samples containing 20, 50 and 80 EPO and annealed at 1000 °C, illustrate the phase separation taking place during annealing at this temperature, which is presented in Fig. 11. The image of the sample with 20 EPO exhibits dendritical growth from nucleation centres. This is typical when growth is limited by diffusion of a component in surplus, like the titanium phase in this case. The 50 EPO sample appears to exhibit some dewetting of the film. The reason for this is not clear, but it could be associated with the high atomic mobility of the oxide phases at this temperature. The 80 EPO sample is typical of all the samples with >50 EPO, in which most of the materials have crystallized, which XRD analysis confirms to be EuPO4.
Quantum efficiency measurements performed on samples with 30–60 EPO deposited on fused silica and annealed at 300–600 °C, revealed that the sample with 60 EPO and annealed at 600 °C displayed the highest quantum yield of ∼6%. A sample with 70 EPO would likely display a very similar quantum yield, possibly slightly higher. As the lifetime after annealing at 500–700 °C is similar to Eu3+ in materials with much higher quantum yields,36,41 it is our interpretation that most of the energy is lost before it is transferred to Eu3+. The NIR-emission observed in the samples annealed at 1000 °C indicate that the Stokes shift of (TiO6)8− could be large in this system and can thus easily be quenched.
Summarising the results so far, it appears that photobleaching, possibly related to photostructural changes, dominates the emission signal for the as deposited samples. The material becomes resistant to this upon annealing at 500 °C, and combined with a reduction in the number of quenching sites, it results in significantly increased emission rates. Between 500–700 °C there are only slight changes for most samples, but above 700 °C, migration of most mobile elements, most likely titanium and possibly europium, cause the symmetry around Eu3+ to change, also accompanied by a reduction in emission rate and lifetime of the Eu3+ emission. The migration of these elements allows for various crystalline phases, as well as grain boundaries between them, to form, which results in reduced Eu–Eu distances and increased Ti–Eu distances, reducing the energy transfer rate between them, which results in NIR emission from the titanium phase.
While the quantum efficiency is too low for most applications, amorphous Eu–Ti–P–O thin films still offers some unique and interesting properties, like tuneable bleaching and emission that could potentially be exploited in future applications.
Conclusion
Through this work we have demonstrated that the EPO–TPO growth can be controlled by ALD. The optimal pulse ratio of EPO and TPO with respect to emission intensity with 325 nm excitation was found to be 3![[thin space (1/6-em)]](https://www.rsc.org/images/entities/char_2009.gif) :
:![[thin space (1/6-em)]](https://www.rsc.org/images/entities/char_2009.gif) 7 for ∼100 nm thickness films, though 7
7 for ∼100 nm thickness films, though 7![[thin space (1/6-em)]](https://www.rsc.org/images/entities/char_2009.gif) :
:![[thin space (1/6-em)]](https://www.rsc.org/images/entities/char_2009.gif) 3 was found to be optimal for thick films where absorption is not an issue. The optimal annealing temperature was determined to be 500–700 °C, depending on the pulse ratio. The highest measured quantum efficiency for the system was found to be ∼6% for a sample with 60 EPO annealed at 600 °C.
3 was found to be optimal for thick films where absorption is not an issue. The optimal annealing temperature was determined to be 500–700 °C, depending on the pulse ratio. The highest measured quantum efficiency for the system was found to be ∼6% for a sample with 60 EPO annealed at 600 °C.
All as deposited samples containing both Ti and Eu luminesce red light when exposed to UV, though, the emission intensity drops off rapidly when exposed to UV or X-ray radiation for a prolonged duration. The luminescence recovers when the sample is tempered. The bleaching rate can be tuned by varying the Ti-concentration in the samples, with increased bleaching rates for high Ti-concentrations. The photostability of all samples is dramatically increased by annealing at 500–700 °C. However, the luminescence is sharply reduced for all compositions when annealed at 800 °C. This has been interpreted to be due to increased diffusion of the various elements in the sample at this temperature, resulting in increased Ti–Eu distances, with an accompanied change in local coordination around Eu3+, resulting in increased local symmetry. This reduces the spontaneous emission rate due to the parity forbidden nature of the transition, resulting in significantly reduced emission rates.
After annealing the samples at 1000 °C, the Eu3+ luminescence is more or less completely quenched for all compositions due to phase separation into various crystalline phases like EuPO4 and TiO2. This causes a sharp reduction in the energy transfer between Ti- and Eu-ions in the material resulting in broad, but weak NIR-emission from the titanium for most of the compositions.
Acknowledgements
This work was performed within “The Norwegian Research Centre for Solar Cell Technology”, a Centre for Environment-Friendly Energy Research. The authors would also like to thank the Department of Geosciences, UiO, for use of the XRF equipment, the Institute for Energy Technology for use of the VASE ellipsometer, and the group of Professor Andries Meijerink at Utrecht University, for use of equipment and assistance with experiments.References
- M.-F. Joubert, Opt. Mater., 1999, 11, 181–203 CrossRef CAS.
- D. Chen, Y. Yu, P. Huang, H. Lin, Z. Shan, L. Zeng, A. Yang and Y. Wang, Phys. Chem. Chem. Phys., 2010, 12, 7775–7778 RSC.
- L. Chen, K.-J. Chen, C.-C. Lin, C.-I. Chu, S.-F. Hu, M.-H. Lee and R.-S. Liu, J. Comb. Chem., 2010, 12, 587–594 CrossRef CAS PubMed.
- D. Cavouras, I. Kandarakis, G. S. Panayiotakis, E. K. Evangelou and C. D. Nomicos, Med. Phys., 1996, 23, 1965–1975 CrossRef CAS PubMed.
- J.-C. G. Bunzli and C. Piguet, Chem. Soc. Rev., 2005, 34, 1048–1077 RSC.
- S. N. Misra, M. A. Gagnani, I. M. Devi and R. S. Shukla, Bioinorg. Chem. Appl., 2004, 2, 155–192 CrossRef CAS PubMed.
- T. Yanagida, Opt. Mater., 2013, 35, 1987–1992 CrossRef CAS.
- G. Bonnet, M. Lachkar, J. P. Larpin and J. C. Colson, Solid State Ionics, 1994, 72, 344–348 CrossRef CAS.
- K. J. Hubbard and D. G. Schlom, J. Mater. Res., 1996, 11, 2757–2776 CrossRef CAS.
- B. S. Richards, Sol. Energy Mater. Sol. Cells, 2006, 90, 1189–1207 CrossRef CAS.
- T. Trupke, A. Shalav, B. S. Richards, P. Würfel and M. A. Green, Sol. Energy Mater. Sol. Cells, 2006, 90, 3327–3338 CrossRef CAS.
- B. M. van der Ende, L. Aarts and A. Meijerink, Phys. Chem. Chem. Phys., 2009, 11, 11081–11095 RSC.
- J. Y. Chen, C. K. Huang, W. B. Hung, K. W. Sun and T. M. Chen, Sol. Energy Mater. Sol. Cells, 2014, 120, 168–174 CrossRef CAS.
- K. Hermans and B. Slager, WO2010046358A1, 2010.
- C. Wiemer, L. Lamagna and M. Fanciulli, Semicond. Sci. Technol., 2012, 27, 074013 CrossRef.
- M. Coll, J. Gazquez, A. Palau, M. Varela, X. Obradors and T. Puig, Chem. Mater., 2012, 24, 3732–3737 CrossRef CAS.
- M. Coll, J. M. Montero Moreno, J. Gazquez, K. Nielsch, X. Obradors and T. Puig, Adv. Funct. Mater., 2014, 24, 5368–5374 CrossRef CAS.
- X. Wang, L. Dong, J. Zhang, Y. Liu, P. D. Ye and R. G. Gordon, Nano Lett., 2013, 13, 594–599 CrossRef CAS PubMed.
- V. Miikkulainen, M. Leskelä, M. Ritala and R. L. Puurunen, J. Appl. Phys., 2013, 113, 021301 CrossRef.
- V. Miikkulainen, O. Nilsen, M. Laitinen, T. Sajavaara and H. Fjellvag, RSC Adv., 2013, 3, 7537–7542 RSC.
- E. Ostreng, H. H. Sonsteby, T. Sajavaara, O. Nilsen and H. Fjellvag, J. Mater. Chem. C, 2013, 1, 4283–4290 RSC.
- H. H. Sønsteby, H. FJellvåg and O. Nilsen, Adv. Mater. Interfaces, 2017, 1600903 CrossRef.
- P.-A. Hansen, H. Fjellvåg, T. G. Finstad and O. Nilsen, Chem. Vap. Deposition, 2014, 20, 274–281 CrossRef CAS.
- P.-A. Hansen, H. Fjellvag, T. G. Finstad and O. Nilsen, RSC Adv., 2014, 4, 11876–11883 RSC.
- A. C. Mendes, L. J. Q. Maia, S. H. Messaddeq, Y. Messaddeq, S. J. L. Ribeiro and M. Siu Li, Phys. B, 2011, 406, 4381–4386 CrossRef CAS.
- M. Nalin, Y. Messaddeq, S. J. L. Ribeiro, M. Poulain and V. Briois, J. Optoelectron. Adv. Mater., 2001, 3, 553–558 CAS.
- S. R. Elliott, J. Non-Cryst. Solids, 1986, 81, 71–98 CrossRef CAS.
- K. Schwartz, The Physics of Optical Recording, Springer, Berlin, 1993 Search PubMed.
- K. B. Gandrud, A. Pettersen, O. Nilsen and H. Fjellvag, J. Mater. Chem. A, 2013, 1, 9054–9059 CAS.
- Y. Ni, J. M. Hughes and A. N. Mariano, Am. Mineral., 1995, 80, 21–26 CAS.
- G. L. Breneman and R. D. Willett, Acta Crystallogr., 1967, 23, 334 CrossRef CAS.
- Y. Kuzukawa, A. Ganjoo and K. Shimakawa, J. Non-Cryst. Solids, 1998, 227–230, 715–718 CrossRef CAS.
- K. Sawada and S. Adachi, J. Appl. Phys., 2015, 118, 103106 CrossRef.
- R. Metzger, C. Werner and A. Spitzer, Thin Solid Films, 2000, 365, 242–250 CrossRef CAS.
- Z. Wang, J. Zhong, H. Liang and J. Wang, Opt. Mater. Express, 2013, 3, 418–425 CrossRef CAS.
- M. Janulevicius, P. Marmokas, M. Misevicius, J. Grigorjevaite, L. Mikoliunaite, S. Sakirzanovas and A. Katelnikovas, Sci. Rep., 2016, 6, 26098 CrossRef CAS PubMed.
- J. Ovenstone, P. J. Titler, R. Withnall and J. Silver, J. Mater. Res., 2002, 17, 2524–2531 CrossRef CAS.
- X. Wang, Z. Feng, J. Shi, G. Jia, S. Shen, J. Zhou and C. Li, Phys. Chem. Chem. Phys., 2010, 12, 7083–7090 RSC.
- O. Plantevin, E. Oliviero, G. Dantelle and L. Mayer, Nucl. Instrum. Methods Phys. Res., Sect. B, 2014, 326, 106–109 CrossRef CAS.
- J. Dexpert-Ghys, R. Mauricot and M. D. Faucher, J. Lumin., 1996, 69, 203–215 CrossRef CAS.
- Y. Huang, Y. Nakai, T. Tsuboi and H. J. Seo, Opt. Express, 2011, 19, 6303–6311 CrossRef CAS PubMed.
Footnote |
| † Electronic supplementary information (ESI) available. See DOI: 10.1039/c6ra27644j |
| This journal is © The Royal Society of Chemistry 2017 |

