 Open Access Article
Smartphone-based fluorescence detection of bisphenol A from water samples†
Katherine E. McCracken a,
Trinny Tatb,
Veronica Pazb and
Jeong-Yeol Yoon
 *ab
*ab
aDepartment of Agricultural & Biosystems Engineering, The University of Arizona, Tucson, Arizona 85721, USA
bDepartment of Biomedical Engineering, The University of Arizona, Tucson, Arizona 85721, USA. E-mail: jyyoon@email.arizona.edu
First published on 30th January 2017
Abstract
Bisphenol A (BPA), an emerging environmental contaminant and endocrine disrupting compound, has been observed globally in surface water and waste leachates at concentrations that are hazardous to aquatic life and potentially to humans. Limitations in field monitoring on account of the extensive laboratory infrastructure required for standard BPA detection warrants investigation into portable or handheld sensing platforms. In this work, we evaluated a standalone smartphone-based fluorescence sensing method for identifying BPA from water samples. Toward this goal, we demonstrated the novel application of 8-hydroxypyrene-1,3,6-trisulfonic acid (HPTS) as a fluorescent probe with suitable specificity to BPA compared to functionally and structurally similar hormone and endocrine disrupting compounds. Using this method, bisphenol A was quantifiable through both standard fluorescence spectroscopy and smartphone detection, with an empirical binding constant of KSV = 2040 M−1 and a direct, unfiltered detection limit of 4.4 μM from unprocessed samples, suitable for waste leachate and industrial samples. Implementation of further digital image processing and smartphone spectroscopy methods may help to lower this detection limit, bearing promise for future direct detection of bisphenol A from wastewater leachate and environmental samples via smartphones.
1. Introduction
Concerns for bisphenol A (BPA) as an emerging contaminant have risen over the past forty years due to its growing use in industrial applications and its unfolding environmental health effects. As an endocrine disrupting compound (EDC), BPA exhibits weak estrogenicity leading to systemic, developmental, and reproductive toxicant effects in animals and potentially in humans.1–3 An estimated 6 million tons of BPA are produced annually, with growth forecasts as high as 11% by 2020.4,5 This immense production volume can be attributed to heavy demands in industrial manufacturing of epoxy resins and polycarbonate plastics, which are used extensively, particularly in food and drink packaging, due to their favorable heat-resistance, shatter-resistance, and transparency.6 The U.S. Food and Drug Administration has estimated that food and beverage contact alone results in a mean daily BPA exposure of 0.2 μg per kg of bodyweight in Americans aged 2 and older, and up to 0.5 μg per kg of bodyweight in children between 1 and 2 years old.7 Furthermore, biomonitoring studies have found evidence of sequestration following exposure, with detectable levels of BPA seen in the urine of an estimated 93% of Americans ages six years and older.8,9 In rodents, long-term oral exposure to BPA has been linked to mammary cancer, and high-concentration perinatal oral exposure (50 mg per kg per day) has been linked to abnormal uterine development and estrogen receptor expression, although only modest effects have been seen on other circulating hormone activity post-birth for lower doses (0.4 mg per kg per day).10,11However, as the human enterohepatic system is better able to excrete BPA than many other organisms, concerns for bioaccumulation and endocrine disruption are more immediate for sensitive aquatic ecosystems, with adverse effects seen on crustaceans, amphibians, and fish at much lower exposure levels.12,13 BPA concentrations of even less than 5 μg per L in the surrounding environment have been linked to metamorphosis and developmental inhibition in amphibian and copepod species, reduction in trout fertility, and sex hormone or cell changes in fish and mollusk species.13–19 Amid these heightened risks, an estimated 1 million pounds of BPA is released into the environment annually, leading to BPA concentrations in wastewater effluent and urban surface waters that can exceed zero-effect limits by as much as 50–80%.1,20,21
Current standard detection methods for BPA from environmental water samples include reversed-phase high-performance liquid chromatography (HPLC) with mass spectrometry (MS) detection (ASTM D7574-09) or gas chromatography (GC) with MS detection (EPA Method 8270D).22–24 These methods identify the BPA fingerprint as compared with a known pure BPA calibration standard, typically at a concentration near 4 μM.5 While these provide sensitive quantification of contaminants, they also require substantial instrumentation and subsequent human labor and data analysis, such that their use is typically confined to a centralized laboratory space. These limitations restrict immediate in-field quantification of BPA by standard methods.
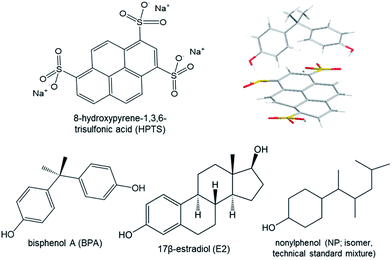
With an interest in future portable BPA monitoring, we investigated a novel fluorescent probe for BPA, 8-hydroxypyrene-1,3,6-trisulfonic acid (HPTS), and its prospective use in real-time, mobile sample analysis when paired with smartphone-based detection. Previous research has demonstrated HPTS quenching by electron transfer with viologen moieties and in π-bond interactions with other aromatic compounds, including caffeine, theobromine, and theophylline.25–28 Based on these electron-transfer binding interactions confirmed previously through fluorescence and NMR titration and corroborated with cyclic voltammetry or mathematical modelling, we hypothesized that HPTS fluorescence may be quenched through a similar binding complex with BPA, and that this may be distinguishable from quenching by similarly structured EDC and hormone comparators. To answer this, we investigated the BPA–HPTS binding interaction in contrast with the binding interactions of 17β-estradiol (E2), a natural estrogen, nonylphenol (NP), a structurally similar suspected endocrine disruptor, and nonspecific compounds in wastewater effluent (Fig. 1). Additionally, we also investigated the application of standalone smartphone fluorescence detection, including a comparison between separate smartphone light sources (for fluorescence excitation) and camera hardware (for fluorescence detection). With a growing diversity of smartphone technology available worldwide, we sought to examine the potential soundness and universality of such smartphone sensing methods for future field-deployable BPA monitoring.
2. Materials & methods
2.1 Reagents
All chemicals, including bisphenol A (BPA), 17β-estradiol (E2), nonylphenol (NP; PESTANAL® standard technical mixture), and 8-hydroxypyrene-1,3,6-trisulfonic acid (HPTS), were acquired from Sigma-Aldrich (St. Louis, MO, USA). Separate aqueous stock solutions were created for BPA (438 μM), E2 (5.5 μM), NP (454 μM), and HPTS (100 mM; pH 6.5 phosphate buffer).2.2 Fluorescence titration and Stern–Volmer modeling
Fluorescence and ultraviolet-visible spectroscopy were used to investigate the hypothesized interaction and binding complex between HPTS and BPA, and to evaluate the specificity of this interaction by comparison to those with E2 or NP. Fluorescence spectra were collected following excitation at λex = 460 nm, and quenching was measured based on emission at λem = 512 nm for serial additions of BPA (100 μL increments, total [BPA] = 0–88 μM) into 10 mM HPTS (pH 6.5, 22 °C), controlling for HPTS concentration and volume (ESI). These excitation and emission wavelengths were selected based on previous work with caffeine quenching of HPTS by Rochat et al. and experimental confirmation of maximal quenching under these conditions with BPA.28 Changes in UV absorbance peaks at 225 nm and 278 nm were measured using a UV-visible broad spectrum light source and were used to confirm the increasing concentration of BPA during fluorescence titration (data not shown).Fluorescence measurements were collected at 90° with respect to the incident 460 nm light emitting diode (LED) excitation source, and absorbance measurements were collected at 0° with respect to the broad spectrum light source (USB-ISS-UV-VIS model; 200–1100 nm; Ocean Optics, Inc, Dunedin, FL, USA). Measurements were taken in a quartz cuvette (path length = 1 cm) using a USB4000 spectrometer running OceanView version 1.4.1 software (Ocean Optics, Inc, Dunedin, FL, USA). Fluorescence quenching was calculated as F0/F, where F0 is the fluorescence intensity measured from a 10 mM HPTS and deionized (DI) water mixture, and F is the same measurement from a 10 mM HPTS and aqueous target (i.e. BPA, E2, or NP) mixture.
The Stern–Volmer dynamic quenching interaction for each mixture was modeled at λem = 512 nm and the Stern–Volmer binding constant (KSV) was derived from a least-squares fitted linear regression model of the observed quenching (F0/F) of HPTS versus the target BPA, E2, or NP concentration (Q) (eqn (1)). Experiments were conducted in triplicate.
| F0/F = 1 + KSV[Q] | (1) |
As a further test of specificity, the BPA–HPTS quenching interaction was also evaluated in treated municipal wastewater effluent samples through fluorescence spectroscopy. Effluent was collected from a wastewater treatment facility servicing Tucson, AZ, USA (25 MGD) and was divided into three samples: an unfiltered effluent sample, a syringe-filtered effluent sample (surfactant-free cellulose acetate membrane, 0.2 μm pore size; Sartorius Stedim Biotech GmbH, Goettingen, Germany), and a syringe-filtered effluent sample spiked with 45 μM BPA prior to filtration. A 45 μM BPA sample was prepared in DI water for comparison, and a DI water reference sample was used as a baseline for quenching measurements. All samples were prepared with 10 mM HPTS and quenching was measured as before.
2.3 Fluorescence spectroscopy with a single smartphone excitation source
Fluorescence quenching of HPTS was then re-evaluated using a smartphone LED flash as the excitation source. Two smartphones were compared: the iPhone 5s (Apple, Cupertino, CA, USA) and the Nexus 5X (Google, Mountain View, CA, USA). For fluorescence spectroscopy, the LED flash source of each phone was fixed in turn at a 15 mm distance from a quartz cuvette, and a spectrometer probe was fixed at 90° with respect to the incident flash. Samples of 10 mM HPTS were mixed separately with increasing sample concentrations of BPA (0–220 μM), E2 (0–3.7 μM), and NP (0–45 μM). The range of these concentrations were determined from the maximum aqueous solubility and typical concentrations in environmental samples.29–31 Quenching was observed based on fluorescence measurements at λem = 512 nm.2.4 Fluorescence sensing with smartphone excitation and detection
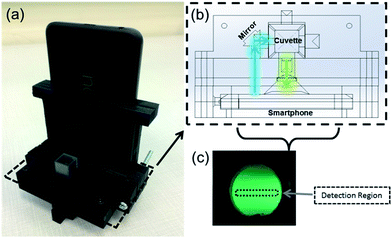
Finally, both smartphones were evaluated as standalone fluorescence sensors, with the LED flash serving as an excitation source and the rear camera complementary metal-oxide-semiconductor (CMOS) sensor functioning as a fluorescence detector. Dual smartphone and single smartphone detection systems were evaluated for the iPhone 5s and Nexus 5X, respectively.In the dual smartphone detection system, one iPhone 5s was used as the excitation source while another was set at 90° to the first, serving as the detector. In the single smartphone detection system, the LED flash was isolated from the camera of a single Nexus 5X using a 3D-printed cuvette-holder attachment. In this attachment, a mirror (reflectance > 96%) was used to redirect the incident light through a sample cuvette at 90° to the smartphone camera. In both the single smartphone and the dual smartphone systems, the LED flash and camera were each fixed at 15 mm from the cuvette, with an achromatic doublet lens (diameter = 10 mm, focal length = 15 mm; Thorlabs, Inc., Newton, NJ, USA) between the sample cuvette and smartphone camera lens to reduce chromatic aberration. Samples of 10 mM HPTS were mixed separately with the same sample concentrations of BPA (0–220 μM), E2 (0–3.7 μM), NP (0–45 μM), and RGB images were collected on each smartphone. These images were processed through ImageJ (National Institutes of Health, USA), in which the green band was separated from the full RGB image. The green fluorescence intensity was measured as the mean pixel intensity value of a pre-specified detection region from this image (100–500 pixels). Quenching was calculated as before based on these fluorescence measurements.
3. Results & discussion
3.1 Dynamic quenching of HPTS by BPA
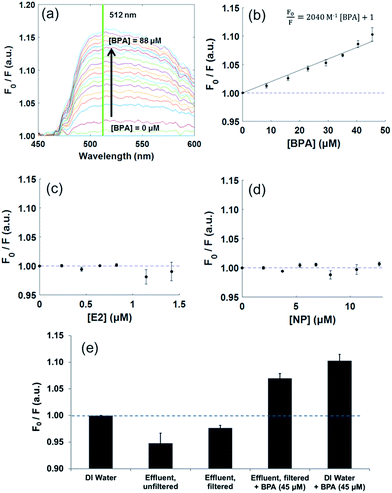
The binding complex between HPTS and BPA was evaluated by fluorescence spectroscopy and Stern–Volmer modeling. This binding model was structured based on previous work by Rochat et al., which evaluated the dynamic quenching of HPTS by purines, including caffeine, theobromine, and theophylline.28Through fluorescence spectroscopy (λex/em = 460/512 nm), an increase in quenching (F0/F) was measured for HPTS (10 mM) in the presence of increasing BPA concentrations (0–88 μM), with a detection limit of 4.4 μM (Fig. 2a). A Stern–Volmer plot derived for the same interaction revealed an empirical binding constant of 2040 M−1 (Fig. 2b).
To evaluate the specificity of this interaction, similar measurements were collected for HPTS with increasing concentrations of E2 and NP. No significant change in HPTS fluorescence was observed for the range of concentrations tested, suggesting reasonable specificity of HPTS to BPA among similarly structured compounds (Fig. 2c and d). Further, no nonspecific quenching was observed with HPTS when samples were prepared in municipal wastewater effluent (Fig. 2e). Although particulate matter within a raw sample appeared to contribute to fluorescence near 512 nm, this fluorescence was reduced by sterile filtration and quenching was still observed in BPA samples.
The observed HPTS quenching response with BPA in DI water was greater than that observed and reported elsewhere for interactions with caffeine (KSV = 212 M−1), theobromine (KSV = 113 M−1), and theophylline (KSV = 148 M−1), supporting at least the feasibility of this exploratory sensing method.28
Using HPTS, BPA is directly quantifiable at concentrations suitable for screening higher-concentration point source contamination from industrial sources or landfill leachates, which may exceed 13–22 μM at their upper limits.32 Following primary sample processing through a suitable membrane material and application of fluorescence signal enhancement techniques, HPTS may have potential as a probe for BPA concentrations in surface waters, with are 10–100× lower.33–35 HPTS also holds promise in its tentative specificity compared to structurally similar aromatic compounds and hormones and other nonspecific compounds in urban wastewater. However, mobile sensing still requires conversion to a portable platform. Toward these ends, two smartphones were evaluated to assess the immediate ability of their on-board hardware for fluorescence detection. These were compared for similarity with each other and with standard fluorescence spectroscopy.
3.2 Comparison of smartphones for fluorescence excitation
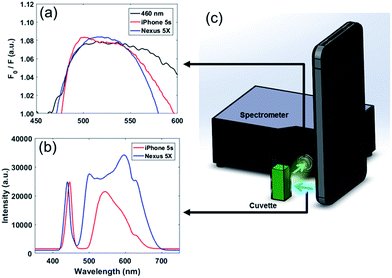
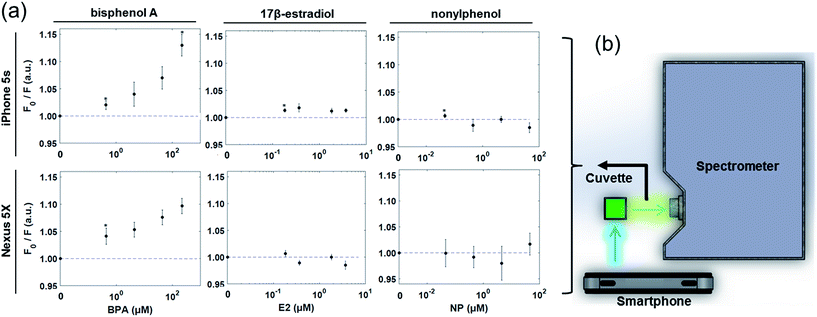
In standalone fluorescence detection, the sensing platform must provide both an excitation light source and an emitted light detector. For smartphone-based detection, the LED flash may be used for excitation and the CMOS camera sensor may be used as a detector.To first confirm their adequacy in HPTS excitation, the LED flash from two smartphones – an iPhone 5s and a Nexus 5X – were assessed as a substitute for the 460 nm LED light source used in fluorescence spectroscopy. The LEDs of both smartphones showed similar spectra, with a sharp peak in the blue wavelengths (440–450 nm) and a somewhat broader second peak between the green and red wavelengths (500–620 nm) (Fig. 3b). While these second peaks differed between the two smartphones, the blue peaks (440–450 nm) showed similar spectral characteristics near the maximal excitation of HPTS (λex = 460 nm). These were confirmed to induce similar fluorescence in a 10 mM HPTS and 44 μM BPA solution as compared with the 460 nm LED source (Fig. 3a). (Refer to ESI Fig. S1† for the raw spectra that were not normalized.) Using each smartphone as an excitation source, fluorescence spectroscopy measurements were replicated for increasing concentrations of BPA and demonstrated an increase in fluorescence quenching at 512 nm, matching previous observations using the 460 nm LED source (Fig. 4). Additionally, similar values for fluorescence quenching were measured between each smartphone. No consistent change in fluorescence quenching was observed from baseline under the same conditions for E2 or NP mixtures with HPTS. Based on these findings, it appears that the spectra and intensity of at least these smartphone flash light sources are suitable for blue-wavelength excitation without modification or enhancement. The arrangement of our detection platform also eliminated our need for a supplemental low-pass or 460 nm bandpass filter to reduce signal noise by mechanically separating the incident and emitted light by 90°. Building on the advantages of this design, we tested a standalone filter-free smartphone fluorescence detection platform.
3.3 Comparison of smartphones for standalone fluorescence excitation and detection
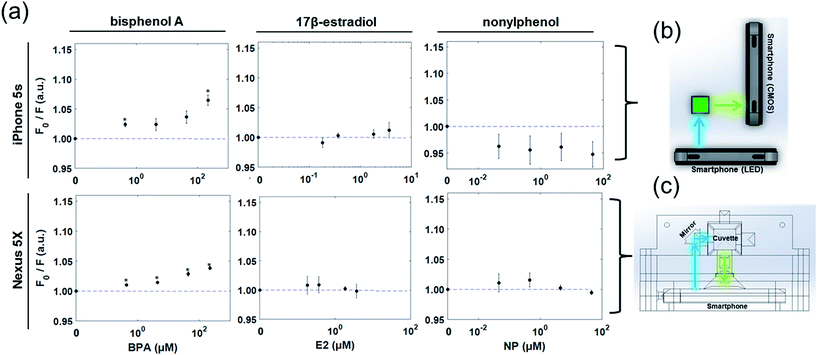
In this next stage of assessment, the CMOS camera of each smartphone was evaluated for its efficacy in directly measuring fluorescence quenching from cuvette samples. Toward this, two systems were developed. The first was a dual smartphone sensing platform, with one smartphone used for illumination and a second used as a detector, replacing the spectrometer in Fig. 3c. The second was a single smartphone sensing platform with the LED flash source and CMOS camera sensor of one smartphone integrated into a single cuvette holder platform for self-contained fluorescence measurements (Fig. 5a). In both systems, upon excitation of the HPTS–target complex by the LED flash, an image of the sample was collected at 90° to the incident light (Fig. 5b and c). From these images, detection regions were isolated from the green channel of each RGB image and the average intensity was collected as a measure of fluorescence. Using these dual and single smartphone systems for the iPhone 5s and Nexus 5X, respectively, fluorescence quenching was analyzed for HPTS in the presence of BPA, E2, and NP.Similar trends were observed to those seen via smartphone excitation and spectroscopy, but with attenuation in signal strength and thus in the measureable changes in fluorescence quenching (Fig. 6). The 4.4 μM limit of detection for BPA seen in standard fluorescence spectroscopy held under smartphone detection, but the measureable fluorescence intensity over the linear detection range was reduced, limited by the 0–255 pixel intensities measured from the 8 bit green channel. Based on these findings, standalone smartphone fluorescence detection holds promise for direct field-detection of BPA from leachate water samples, but there is room for improvement. One approach for improving the detection limits of this assay and platform for broader environmental sensing is to pursue true smartphone spectroscopy. By employing a grating to refract the emitted light before it reaches the smartphone CMOS sensor, the fluorescence emission spectrum can be spatially separated within the smartphone image. In this way, the smartphone sensing platform can focus narrowly on the maximum emission wavelength (512 nm) and post-processing can be used to improve the resolution of intensity changes over this range. Alternatively, multi-image sampling and stacking combined with digital noise reduction, akin to an inversion of the bioluminescent-based analyte quantitation by smartphone (BAQS) method developed by Kim et al., may be used to improve the sensitivity of smartphone fluorescence detection by increasing the distinction between background and signal intensity measures between samples.36
Perhaps most prominent, though, is the similarity in detection between the two smartphones, which both similarly initiate and receive the fluorescence quenching response. Although these represent only two devices available, the observed results suggest that challenges in the uniformity of detection are predominantly external to the smartphone hardware itself. As such, similar or identical control measures might be used between the two platforms for noise reduction, digital filtering, or mechanical separation of emitted wavelengths, and may allow both to achieve similar and environmentally relevant levels of BPA detection. These results thus demonstrate the potential for universal application of these or similar methods in standalone smartphone platforms. Lower reliance on specialized equipment and fewer platform limitations or restrictions benefit field-deployable sensing, particularly in resource-limited settings, by allowing for a broader user base as different smartphone platforms may be available in different regions.
4. Conclusions
Smartphone-based fluorescence detection platforms are alluring for portable sensing due to the prevalence and improvements in smartphone technology, which afford suitable sensitivity to fluorophore responses. Using a novel fluorescence detection method for BPA via HPTS quenching, BPA was consistently detectable from water samples between fluorescence spectroscopy and iPhone 5s or Nexus 5X standalone sensor platforms. A significant HPTS–BPA binding interaction (KSV = 2040 M−1) was observed with a detection limit of 4.4 μM, which is suitable for higher concentrations in waste leachate and industrial samples. Further improvements can be made on all platforms, particularly by enhancing smartphone signal processing techniques in order to better prepare these methods for general environmental sensing. With significant improvements, though, smartphone-based fluorescence sensing may hold promise for facilitating future portable BPA monitoring.Acknowledgements
KEM acknowledges support from the U.S. National Science Foundation Graduate Research Fellowship under Grant No. DGE-1143953. Any opinion, findings, and conclusions or recommendations expressed in this material are those of the author(s) and do not necessarily reflect the views of the National Science Foundation. TT acknowledges partial support from the Undergraduate Biology Research Program at The University of Arizona. VP acknowledges partial support from the Western Alliance to Expand Student Opportunities (WAESO) at Arizona State University. The authors also gratefully acknowledge Clare Remy and the University of Arizona KEYS Research Internship Program.References
- U.S. Environmental Protection Agency, Bisphenol A BPA Action Plan, 29 March 2010, available: https://www.epa.gov/sites/production/files/2015-09/documents/bpa_action_plan.pdf Search PubMed.
- S. Yan, W. Song, Y. Chen, K. Hong, J. Rubinstein and H. S. Wang, Food Chem. Toxicol., 2013, 56, 75–80 CrossRef CAS PubMed.
- E. Diamanti-Kandarakis, J. P. Bourguignon, L. C. Giudice, R. Hauser, G. S. Prins, A. M. Soto, R. T. Zoeller and A. C. Gore, Endocr. Rev., 2009, 30, 293–342 CrossRef CAS PubMed.
- Merchant Research & Consulting, Ltd, Bisphenol A (BPA): 2016 World Market Outlook and Forecast up to 2020, Birmingham, 2016 Search PubMed.
- Merchant Research & Consulting, Ltd, Bisphenol A (BPA): 2014 World Market Outlook and Forecast up to 2018, Birmingham, 2014 Search PubMed.
- H. A. Wittcoff, B. G. Reuben and J. S. Plotkin, Industrial Organic Chemicals, Wiley, 3rd edn, 2012 Search PubMed.
- J. Aungst, 2014 Updated safety assessment of bisphenol A (BPA) for use in food contact applications, U.S. Department of Health & Human Services, 2014 Search PubMed.
- National Toxicology Program, Bisphenol A (BPA), National Institute of Environmental Health Sciences, Durham, 2010 Search PubMed.
- U.S. Centers for Disease Control and Prevention, National Health and Nutrition Examination Survey: 2011–2012, Atlanta, 2013 Search PubMed.
- S. Jenkins, N. Raghuraman, I. Eltoum, M. Carpenter, J. Russo and C. A. Lamartiniere, Environ. Health Perspect., 2009, 117, 910 CrossRef CAS PubMed.
- G. Schönfelder, K. Friedrich, M. Paul and I. Chahoud, Neoplasia, 2004, 6, 584–594 CrossRef PubMed.
- W. Völkel, T. Colnot, G. A. Csanády, J. G. Filser and W. Dekant, Chem. Res. Toxicol., 2002, 15, 1281–1287 CrossRef.
- S. Flint, T. Markle, S. Thompson and E. Wallace, J. Environ. Manage., 2012, 104, 19–34 CrossRef CAS PubMed.
- H. S. Marcial, A. Hagiwara and T. W. Snell, Environ. Toxicol. Chem., 2003, 22, 3025–3030 CrossRef CAS PubMed.
- H. J. Baek, M. H. Park, Y. D. Lee and H. B. Kim, Fish Physiol. Biochem., 2003, 28, 413–414 CrossRef CAS.
- A. Mandich, S. Bottero, E. Benfenati, A. Cevasco, C. Erratico, S. Maggioni, A. Massari, F. Pedemonte and L. Vigano, Gen. Comp. Endocrinol., 2007, 153, 15–24 CrossRef CAS PubMed.
- P. Sohoni, C. R. Tyler, K. Hurd, J. Caunter, M. Hetheridge, T. Williams, C. Woods, M. Evans, R. Toy, M. Gargas and J. P. Sumpter, Environ. Sci. Technol., 2001, 35, 2917–2925 CrossRef CAS PubMed.
- J. Oehlmann, U. Schulte-Oehlmann, J. Bachmann, M. Oetken, I. Lutz, W. Kloas and T. A. Ternes, Environ. Health Perspect., 2006, 114, 127–133 CrossRef PubMed.
- F. Lahnsteiner, B. Berger, M. Kletz and T. Weismann, Aquat. Toxicol., 2005, 75, 213–224 CrossRef CAS PubMed.
- L. N. Vandenberg, R. Hauser, M. Marcus, N. Olea and W. V. Welshons, Reprod. Toxicol., 2007, 24, 139–177 CrossRef CAS PubMed.
- J. Corrales, L. A. Kristofco, W. B. Steele, B. S. Yates, C. S. Breed, E. S. Williams and B. W. Brooks, Dose-Response, 2015, 13, 1–29 CrossRef CAS PubMed.
- U. S. Environmental Protection Agency, Testing of Bisphenol A, 26 July 2011, available: https://www.regulations.gov/document?D=EPA-HQ-OPPT-2010-0812-0001, accessed 21 October 2016 Search PubMed.
- ASTM International, Standard Test Method for Determination of Bisphenol A in Environmental Waters by Liquid Chromatography/Tandem Mass Spectrometry, 1 February 2016, available: https://www.compass.astm.org/download/D7574.23632.pdf, accessed 21 October 2016 Search PubMed.
- U. S. Environmental Protection Agency, Semivolatile Organic Compounds by Gas Chromatography/Mass Spectrometry, July 2014, available: https://www.epa.gov/sites/production/files/2015-12/documents/8270d.pdf, accessed 21 October 2016 Search PubMed.
- P. P. Neelakandan, P. C. Nandajan, B. Subymol and D. Ramaiah, Org. Biomol. Chem., 2011, 9, 1021–1029 CAS.
- S. Gamsey, A. Miller, M. M. Olmstead, C. M. Beavers, L. C. Hirayama, S. Pradhan, R. A. Wessling and B. Singaram, J. Am. Chem. Soc., 2007, 129, 1278–1286 CrossRef CAS PubMed.
- J. Gao, S. Rochat, X. Qian and K. Severin, Chem.–Eur. J., 2010, 16, 5013–5017 CrossRef CAS PubMed.
- S. Rochat, S. N. Steinmann, C. Corminboeuf and K. Severin, Chem. Commun., 2011, 47, 10584–10586 RSC.
- A. Shareef, M. J. Angove, J. D. Wells and B. B. Johnson, J. Chem. Eng. Data, 2006, 51, 879–881 CrossRef CAS.
- D. Bontje, J. Hermens, T. Vermeire and T. Damstra, Integrated Risk Assessment: Nonylphenol Case Study. International Programme on Chemical Safety, WHO/UNEP/ILO, 2004 Search PubMed.
- A. L. Filby, T. Neuparth, K. L. Thorpe, R. Owen, T. S. Galloway and C. R. Tyler, Environ. Health Perspect., 2007, 115, 1704–1710 CrossRef CAS PubMed.
- T. Urase and K. Miyashita, J. Mater. Cycles Waste Manage., 2003, 5, 0077–0082 CrossRef CAS.
- A. Belfroid, M. van Velzen, B. van der Horst and D. Vethaak, Chemosphere, 2002, 49, 97–103 CrossRef CAS PubMed.
- D. A. Crain, M. Eriksen, T. Iguchi, S. Jobling, H. Laufer, G. A. LeBlanc and L. J. Guillette, Reprod. Toxicol., 2007, 24, 225–239 CrossRef CAS PubMed.
- D. W. Kolpin, E. T. Furlong, M. T. Meyer, E. M. Thurman, S. D. Zaugg, L. B. Barber and H. T. Buxton, Environ. Sci. Technol., 2002, 36, 1202–1211 CrossRef CAS PubMed.
- H. Kim, Y. Jung, I. J. Doh, R. A. Lozano-Mahecha, B. Applegate and E. Bae, Sci. Rep., 2017, 7, 40203 CrossRef PubMed.
Footnote |
| † Electronic supplementary information (ESI) available. See DOI: 10.1039/c6ra27726h |
| This journal is © The Royal Society of Chemistry 2017 |

