 Open Access Article
Ultra-thin Au tip structure: a novel SERS substrate for in situ observation of a p-aminothiophenol surface-catalytic reaction†
Yukun Gaoa,
Nan Yanga,
Tingting Youb,
Li Jiangc and
Penggang Yin *a
*a
aKey Laboratory of Bio-inspired Smart Interfacial Science and Technology of Ministry of Education, School of Chemistry and Environment, Beihang University, Beijing, China. E-mail: pgyin@buaa.edu.cn
bSchool of Physics and Nuclear Energy Engineering, Beihang University, Beijing, China
cCollege of Optical and Electronic Technology, China Jiliang University, China
First published on 16th January 2017
Abstract
A novel surface-enhanced Raman scattering (SERS) substrate based on an ultra-thin Au nano-tip structure was prepared using a simple and quick electrochemical etching method in this study. After decorating Au nanoparticles on the surface of the fabricated nanotip using an electrostatic absorption method, SERS measurement was performed on the substrate by using 4-mercaptobenzoic acid (4-MBA) as a Raman probing molecule, showing a good enhancement effect for the sample molecules adsorbed on the nanotip region. Furthermore, the Au tip structure Raman substrate was applied in monitoring and assessing the plasmon-driven surface-catalytic reaction of para-aminothiophenol (PATP) transforming to 4,4-dimercaptoazobenzene (DMAB), and the laser power-dependent and tip size dependent experiments were performed and discussed in this work. The results show high catalytic efficiency on the nanotip with about 40 nm apex diameter under definite laser power, providing a new application in pinpoint monitoring on surface-catalytic reaction within the nanotip region.
1. Introduction
With good sensitivity and convenience, surface-enhanced Raman scattering (SERS) techniques possess great advantages for obtaining Raman spectra of low concentration solutions based on nano/micro-rough substrates, allowing further application in the detection of pesticides, foodstuffs and biological samples. In 1974, Fleischmann and his co-workers observed highly enhanced Raman signals of monolayer pyridine on a roughed Ag electrode.1 After that, various methods such as chemical etching, cyclic voltammetry and electrochemical redox management were used to prepare various SERS-active substrates.2,3 Nonetheless, most preparation methods cannot control the roughness accurately, leading to unstable surface morphologies, low reproducibility and varied SERS effects from point to point. Therefore, exploring a novel SERS substrate which could avoid the inhomogeneity is an essential task for researchers currently. In our work, a novel Au nano-tip (Au NT) substrate was prepared using electrochemical etching method. Detecting the probe molecules by Raman spectroscopy directly on the nanotip region of the substrate with strong Raman intensity can easily avoid varied SERS signals on normal large substrates.We noticed that some researchers have studied on the tip-structured substrate recent years. Xu et al. have found some effective SERS substrates especially the tip structured Si array was prepared as the effective substrate because of its special structure. The plasmonic properties and lighting conductor effect of the tip structure attract other researchers investigating similar phenomenon.4 F. De Angelis et al. designed super-hydrophobic surface with a plasmonic cone with tip structure directly embedded in a micro-pillar array, on which the Raman sensitivity and spectra details strongly increased.5 Both the works studying on tip structures show that only molecules deposited in proximity to the tip region are efficiently detected because the enhancement decreases very rapidly away from the apex. Therefore, we designed to detect the probe molecule directly on the ultra-thin tip structure to get high SERS effect instead of variations among different spots on the normal substrates.
To get more enhanced SERS signals, modifying Au/Ag nanoparticles on the micro/nano structures substrates become universal in recent studies. Electrostatic adsorption becomes a simple and effective method for modification of Au/Ag nanoparticles, as many researchers adopted.6,7 In our study, Au nanoparticles possess negative charge were prepared and adsorbed onto Au NTs through electrostatic interactions, which made great effort to the SERS enhancement of the substrate.
More importantly, monitoring the process of catalytic reaction became increasingly important nowadays with various characterization technique to detect the reactant disappearance and the product generation as well as catalyst efficiency.8,9 For the past few years, some researchers devoted in studying the process of certain plasmon driven surface-catalyzed reaction by SERS, which could offer both the reaction and detection requirements including laser as excitation source and noble metal substrates as catalyst.10–13 In this work, based on good SERS enhancement effects, monitoring the plasmon driven surface-catalyzed reaction from para-aminothiophenol (PATP) to 4,4-dimercaptoazobenzene (DMAB) on the ultra-thin Au tip substrate presented excellent catalytic activity and relevant studies were discussed.
2. Experimental section
2.1 Material
Au wire (Φ 0.2 mm, 99.99% purity) was purchased from China New Metal Materials Technology Co, Ltd; 37% HCl and ethanol were of analytical grade; 4-mercaptobenzoic acid (4-MBA) and PATP were purchased from J&K Chemical Company (China).2.2 Preparation of Au nano-tip structure
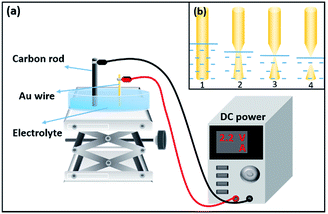
The Au NT structure was prepared by electrochemical etching method.14,15 The experiment equipment and chemical principle diagram are shown in Fig. 1. In the preparation process, we use Au wire with 0.2 mm diameter as positive electrode and carbon rod as negative electrode.16 To obtain nanotips with satisfying surface and morphology which were neither bended nor twisted, ethanol/hydrochloric acid (the volume ratio is 1![[thin space (1/6-em)]](https://www.rsc.org/images/entities/char_2009.gif) :
:![[thin space (1/6-em)]](https://www.rsc.org/images/entities/char_2009.gif) 1) solution was chosen as the electrolyte, while the etching voltage and immerged depth was set to be 2.2 V and 1.5 mm, respectively.11,17 The prepared tips were rinsed several times in ethanol and deionized water separately, and were put in a desiccator for further use. As illustrated in Fig. 1(b), for immersed Au wire, the part near the gas/liquid/solid interface tends to be etched at higher rates than part with certain distance from the interface. As ethanol/hydrochloric acid mixture easily get volatilized in room temperature, the gas/liquid/solid interface drops to lower level gradually. At the moment when the Au wire becomes too thin to hold the immersed part, it breaks and the Au NT is formed as shown in Fig. 1(b)4. For better detection sensitivity, Au nanoparticles (Au NPs) with diameter about 13 nm are adsorbed on the surface of fabricated Au NTs by electrostatic absorption. Au NPs are synthesized by reduction of chloroauric acid with sodium citrate.18 The prepared Au NTs are suspended and immersed in the solution of synthesized Au NPs solution for a period of time. The Au NT could easily adsorb the Au NPs through electrostatic absorption.
1) solution was chosen as the electrolyte, while the etching voltage and immerged depth was set to be 2.2 V and 1.5 mm, respectively.11,17 The prepared tips were rinsed several times in ethanol and deionized water separately, and were put in a desiccator for further use. As illustrated in Fig. 1(b), for immersed Au wire, the part near the gas/liquid/solid interface tends to be etched at higher rates than part with certain distance from the interface. As ethanol/hydrochloric acid mixture easily get volatilized in room temperature, the gas/liquid/solid interface drops to lower level gradually. At the moment when the Au wire becomes too thin to hold the immersed part, it breaks and the Au NT is formed as shown in Fig. 1(b)4. For better detection sensitivity, Au nanoparticles (Au NPs) with diameter about 13 nm are adsorbed on the surface of fabricated Au NTs by electrostatic absorption. Au NPs are synthesized by reduction of chloroauric acid with sodium citrate.18 The prepared Au NTs are suspended and immersed in the solution of synthesized Au NPs solution for a period of time. The Au NT could easily adsorb the Au NPs through electrostatic absorption.
2.3 Characterization
A DC power supply (BY3010S) was used in the electrochemical etching process. SEM images were obtained by an Environmental Scanning Electron Microscope (SEM) (Quanta 250 FEG, 10 kV); a precision three-dimensional electrical-controlling move apparatus combined with a Au wire fixture (Lyseiki, Beijing) (Fig. 2(b)) were designed by our group for controlling the relative position between Au nanotip and laser light spot, with minimum moving distance about 0.2 μm. Raman spectra were recorded by a Jobin Yvon (Laboratory RAM HR800) confocal micro-Raman spectrometer. The excitation source was an internal He–Ne laser with a wavelength of 632.8 nm. Laser power was 1.3 mW and accumulation time was 5 s. The Au wire was fixed parallel to the laser beam, directly focused by the light spot on the tip of Au wire (Fig. 2(a)) controlled by the precision three-dimensional electrical-controlling move apparatus. Focusing image could be observed by the microscope of the Raman spectrometer under both the white light and laser condition for us to ensure the focal spot on the nanotip region. In the SERS experiment, 1 × 10⁻³ mol L−1 4-MBA and PATP ethanol solution were prepared as the probe molecule. The tip region of the Au NTs and Au NTNPs was immersed in 100 μL 4-MBA solution for 12 hours and in PATP solution in dark for 2 hours respectively, followed by drying in room temperature before SERS measurement. The Au NPs were dropped on a piece of silicon wafer, drying in room temperature, followed by immersing in 100 μL probe molecule solution under the same condition as the Au NTs and Au NTNPs.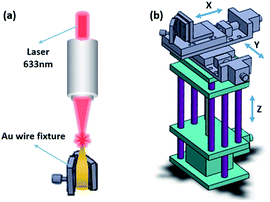 | ||
| Fig. 2 Schematic diagram of (a) SERS experiment of Au NTNPs and Au NTs; (b) the precision three-dimensional electrical-controlling move apparatus combined with a Au wire fixture. | ||
3. Result and discussion
3.1 Characterization of Au NTs and Au NTNPs structure
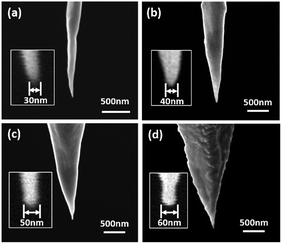
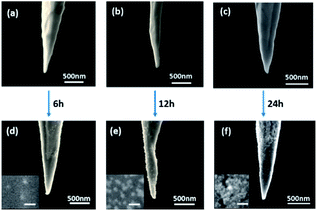
The morphologies of the prepared Au NTs are characterized by SEM as presented in Fig. 3, with apex diameters about 30, 40, 50 and 60 nm measured from the SEM images. The surface of most Au NTs are smooth without other impurities which may cause negative effects to the following experiments. The Au NTs apex diameters were discovered to be among 30–80 nm due to the varied ambient environment. The rate of preparing satisfying tips is about 79% from our experience (Fig. S1†). SEM images of Au nanotips adsorbed with Au nanoparticles (Au NTNPs) are presented in Fig. 4. The absorption capacity could be tuned by controlling the absorption time. Morphologies of samples with same apex diameter (80 nm) in different absorption time: 6, 12 and 24 hours are shown in Fig. 4, in which SEM images before and after absorption are both presented for better comparison. Apparently, the absorption capacity increases with time from the results. When it is 24 hours, excessive nanoparticles are adsorbed on the nanotip. Compared with that, homogeneous Au nanoparticles are dispersed on the surface of nanotip in 12 hours condition, which could be chosen as the optimum absorption condition.3.2 SERS spectra of 4-MBA on Au NTs
4-MBA is considered to be a normal probe molecule in SERS experiment. It adsorbs on most SERS substrate by sulfhydryl, producing distinctive and strong SERS signals. For better experiment result, we firstly discussed the SERS performance of Au NTs with different apex size, which is considered as a factor affecting the SERS signals. Several Au NTs with different apex diameters were used as SERS substrates detecting 10−3 mol L−1 4-MBA in Fig. 5. The apex diameter of the tips of the spectra (a)–(c) are approximately 60 nm, 80 nm and 40 nm. The morphologies are shown in the SEM images of the Au tips in (d)–(f). We can get the information that the Au tip with about 40 nm apex diameter presents stronger SERS signals rather than the other samples, selected by us as better substrates observing the catalytic reaction.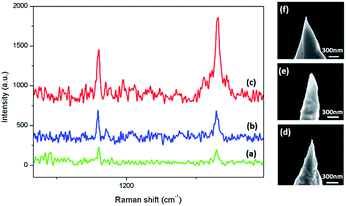 | ||
| Fig. 5 SERS spectra of 10−3 mol L−1 4-MBA on Au NTs with apex diameters about (a) 60 nm; (b) 80 nm; (c) 40 nm; (d)–(f) are the corresponding SEM images of the Au NTs. | ||
The strong intensity may be caused by the lighting conductor effect of the tip structure according to relevant study before.5 On metal tips with nanometer size, when the top of the cone is approached, the wave number of surface polaritons propagating through the conical structure increases and the wavelength decreases. As a result, a localized field will be formed and grow anomalously which was testified by theoretical analysis by A. J. Babadjanyan.19 This kind of metal tips with nanometer size may be fit in applying in scan near-field image and SERS with the special morphology and property.
3.3 SERS spectra of 4-MBA on Au NTNPs
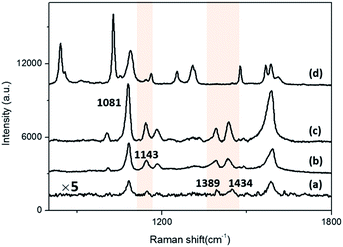
The SERS performance of Au NPs, Au NT and Au NTNPs substrate are compared in Fig. 6. The Au NPs, Au NT (40 nm apex diameter) and Au NTNPs (40 nm apex diameter) were immersed in 100 μL 1 × 10⁻³ mol L−1 4-MBA for 12 hours to ensure it had bonded to the surfaces. SERS spectra was exhibited in (b) and (c), in which we can clearly notice the Au NTNPs exhibit stronger and more distinct SERS signal compared with spectra of Au NPs and Au NTs. The special nanotip structure provide large field enhancement from light–matter interaction and lightning rod effect while the Au nanoparticles induce strong plasmonic coupling.20,21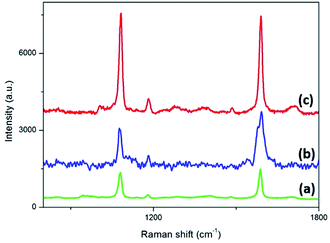 | ||
| Fig. 6 SERS spectra of (a) Au NPs; (b) Au NT; (c) Au NTNPs using 1 × 10⁻³ mol L−1 4-MBA as probe molecule. | ||
We also tested the life time of the new Au NTNPs SERS substrate. The Au NTNP prepared and used for SERS experiment 3 months earlier was taken out from the desiccator and detect the probe molecule by Raman spectrometer. In Fig. S2,† SERS spectra of the substrate placed in the desiccator for 3 months has a similar SERS intensity with the initial record under the same experiment conditions, showing pretty good stability and a long life time of the Au NTNP substrate.
3.4 Monitoring plasmon driven surface-catalyzed reaction on Au NTNPs
In previous works, it has been reported that when PATP was adsorbed on Au or Ag nanoparticles, oxidative coupling would take place under illumination, leading to transformation from PATP to DMAB in which the noble metal nanomaterials acted as catalyst.22,23 In contrast, less researches are proceeded using Au nanoparticles such as Guo-Kun Liu, Pan Li and their co-workers.24,25 Our group has studied the plasmon driven surface-catalytic reaction of PATP using gold nanoparticles and tetrahexahedral gold nanocrystals in previous works.22,26In this work, we compared the normal Raman spectrum (NRS) of PATP powder (Fig. 7(d)) and SERS spectrum of 1 × 10⁻³ mol L−1 PATP adsorbed on Au-NTNPs substrates with 40 nm apex diameter (Fig. 7(c)) to observe the changing and shifting of Raman peaks. Fig. 7(c) exhibit several new peaks generated from DMAB molecules at bands of 1143 cm−1, 1389 cm−1, 1434 cm−1 according to previous reports.21 The other three peaks, 1081 cm−1, 1193 cm−1, 1582 cm−1, are considered as a1 mode of PATP shifting from 1093 cm−1, 1208 cm−1 and 1599 cm−1 in normal Raman spectrum. As shown in Fig. 7(a) and (b), new peaks have appeared on both the Au NTs and Au NPs as well. It is indicated that both Au NTs and Au NPs facility the plasmon driven surface-catalyzed reaction of PATP, while the most satisfying spectra with strong signal and good signal-to-noise ratio (S/N) was collected from the surface of Au NTNPs sample as a result of synergistic effect. The relative intensity of the peak at 1143 cm−1 to the peak at 1081 cm−1 are considered as the representation of catalytic capacity of the substrate. We compared the relative intensity of the Au NT, Au NPs and Au NTNPs, which was approximately 0.31, 0.32 and 0.31 respectively, indicating that adsorbing the Au NPs on Au NTs could enhance the Raman signal and S/N but change the catalytic capacity little. In conclusion, the Au NTNPs were chosen as the substrate for further studying on the plasmon driven surface-catalyzed reaction.
3.5 Laser power-dependent plasmon driven surface-catalyzed reaction on Au NTNPs
Laser power-dependent SERS measurements are generally carried on noble metal nanoparticles to testify the stability and the transformation process of the plasmon driven surface-catalyzed reaction.27,28 In this work, we do research on laser power-dependent plasmon driven surface-catalyzed reaction on the special Au NTNPs. SERS spectra of PATP on Au-NTNPs (the apex diameter is 40 nm) obtained with different laser powers are normalized to the bands at 1081 cm−1 in Fig. 8. When the laser power is as low as 0.14 mW, the characteristic mode of DMAB could hardly be recognized. As the laser power increase gradually to 1.36 mW, new bands show up at 1143 cm−1, 1389 cm−1 and 1434 cm−1. The peak at 1143 cm−1 could be assigned to C–N stretching mode and the peaks at 1389 cm−1 and 1434 cm−1 are assigned to two related –N![[double bond, length as m-dash]](https://www.rsc.org/images/entities/char_e001.gif) N– stretching vibrational modes of DMAB.21 In conclusion, the surface-catalyzed reaction on the Au NTNPs SERS substrates are tested through the laser power-dependent process in which the DMAB is generated under specific laser power.
N– stretching vibrational modes of DMAB.21 In conclusion, the surface-catalyzed reaction on the Au NTNPs SERS substrates are tested through the laser power-dependent process in which the DMAB is generated under specific laser power.
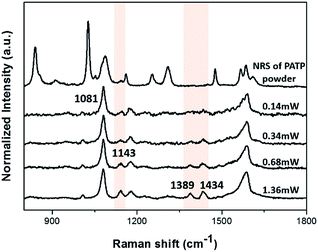 | ||
| Fig. 8 Normalized laser power-dependent Raman spectrum of 10−3 M PATP with the power changing from 0.14 mW to 1.36 mW compared with normal Raman spectrum of PATP. | ||
3.6 Size-dependent plasmon driven surface-catalyzed reaction on Au NTNPs
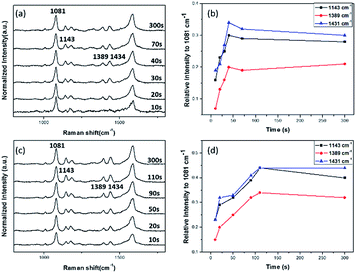
The influence of Au NT's apex diameter on SERS has been discussed in part 3.2, hence we infer it could affect the reaction rate and efficiency to some extent. In Fig. 9, time-dependent SERS spectra of 10−3 mol L−1 PATP on Au-NTNPs with apex diameter of 40 nm (a) and 80 nm (b) are presented, from which we can monitor the process of the plasmon driven surface-catalyzed reaction. All spectra were normalized according to the intensity of bands at 1081 cm−1 for better monitoring the variation trend of new emerged Raman peaks. The time-dependent intensity of Raman bands shown in Fig. 9(b) and (d) provide a more obvious variation with the laser irradiation time. Intensity for SERS spectra obtained from Au NTNPs with 40 nm apex diameter changes little after approximately 40 s reaction time while for Au NTNPs with 80 nm apex diameter, the Raman intensity arrived at a platform after nearly 100 s, indicating a longer reaction time and lower catalytic efficiency. As a result, we conclude that the Au NTNPs with smaller apex diameter about 40 nm have high catalytic efficiency and rate than the 80 nm NTNPs. This phenomenon may be explained by the plasmonic nanofocusing, while different apex angles cause different surface plasmon polaritons (SPP) deliveries.15 The Au NTNPs with smaller apex diameter have more efficient coupling of plasmon, which may cause the high photo-catalytic efficiency.Specially, dissolved oxygen is able to change the surface of the metal and to oxidize the analyte especially p-aminothiophenol (PATP).29,30 In order to exclude the factor, another comparative experiment was completed by us, experimental details and results are shown in ESI,† making the work more credible and meaningful.
4. Conclusion
In summary, we present a novel SERS substrate with ultra-thin Au tip structure prepared by electrochemical etching and electrostatic absorption could monitor the plasmon-driven surface-catalytic reaction of PATP.The apex diameters of the Au tips were among 30–80 nm. The SERS experiments of the Au NTs with different apex diameters selected from the prepared tips represent fine enhancement in Raman signals. Especially for tips with 40 nm apex diameter, stronger Raman intensity are shown by using 4-MBA as the probe molecule. Comparative SERS experiments are processed on Au NT, Au NPs and the Au NTNPs under the same condition, showing that Au NTNPs exhibit stronger and more distinct SERS signals. Based on the SERS experiments, monitoring the transformation from PATP to DMAB are observed by laser power-dependent experiment through the surface coupling reaction process. Au NTNPs with about 40 nm apex diameter show high catalytic efficiency and rate than 80 nm tips for the reason of plasmonic nanofocusing.
The ultra-thin Au tip structure substrate provides a novel method of monitoring the plasmon-driven surface-catalytic reaction by Raman spectrometer. The Au tip can also be used as the tip of TERS, providing wider applications for this method.31–33 Moreover, we infer it can be used in detecting small quantity sample by amplifying spectral signal from trace amount molecules within the nanotip region, which is available for further study on sensitive, facilitate and pinpoint monitoring on surface-catalytic reaction.
Acknowledgements
This work was supported by the National Natural Science Foundation of China (51272013 and 51572009).References
- M. Fleischmann, P. J. Hendra and A. J. McQuillan, Chem. Phys. Lett., 1974, 26(2), 163 CrossRef CAS.
- Z. Tian, B. Ren and D. Wu, J. Phys. Chem. B, 2002, 106, 9463 CrossRef CAS.
- J. Wang and P. Zhang, J. Phys. Chem., 1988, 92, 1942 CrossRef CAS.
- T. Xu, J. Huang and L. He, Appl. Phys. Lett., 2011, 99, 153116 CrossRef.
- F. De Angelis, F. Gentile and F. Mecarini, Nat. Photonics, 2011, 222, 683 Search PubMed.
- J. Yang, J.-T. Song, W. Hu, Y. Huang, L.-J. Deng, H.-N. Hou and B. Liu, Anal. Methods, 2016, 10, 1036 Search PubMed.
- W. Xue, G. Zhang and D. Zhang, Analyst, 2011, 136, 3136 RSC.
- Z. Zhang, Y. Fang, W. Wang, L. Chen and M. Sun, Adv. Sci., 2016, 3, 1500215 CrossRef PubMed.
- Z. Zhang, P. Xu, X. Yang, W. Liang and M. Sun, J. Photochem. Photobiol., C, 2016, 27, 100 CrossRef CAS.
- Q. Ding, Y. Shi, M. Chen, H. Li, X. Yang, Y. Qu, W. Liang and M. Sun, Sci. Rep., 2016, 6, 32724 CrossRef CAS PubMed.
- P. Li, B. Ma, L. Yang and J. Liu, Chem. Commun., 2015, 51, 11394 RSC.
- G. Liu, J. Hu, P. Zheng, G. Shen, J. Jiang, R. Yu, Y. Cui and B. Ren, J. Phys. Chem. C, 2008, 112, 6499 CAS.
- M. Sun and H. Xu, Small, 2012, 8(18), 2777 CrossRef CAS PubMed.
- B. Ren, G. Picardi and B. Pettinger, Rev. Sci. Instrum., 2004, 75(4), 837 CrossRef CAS.
- W. Xi, C. Yan and R. Bin, Chem. Res. Chin. Univ., 2007, 28(3), 522 Search PubMed.
- L. Eligal, F. Culfaz, V. McCaughan, N. I. Cade and D. Richards, Rev. Sci. Instrum., 2009, 80, 033701 CrossRef PubMed.
- B. Pettinger, B. Ren, G. Picardi, R. Schuster and G. Ertl, Phys. Rev. Lett., 2004, 92(9), 096101 CrossRef PubMed.
- G. Frens, Nat. Phys. Sci., 1973, 241, 20 CrossRef CAS.
- A. J. Babadjanyan, N. L. Margaryan and K. V. Nerkararyan, J. Appl. Phys., 2000, 87(8), 3785 CrossRef CAS.
- N. C. Lindquist, J. Jose, S. Cherukulappurath, X. Chen, T. W. Johnson and S.-H. Oh, Laser Photonics Rev., 2013, 7(4), 453 CrossRef CAS.
- Y.-C. Wang, J. S. DuChene, F. W. Huo and W. D. Wei, Nanoscale, 2014, 6, 7232 RSC.
- Y.-F. Huang, H.-P. Zhu, G.-K. Liu, D.-Y. Wu, B. Ren and Z.-Q. Tian, J. Am. Chem. Soc., 2010, 132, 9244 CrossRef CAS PubMed.
- Y. Fang, Y. Li, H. Xu and M. Sun, Langmuir, 2010, 26(11), 7737 CrossRef CAS PubMed.
- G.-K. Liu, J. Hu, P.-C. Zheng, G.-L. Shen, J.-H. Jiang, R.-Q. Yu, Y. Cui and B. Ren, J. Phys. Chem. C, 2008, 112(16), 6499 CAS.
- P. Li, B. Ma, L. Yang and J. Liu, Chem. Commun., 2015, 51, 11394 RSC.
- X. Ren, E. Tan, X. Lang, T. You, L. Jiang, H. Zhang, P. Yin and L. Guo, Phys. Chem. Chem. Phys., 2013, 15, 14196 RSC.
- X. Lang, T. You, P. Yin, E. Tan, Y. Zhang, Y. Huang, H. Zhu, B. Ren and L. Guo, Phys. Chem. Chem. Phys., 2013, 15, 19337 RSC.
- E. Tan, P. Yin, T. You and L. Guo, J. Raman Spectrosc., 2013, 44, 1200 CrossRef CAS.
- M. Erol, et al., J. Am. Chem. Soc., 2009, 131, 7480 CrossRef CAS PubMed.
- T. Firkala, et al., J. Colloid Interface Sci., 2013, 410, 59 CrossRef CAS PubMed.
- F. Yurui, Z. Zhenglong and S. Mengtao, Rev. Sci. Instrum., 2016, 87, 033104 CrossRef PubMed.
- Z. Zhenglong, S. Shaoxiang, W. Rongming and S. Mengtao, Anal. Chem., 2016, 88, 9328 CrossRef PubMed.
- S. Mengtao, Z. Zhenglong, Z. Hairong and X. Hongxing, Sci. Rep., 2012, 2, 647 Search PubMed.
Footnote |
| † Electronic supplementary information (ESI) available. See DOI: 10.1039/c6ra27799c |
| This journal is © The Royal Society of Chemistry 2017 |

