 Open Access Article
Electrocatalysis on copper–palladium alloys for amperometric formaldehyde sensing†
Isabella Pötzelbergera,
Cezarina Cela Mardareb,
Lisa Maria Uiberlackerc,
Sabine Hildc,
Andrei Ionut Mardare *ab and
Achim Walter Hasselab
aInstitute for Chemical Technology of Inorganic Materials, Johannes Kepler University Linz, Altenberger Str. 69, 4040 Linz, Austria. E-mail: andrei.mardare@jku.at
bChristian Doppler Laboratory for Combinatorial Oxide Chemistry at Institute for Chemical Technology of Inorganic Materials, Johannes Kepler University Linz, Altenberger Str. 69, 4040 Linz, Austria
cInstitute of Polymer Science, Johannes Kepler University Linz, Altenberger Str. 69, 4040 Linz, Austria
First published on 18th January 2017
Abstract
Co-evaporation of Cu and Pd was used for the deposition of a relatively small gradient concentration thin film combinatorial library with Pd amounts between 4 and 14 atomic percent (at%). Screening for electrocatalytic oxidation of formaldehyde was performed by scanning droplet cell microscopy along the Cu–Pd compositional spread in alkaline solution and a best material performance for this process was identified for 7.5 at% Pd in Cu confirming results from co-sputtering studies. However, the microstructure and crystallographic analysis of Cu–Pd thin film alloys showed a compositionally induced gradual change of properties without any significant discontinuity. This indicates that the Cu–Pd atomic ratio is the main factor defining the electrocatalytic activity of the investigated alloys. This finding is also confirmed for bulk Cu–Pd alloys where the reproducibility of significant formaldehyde oxidation electrocatalytic activity when using Cu-7.5 at% Pd was demonstrated. An amperometric formaldehyde sensor was fabricated and its reproducibility, repeatability and stability were assessed. During successive anodic formaldehyde current oxidation peak observations a standard deviation value of 8% was measured. Multiple efficient successive use of the same sensor (5 to 10 times) were demonstrated and a maximum of 5% decrease in the current density was observed after 21 days of normal environment storage during a shelf-lifetime evaluation of the sensor. Overall, the study reveals inexpensive approaches for fabrication of multiple use formaldehyde sensors via thermal evaporation or bulk alloy casting, as well as the transfer of the main feature (i.e. maximum current density for formaldehyde oxidation) from a thin film combinatorial library to bulk samples.
1. Introduction
Formaldehyde finds applications in various areas, acting as reducing agent in the electroless plating industry,1 as intermediate in fuel cells2–4 or the food industry.5 Due to its toxic and sensitizing properties formaldehyde can cause health risks in humans who are exposed to this chemical substance. Furthermore, it was identified as a human carcinogen by the International Agency for Research on Cancer.6,7 Therefore, the development of sensors for the formaldehyde detection has attracted increased attention in the last few decades. Generally, noble metals such as Au,8–11 Ag,12 Pt13–16 and Pd17–20 and their oxides were used as electrode materials for electrocatalytic oxidation of formaldehyde. Previous studies showed that Pd has a higher catalytic activity, lower costs and sensitivity to poisoning effects during the formaldehyde oxidation process as compared to Pt catalysts. Nevertheless, high material and fabrication costs are triggering extensive investigations for alternative materials for electrocatalytic oxidation of formaldehyde. Alloying Pd with a non-noble metal reduces the costs of the catalyst tremendously. Previous studies identified Cu and Cu alloys as good candidates for this purpose due to their good corrosion resistance and performance in the electrocatalytic formaldehyde oxidation.21–24 The importance of finding the optimum Cu/Pd ratio for maximizing the electrocatalytic activity of Cu–Pd alloys was recently emphasised.25In a combinatorial material development approach, screening of combinatorial thin film material libraries allows identification of the optimum performing Cu–Pd alloy. The smallest amount of noble metal which alloyed with Cu may enhance the electrocatalytic activity for formaldehyde oxidation (as compared to the activity of pure Cu) can be therefore identified. Such development step is necessary for decreasing the costs of the electrocatalytically active alloy before an efficient implementation in device fabrication. Recently, an optimum composition of Cu-7.5 at% Pd was identified in thin film alloys deposited by co-sputtering.26 Given on the one hand the relatively high costs of sputtering systems and their industrial implementation and on the other hand the ease and much lower costs of Cu and Pd thermal evaporation, the present work aims at investigating the reproducibility of the electrocatalytic activity of the previously identified Cu–Pd alloy when fabricated by thermal co-evaporation. Moreover, the optimum composition is reproduced in the form of bulk alloys for assessing the efficiency of thin film combinatorial library screening vis-à-vis new bulk materials development. The performance of such formaldehyde sensing Cu–Pd alloy is described in both thin film and bulk forms. Features such as sensing efficiency, reliability, sensitivity and simplicity of the fabrication process are presented in an attempt of providing a cheaper but efficient fabrication route competing with the more complex co-sputtering process.
2. Experimental details
Several Cu–Pd thin films were deposited on Ti (25 nm) coated borosilicate glass substrates 26 × 76 mm2 using a thermal co-evaporation system (THEO) with a base pressure in the range of 10−5 Pa. Concomitant evaporation from off-axis high purity Pd and Cu thermal sources (99.95%) allowed a Cu–Pd gradient composition to form along each substrate. Titanium acts as adhesion layer between the glass substrates and the Cu–Pd thin films. Three compositionally graded samples were used to define the Cu–Pd thin film combinatorial library used in this study. Fixing the deposition rate of Cu (0.350 nm s−1) and varying the deposition rate of Pd (0.035 to 0.042 nm s−1) allowed tuning each compositional spread in such a way that an overlapping of approximately 2 at% was obtained between consecutive samples for testing the properties reproducibility. Energy dispersive X-ray spectroscopy (EDX) from EDAX was used for mapping the alloy composition along the Cu–Pd library and a variation of Pd amount between approximately 4 and 14 at% was found. Compositional lateral resolutions of maximum 0.07 at% per mm were obtained which conveniently offered sufficient Cu–Pd surface as corresponding to a particular alloy (with 1 at% resolution) for further experimentation. This large single alloy width along the library (approximately 14 mm per at%) was a direct consequence of increasing the deposition distance to the maximum allowed by the vacuum chamber geometry (260 mm).In order to confirm the reproducibility of the data obtained from thin films, representative Cu–Pd bulk alloys (Cu-4.8 at% Pd and Cu-7.5 at% Pd) were fabricated and tested. For this purpose, high purity bulk Cu and Pd (99.95% purity) were melted together in a BN crucible using a tubular furnace with inert atmosphere. The furnace was flushed with argon for 20 minutes previous to the heating of metals. A heating rate of 10 K min−1 was used for reaching the desired temperature of 1833 K which was held constant for 30 minutes. Afterwards, the obtained alloys were cooled down to room temperature with a cooling rate of 10 K min−1 before further analysis. All steps of these experiments were performed under argon flow. X-ray fluorescence spectroscopy (XRF) was used for composition analysis of the fabricated Cu–Pd bulk alloys (X-Strata 980-A, Oxford Instruments).
Crystallographic properties of the Cu–Pd thin film library and the bulk samples were investigated by X-ray diffraction (XRD) using a Philips X'Pert Pro system. All measurements were performed using Bragg–Brentano geometry and the radiation used was CuKα. Lattice parameter and crystallite size calculations were performed using the X'Pert HighScore Plus software. The degree of orientation (Dn) for each crystalline direction was calculated using the formula:27
 | (1) |
The surface microstructure as well as roughness were determined using a scanning force microscope (Asylum Research MFP-3D Stand Alone AFM). All AFM measurements were carried out in intermittent contact mode under ambient conditions on 1 × 1 μm2 selected representative areas.
All electrochemical investigations were performed using a 3D printed flow-type scanning droplet cell microscope (FT-SDCM), designed for a complete three electrode configuration. More details about the design and the performance of such electrochemical cell can be found elsewhere.26,28,29 A Hg/HgO μ-reference electrode was fabricated and used for all electrochemical measurements. For this purpose, a Au wire (Wieland Dentaltechnik, 99.999%) was ultrasonically cleaned with acetone and ethanol for 5 minutes. The deposition of Hg on the Au wire was performed by polarizing the wire to 0.2 V (SHE) for 180 s in 0.1 M Hg2(NO3)2 (Merck) electrolyte solution. Afterwards, the wire was rinsed with distilled water and dried. The amalgamated Au wire was dipped into a 0.002 wt% KMnO4 (Merck) solution for 600 s to oxidize the Hg to HgO. To improve the stability of the μ-reference electrode, the wire was inserted into a Teflon tube, which was filled with sodium polyacrylate immediately after the wire insertion. The fabricated μ-reference electrode was stored in 0.1 M NaOH solution.30 For a precise definition of the wetted area of the examined spot (corresponding to one Cu–Pd alloy), all electrochemical measurements were performed in contact mode. A small electrolyte droplet formed at the tip of the cell was brought in contact with the investigated Cu–Pd surface (which serves as working electrode – WE) while the air–liquid contact was suppressed by using an o-ring and pressing the cell against the sample with a predefined force. Local anodization was performed to determine the exact size of the investigated area.31 Therefore, a Ti plate was anodized in an acetate buffer (pH 6.0) solution. The area of various TiO2 spots was found to be 26.23 mm2 by using an optical microscope. Chemicals of analytical grade with no further purification were used for all experiments. All solutions were prepared with distilled water and flushed with nitrogen for oxygen removal.32 Cyclic voltammetric measurements were performed in a potential range between −0.80 and 0.70 V SHE with a potential increase rate of 0.01 V. For investigating the kinetics of the formaldehyde oxidation process, cyclic voltammograms at different scan rates (from 10 to 100 mV s−1) were recorded in a mixture of 90 mM formaldehyde (Alfa Aesar, 36.1% as confirmed by titration) and 0.1 M NaOH (VWR) electrolyte solution. For a precise definition of the formaldehyde concentration, a titrimetric determination was performed. For this purpose, a mixture of formaldehyde and thymol blue (Alfa Aesar) was titrated with a 1 N hydrochloric acid (VWR) solution until the solution becomes colourless.33 All electrochemical measurements were performed using a CompactStat Potentiostat (Ivium Technology, The Netherlands).
3. Results and discussion
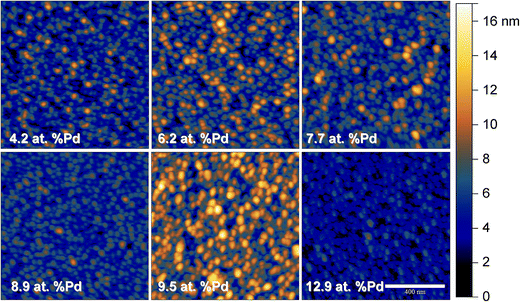
The limits of the Cu–Pd thin film library used in the present study were chosen for matching the compositional region of interest previously identified during screening for oxidation of formaldehyde along a larger compositional spread obtained by co-sputtering.26 Since electrocatalysis may be directly influenced by the active surface of the Cu–Pd, a microstructure tuning is expected to affect the formaldehyde oxidation process. For this reason the Cu–Pd library was fabricated here by using co-evaporation due to almost 100 times lower energy per atom (as compared to the case of co-sputtering) being provided during the film nucleation and growth process. Fig. 1 presents the AFM topography images of the Cu–Pd thin film surface in selected points along the entire compositional spread. The success of the proposed microstructure tuning is evidenced by obtaining a higher grain size uniformity as compared to the sputtering case.26 If higher energy per atom during co-sputtering deposition resulted in two distinct grain morphologies, the thermal energy responsible for the film formation in the present case promotes a single type of grains approximately 25 nm in size which is defining the Cu–Pd surface. Increasing the share of Pd along the library results mainly in different arrangement of the individual grains. Their 3D clustering may lead to different surface roughnesses for specific compositions as it can be recognized in Fig. 1. For quantifying this behaviour the RMS roughness was evaluated and the results are summarized in Table 1. With respect to the observed roughness data it can be concluded that no clear compositionally induced surface microstructure is present. The smoother surface was evidenced for a Pd concentration around 13 at% while 9 and 4 at% Pd still indicated roughness values below 2 nm.| Composition | Rq/nm | σ/nm |
|---|---|---|
| Cu-4.2 at% Pd | 1.85 | 0.11 |
| Cu-6.2 at% Pd | 2.07 | 0.11 |
| Cu-7.7 at% Pd | 1.91 | 0.35 |
| Cu-8.9 at% Pd | 1.33 | 0.04 |
| Cu-9.5 at% Pd | 2.32 | 0.30 |
| Cu-12.9 at% Pd | 1.19 | 0.16 |
Additionally, the crystallographic properties in selected points for compositions having Pd concentrations lower than 10 at% were investigated using the XRD, both for the thin film library and the bulk samples. As expected from the Cu–Pd phase diagram, within this compositional region there were no intermetallic phases detected, but only the Cu–Pd solid solution. This was evidenced by the sole presence of the Cu (FCC) peaks (see ESI Sup. 1†) which are shifting to lower 2θ diffraction angles as the Pd concentration increases (see ESI Sup. 2†). Similar results have been obtained for the bulk samples. Fig. 2 shows the calculated lattice parameter values for both, the thin film library and the bulk samples, as well as the crystallite size for the thin film as a function of Pd concentration. Different lattice parameter values between thin film and bulk samples were obtained, with the latter values being lower. Nevertheless, this difference is smaller than 0.4%, and it can be related to different stress values found in thin films versus bulk samples, as well as compositional errors of ±0.5 at% from the EDX quantification.26 Crystallite size calculations performed using the (111) reflection from the XRD patterns of the Cu–Pd thin film library show a continuous decrease from approximately 50 nm for 5 at% Pd to 40 nm for 9 at% Pd. These crystallite size values are in the same range as the grain sizes observed from the AFM imaging of the surface (see Fig. 1). This slight decrease in the crystallite size values as the Pd concentration increases has been also reported for the sputtered Cu–Pd films.26 In the case of thermally co-evaporated films, the decrease in the crystallite size might be related to the much lower deposition rate used for Pd (0.042 nm s−1), as compared to Cu (0.350 nm s−1). The use of such dissimilar rates was triggered by the desired compositional spread comprising low Pd contents. Similarly to the sputtered films, also for thermally co-evaporated films different deposition rates lead to different mobility of the atoms on the surface of the substrate and this aspect is reflected in the crystallite size values.
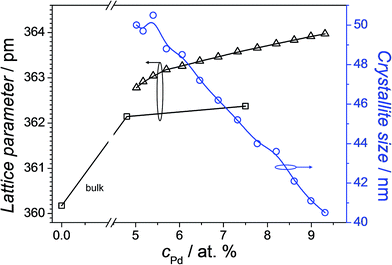 | ||
| Fig. 2 Lattice parameter and crystallite size mapping along the Cu–Pd compositional spread. The measured lattice parameter of the bulk Cu is added for referencing. | ||
The electrocatalytic formaldehyde oxidation on thermally deposited Cu–Pd thin film combinatorial libraries was investigated using FT-SDCM in alkaline solution. Therefore, cyclic voltammograms were recorded in the presence or absence of formaldehyde. The electrocatalytic behaviour of pure Cu was also investigated as reference and is presented as ESI together with the corresponding chemical reactions (see Sup. 3†). As confirmed by previous studies, without formaldehyde addition a well-defined anodic peak (dotted line in Sup. 3†) is attributed to the Cu oxides formation26 while on the backward scan Cu oxide reduction is easily identified.34,35 After formaldehyde addition to the electrolyte two additional anodic peaks are obtained due to formaldehyde oxidation and their position is used as reference for analysis of the Cu–Pd alloys. The oxidation peak recorded in the cathodic scan direction is usually shifted to a more negative potential as compared to the obtained peak in the anodic scan direction due to the time delay induced by the Cu oxides reduction (see Sup. 3†).34,36 During the electrocatalytic oxidation formaldehyde from the electrolyte solution adsorbs on the Cu surface and the oxidation process occurs through the following reaction:35,37,38
| HCHOaq + 2OHaq− → HCOOaq− + H2Oaq + ½H2gas + e− | (2) |
Previous studies indicated that the formation of the hydroxymethanolate intermediate is involved in the Cu catalysed electrochemical oxidation of formaldehyde. In the presence of Cu on the electrode surface, the hydride transfer from the hydroxymethanolate to the Cu surface can occur and formate is produced, which desorbs from the electrode surface.39 Furthermore, it was previously demonstrated that the Cu surface structure plays a crucial role in the electrocatalytic oxidation process. Studies performed on Cu (110) single crystals revealed a higher catalytic effect towards formaldehyde oxidation as compared to single crystals of Cu (100) or (111) while the Cu surface roughness and dislocation density did not influenced the electrocatalytic activity.40 The electrocatalytic effect of polycrystalline Cu and Cu-alloys surfaces depends on the surface formation conditions (i.e., nanowires, thin films, bulk, etc.) and addition of noble metals can result in a surface adsorption modification which enhances the electrocatalytic effect and improves the stability of such electrodes in alkaline solutions.26,41
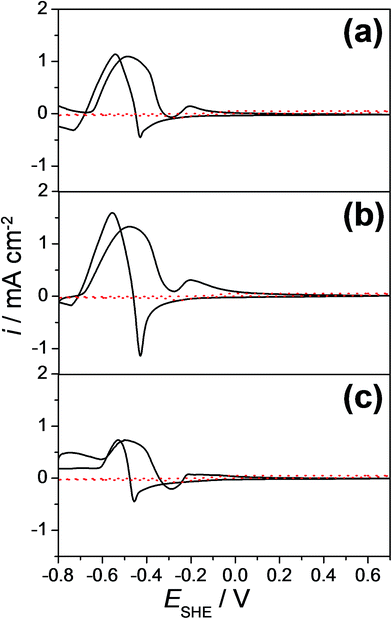
Cyclic voltammograms of few selected Cu–Pd compositions as measured along the entire compositional spread are presented in Fig. 3 for (a) 8.9 at%, (b) 7.7 at% and (c) 6.2 at% Pd. The cyclic voltammograms measured in the absence of formaldehyde are also plotted as dotted lines (in red) in each graph. The electrocatalytic effect of the investigated alloys is directly observable in each case by comparing the voltammograms with and without formaldehyde. In Fig. 3(a), a well-defined anodic peak at a potential of approximately −0.47 V vs. SHE for 8.9 at% Pd was obtained. Comparing the cyclic voltammetric measurements with and without the addition of formaldehyde, the identified anodic peak can be attributed to the formaldehyde oxidation (eqn (2)). In the cathodic scan direction an additional anodic peak at a potential of −0.54 V vs. SHE was obtained, which can be assigned to the formaldehyde oxidation due to the reduction of Cu and Pd oxides to their metallic form. Therefore, freshly adsorbed formaldehyde from the electrolyte solution is oxidized. Similar to the case of pure Cu, the identified anodic peak for the formaldehyde oxidation is shifted to a more negative potential (−0.54 V vs. SHE) due to the time necessary for the reactivation of the metallic surface.34,36 Comparing the cyclic voltammograms of Cu-7.7 at% Pd (Fig. 3(b)) and Cu-6.2 at% Pd thin film alloys (Fig. 3(c)), the anodic formaldehyde oxidation peaks were obtained approximately at a potential of −0.47 V vs. SHE.
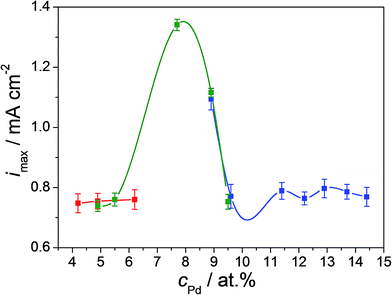
Overall, no significant change of the oxidation peak potentials with varying Pd content in the thin film alloys was observed. However, the heights of the formaldehyde oxidation peaks are directly affected by the Cu–Pd composition. The concomitant use of both peaks is definitely meaningful for a better characterization of the formaldehyde oxidation, but is not very useful if a fast-response device is designed or desired. For this purpose, only the first peak in the anodic scan direction at a potential of approximately −0.47 V vs. SHE is used. The intensity of this peak is mapped for the entire combinatorial library along the three overlapping Cu–Pd compositionally graded samples. These results are presented in Fig. 4. The compositionally overlapped regions are easily observable due to the colour-coded presentation of each of the Cu–Pd compositionally graded sample. A good reproducibility of the formaldehyde oxidation peak maximum current density is observed for identical alloys deposited on different samples justifying the idea of an amperometric sensor. For Pd contents below 6 at% and above 9.5 at% the maximum current density of the oxidation peak remains at a low value around 0.75 mA cm−2 defining therefore a background level for the compositional screening of the electrocatalytic formaldehyde oxidation. The current density values are maximized for 7.7 at% Pd (1.34 mA cm−2) indicating this composition as being the most suitable for use in amperometric sensing. The current density peak maximum corresponding to this alloy is almost twice higher as compared to the defined background level. A similar composition was previously found when using co-sputtering of Cu and Pd in spite of the more energetic thin film deposition process as compared to the thermal case presented here.26 Comparing the overlapping compositional regions of the three Cu–Pd samples described in Fig. 4, similar current density values are observed for the same composition independently on the sample formation conditions (as described in the Experimental section). This observation emphasises that the major factor contributing to the formaldehyde oxidation reaction on the surface of Cu–Pd thin film alloys is the Pd content, not specific surface microstructure features, which agrees well with the conclusions of early works on formaldehyde oxidation.40 The identification of the optimum Cu/Pd ratio found in the present study is identical to the one previously reported on co-sputtered Cu–Pd and it originates from a modification in the electronic structure of the alloy at the surface. This was clearly demonstrated by scanning Kelvin probe investigations when a much lower contact potential difference was observed at around 7.5 at% Pd. This lowering is mainly triggered by the stretching of the Cu–Pd lattice (observable in the shift of the main Cu XRD peak in Sup. 2†) inducing changes of electrons densities on the surface and therefore resulting in an overall decrease of the work function.26 This process further facilitates redox reactions and all these observations indicate once more that the composition is mainly responsible for the activity enhancement vis-à-vis formaldehyde oxidation.
In order to differentiate between diffusion controlled and charge transfer controlled anodic reactions, cyclic voltammetry was performed on Cu–Pd alloys with variable rates of potential increase.42 An example of such local investigation is presented in Fig. 5 as measured on the previously identified Cu-7.7 at% Pd alloy (as the most sensitive for further formaldehyde quantification). The arrow in the figure indicates the increasing scan rate varied between 10 and 100 mV s−1. As expected, the maximum of the formaldehyde oxidation current density peak increases with increasing scan rate. The dependency of the oxidation current density maximum on the square root of the scan rate is presented in the inlet of Fig. 5. A linear behaviour is observed which indicates a reversible diffusion controlled process for the formaldehyde oxidation. This finding suggests that the use of the Cu–Pd alloys in a formaldehyde sensor is possible without the limitations induced by a charge transfer limited process. However, cyclic tests for assessing the effective reversibility of such device are still highly recommended due to possible additional side reactions and/or material degradation.
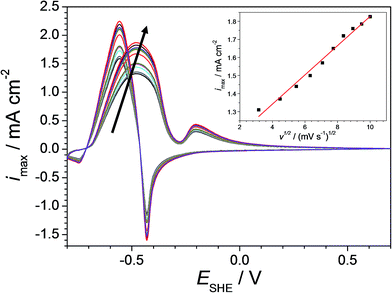 | ||
| Fig. 5 Cyclic voltammograms on Cu-7.7 at% Pd at different scan rates (from inner to outer cycle in the arrow direction: 10, 20, 30, 40, 50, 60, 70, 80, 90 and 100 mV s−1). | ||
Even though the entire analysed Cu–Pd compositional spread showed suitability for being implemented in formaldehyde sensing (with immediate qualitative detection capabilities), only the identified Cu-7.7 at% Pd thin film alloy having the highest electrocatalytic effect was further investigated for quantitative detection. In order to describe the sensing efficiency, the amperometric response of the Cu-7.7 at% Pd thin film alloy was determined. For this purpose, a time dependent curve was recorded at the oxidation potential (−0.47 V vs. SHE). Fig. 6 presents the obtained results after successive formaldehyde additions to the electrolyte depicting increased concentrations (0–300 mM) as suggested by the arrow. The online observation of formaldehyde detection was achieved by flowing the electrolyte through the FT-SDCM with a flow rate of approximately 30 ml h−1. During the first 200 s the measurement was performed prior to formaldehyde addition for defining a background reference level. Soon after the potential onset the current density value decayed fast and levelled in a plateau at 0.02 mA cm−2 (after 60 s). Addition of 0.5 mM formaldehyde triggered a current density value increase and the formaldehyde oxidation process was indicated by a new higher steady state current density plateau. Each subsequent increase of the formaldehyde concentration resulted in an accordingly increased current density value, which can be easily observed in Fig. 6.
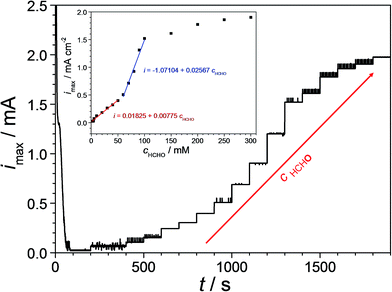 | ||
| Fig. 6 Amperometric formaldehyde detection on Cu-7.7 at% Pd at various formaldehyde concentrations (0–300 mM). The inlet presents the emerging calibration curve for the formaldehyde oxidation. | ||
In order to determine the formaldehyde sensing efficiency of the Cu-7.7 at% Pd the current density plateau values were plotted as a function of the formaldehyde concentration. The inlet of Fig. 6 presents the obtained calibration curve for the used thin film alloy. A limiting current density saturation level was reached for formaldehyde concentrations higher than 100 mM indicating the maximum detectable value. At formaldehyde concentrations above 100 mM the coverage of the catalyst surface is likely approaching unity due to intermediate species adsorption and longer time is therefore required for fresh formaldehyde molecules to reach the metallic surface. When the formaldehyde concentration remains below this higher limit two linear zones can be observed. In the first linear zone (0–50 mM) the slope of the fitted calibration curve (exact values are assigned in the figure) indicates an increase of the current density value of 7.7 μA cm−2 after the addition of each 1 mM of formaldehyde to the solution. The second linear zone (60–100 mM) has a slope more than three times higher. The addition of 1 mM formaldehyde to the solution in this zone resulted in an increase of the current density value to 25.6 μA cm−2. For both zones, correlation coefficients above 0.99 were obtained from the linear fitting of the experimental data. These observations indicate that the investigated formaldehyde sensing candidate alloy exhibits its highest sensitivity in a concentration range of 60–100 mM.
Several other relevant parameters for further device development such as reproducibility, repeatability and stability were characterized for the Cu–Pd formaldehyde sensing alloys. First, the formaldehyde detection reproducibility of the Cu–Pd thin film alloys was assessed along the entire compositional spread. For this purpose cyclic voltammograms similar to those exemplified in Fig. 3 were recorded along the entire library. The obtained results indicated a relative standard deviation of the formaldehyde current density values of maximum 8% along the investigated composition and this information was used for defining the error bars presented in Fig. 4.
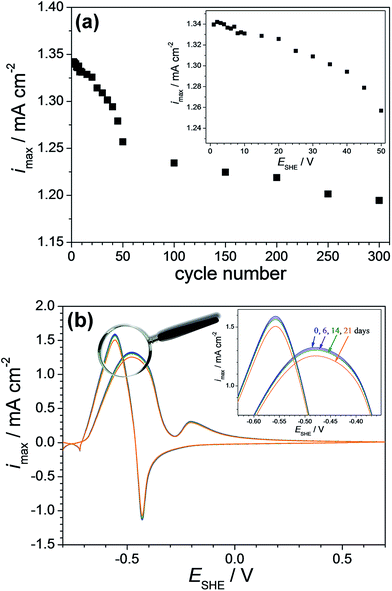
Second, the repeatability of the screened Cu-7.7 at% Pd thin film alloy was observed by recording cyclic voltammograms under a constant flow with a flow rate in the range of ml h−1. The electrolyte flow condition was chosen for avoiding local modification of electrolyte in the vicinity of the electrocatalytic surface simulating a sequential use of an actual device. The potentiodynamic repeatability was evaluated by sequentially cycling up to the oxidation potential. For this purpose cyclic voltammetric measurements were performed in a potential range of −0.70 to −0.47 V (SHE) with a potential scan rate of 0.05 V s−1. Fig. 7(a) presents the obtained current density values corresponding to formaldehyde oxidation as a function of the cycle number (for up to 300 cycles) and its inlet provides a zoomed-in view for the first 50 cycles. After the first 5 cycles the decrease of the current density peak used for sensing was almost imperceptible while values as high as 10 μA cm−2 were reached during the next 5 cycles. This value limit may be considered as acceptable for a reuse of the sensor especially in the 60–100 mM concentration range with a resolution slightly below 500 μM. During the next 15 cycles the current density decreased with 2% from the initial current density values. This drop is followed by an almost linear decrease of the current density values with the cycle number. After 50 cycles the current density value remained at 94% of the initial value while after 300 consecutive cycles it decreases with 11% from the initial value. Following these observations the stability assessment indicates that a formaldehyde sensor based on Cu-7.7 at% Pd would reliably operate 5 to 10 times consecutively as a function of detection range.
Third, the stability of Cu-7.7 at% Pd alloy vis-à-vis formaldehyde detection was tested after sample storage for 6, 14 and 21 days in normal laboratory environment. For this purpose cyclic voltammetric measurements were performed on the same spot. Following each measurement, the investigated material library was rinsed with distilled water and dried in nitrogen flow. The obtained results are presented in Fig. 7(b). After 6 days, the current density value at its maximum in the anodic scan direction decreases with 0.8% and after 14 days with 1.6% from the initial value of approximately 1.30 mA cm−2. The current density value remained 94.5% of the initial value after 21 days, which indicates a good long term stability behaviour motivating the use of Cu-7.7 at% Pd. Overall, the fabricated Cu-7.7 at% Pd thin film alloy showed excellent reproducibility, repeatability and stability.
For assessing if the outcome of the present screening using Cu–Pd thin film alloys is applicable for bulk materials as well, several Cu–Pd bulk alloys were fabricated and analysed. Their electrocatalytic activity towards formaldehyde oxidation was investigated in identical conditions as the thin films. Cyclic voltammetric measurements were performed on pure Cu, Cu-4.8 at% Pd and Cu-7.5 at% Pd bulk alloys in a potential range from −0.80 V to 0.70 V (SHE) with a rate of potential increase of 0.01 V. The anodic scan of each measurement is presented in Fig. 8. Similar to the thin film case, increasing the Pd content in the bulk alloy resulted in an increased value for the maximum current density describing the oxidation of formaldehyde. The highest catalytic effect was found for Cu-7.5 at% Pd bulk at a potential of 0.55 V (SHE). The maximum current density value measured for Cu-7.5 at% Pd (2.5 mA cm−2) is 3 times higher than the one measured on the bulk alloy with lower Pd content (0.75 mA cm−2) and 5 times higher as compared with the bulk pure Cu. Even though the current density value of the anodic formaldehyde oxidation peak on the bulk Cu-7.5 at% Pd alloy is higher when compared to the value measured on the Cu-7.7 at% Pd thin film, the corresponding relative intensities reported to the height of the anodic peak on pure Cu is almost the same in both cases. Peak ratios of approximately 4.5 can be measured from both cyclic voltammogram series in the case of thin films (see Fig. 3) and bulk alloys (see Fig. 8) suggesting a good reproducibility of the screened composition. Moreover, chemical surface etching of the bulk alloys with concentrated HCl prior to the formaldehyde detection (see Sup. 4†) resulted in a very small current peak increase (likely due to surface increase through roughening) eliminating therefore the possibility of catalytic enhancement due to microstructural and/or surface contaminants. Stability tests performed on the bulk Cu–Pd alloy (see Sup. 5†) confirmed the results previously discussed for the thin films.
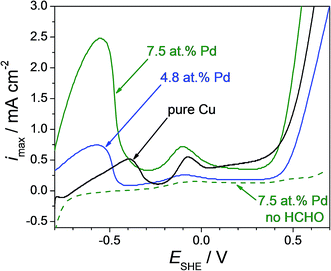 | ||
| Fig. 8 Cyclic voltammogram performed on pure Cu and Cu–Pd bulk alloys in alkaline solution with (continuous line) and without (dotted line) addition of 90 mM formaldehyde to the electrolyte. | ||
4. Conclusion
In the present work a Cu–Pd thin film combinatorial library deposited by co-evaporation was screened for electrocatalytic activity vis-à-vis formaldehyde oxidation in alkaline solutions. Microstructure and crystallographic analysis of various alloys indicated a gradual change of properties without any significant discontinuity. Electrochemical screening for formaldehyde oxidation however, clearly identified a certain composition (Cu-7.7 at% Pd) as having a maximum efficiency. In conclusion, the Cu–Pd atomic ratio is indicated as the main factor affecting the electrocatalytic activity of the investigated alloys. This finding is also confirmed for bulk Cu–Pd alloys where the screened compositional reproducibility for oxidation of formaldehyde was demonstrated. The proof of principle for an amperometric formaldehyde sensor is completed by reproducibility, repeatability and stability measurements. A standard deviation value of 8% was measured during successive observations of the anodic current oxidation peak corresponding to formaldehyde, 5 to 10 successive employments of the same sensor were demonstrated and a maximum of 5% current density decrease was noted after 21 days of normal environment storage of the Cu–Pd alloy. Overall, the study reveals an inexpensive approach for fabrication of multiple use formaldehyde sensors via thermal evaporation or direct bulk alloy casting competing with the more complex co-sputtering approach. Also, by using combinatorial approaches, an optimal Cu–Pd composition with low Pd amounts has been screened in thin films, composition which was further used in bulk alloy production. This study revealed the complete properties transfer between the thin films and bulk, with the same enhanced feature (i.e. current density maximum for formaldehyde oxidation) being found for the same composition in both thin layers (<500 nm) and mm thick active materials.Acknowledgements
The financial support by the Austrian Federal Ministry of Science, Research and Economy and the National Foundation for Research, Technology and Development through the Christian Doppler Laboratory for Combinatorial Oxide Chemistry (COMBOX) is gratefully acknowledged.References
- Electroless Plating and fundamentals and applications, ed. G. O. Mallory and J. B. Hajdu, AESF, Orlando, 1990 Search PubMed.
- R. Ojani, J. B. Raoof and S. Safshekan, Electrochim. Acta, 2014, 138, 468 CrossRef CAS.
- E. A. Batista and T. Iwasita, Langmuir, 2006, 22, 7912 CrossRef CAS PubMed.
- H. Berndt, A. Martin, A. Brückner, E. Schreier, D. Müller, H. Kosslick, G. U. Wolf and B. Lücke, J. Catal., 2000, 191, 384 CrossRef CAS.
- Y. Zhang, M. Zhang, Z. Cai, M. Chen and F. Cheng, Electrochim. Acta, 2012, 68, 172 CrossRef CAS.
- Y. Li, N. Chen, D. Deng, X. Xing, X. Xia and Y. Wang, Sens. Actuators, B, 2017, 238, 264 CrossRef CAS.
- A. P. Murphy, W. J. Boegll, M. K. Price and C. D. Moody, Environ. Sci. Technol., 1989, 23, 166 CrossRef CAS.
- C. Dong, X. Liu, B. Han, S. Deng, X. Xiao and Y. Wang, Sens. Actuators, B, 2016, 224, 193 CrossRef CAS.
- C. Y. Ma, D. H. Wang, W. J. Xue, B. J. Dou, H. L. Wang and Z. P. Hao, Environ. Sci. Technol., 2011, 45, 3628 CrossRef CAS PubMed.
- D. Y. C. Leung, X. Fu, D. Q. Ye and H. B. Huang, Kinet. Catal., 2012, 53, 239 CrossRef CAS.
- Q. L. Xu, W. Y. Lei, X. Y. Li, X. Y. Qi, J. G. Yu, G. Liu, J. L. Wang and P. Y. Zhang, Environ. Sci. Technol., 2014, 48, 9702 CrossRef CAS PubMed.
- D. Chen, Z. Qu, Y. Sun, Y. Lv, X. Lu, W. Chen and X. Gao, J. Mol. Catal. A: Chem., 2015, 404–405, 98 CrossRef CAS.
- P. H. Lia and H. M. Yang, Catal. Lett., 2008, 121, 274 CrossRef.
- H. Okamoto, N. Tanaka and M. Naito, J. Phys. Chem. A, 1998, 102, 7343 CrossRef CAS.
- T. R. Felthouse and J. A. Murphy, J. Catal., 1986, 98, 411 CrossRef CAS.
- G. Samjeske, A. Miki and M. Osawa, J. Phys. Chem. C, 2007, 41, 15074 Search PubMed.
- Q. Yi, F. Niu and W. Yu, Thin Solid Films, 2011, 519, 3155 CrossRef CAS.
- J. B. Raoof, S. R. Hosseini, R. Ojani and S. Aghajani, J. Mol. Liq., 2015, 204, 106 CrossRef CAS.
- K. Mandal, D. Bhattacharjee, P. S. Roy, S. K. Bhattacharya and S. Dasgupta, Appl. Catal., A, 2015, 492, 100 CrossRef CAS.
- A. J. Armenta-González, R. Carrera-Cerritos, M. Guerra-Balcázar, L. G. Arriaga and J. Ledesma-García, J. Appl. Electrochem., 2015, 45, 33 CrossRef.
- I. Pötzelberger, A. I. Mardare and A. W. Hassel, Phys. Status Solidi A, 2015, 212, 1184 CrossRef.
- I. Pötzelberger, A. I. Mardare and A. W. Hassel, Phys. Status Solidi A, 2016, 213, 1434 CrossRef.
- J. B. Raoof, R. Ojani, S. R. Hosseini and S. Aghajani, Int. J. Hydrogen Energy, 2013, 38, 16394 CrossRef CAS.
- S. M. Williams, K. R. Rodriguez, S. Teeters-Kennedy, A. D. Stafford, S. R. Bishop, U. K. Lincoln and J. V. Coe, J. Phys. Chem. B, 2004, 108, 11833 CrossRef CAS.
- C. Xu, Y. Liu, J. Wang, H. Geng and H. Qiu, J. Power Sources, 2012, 199, 124 CrossRef CAS.
- I. Pötzelberger, C. C. Mardare, W. Burgstaller and A. W. Hassel, Appl. Catal., A, 2016, 525, 110 CrossRef.
- A. I. Mardare, C. C. Mardare and E. Joanni, J. Eur. Ceram. Soc., 2005, 25, 735 CrossRef CAS.
- J. P. Kollender, M. Voith, S. Schneiderbauer, A. I. Mardare and A. W. Hassel, J. Electroanal. Chem., 2015, 740, 53 CrossRef CAS.
- A. W. Hassel and M. M. Lohrengel, Electrochim. Acta, 1997, 42, 3327 CrossRef CAS.
- G. Schimo, C. D. Grill, J. P. Kollender and A. W. Hassel, J. Solid State Electrochem., 2016, 20, 2749 CrossRef CAS.
- A. I. Mardare and A. W. Hassel, Rev. Sci. Instrum., 2009, 80, 046106 CrossRef PubMed.
- K. P. Rataj, C. Hammer, B. Walther and M. M. Lohrengel, Electrochim. Acta, 2013, 90, 12 CrossRef CAS.
- W. Roethke, Praktikum der Massanlayse, Harri Deutsch, Thun and Frankfurt/Main, 2nd edn, 1980 Search PubMed.
- T. G. S. Babu, T. Ramachandran and B. Nair, Microchim. Acta, 2010, 169, 49 CrossRef CAS.
- A. Vaskelis, E. Norkus, I. Stalnioniene and G. Stalnionis, Electrochim. Acta, 2004, 49, 1613 CrossRef CAS.
- M. H. Martin and A. Lasia, Electrochim. Acta, 2008, 53, 6317 CrossRef CAS.
- J. F. Lin, M. Mohl, G. Toth, R. Puskas, A. Kukovez and K. Kordas, Top. Catal., 2015, 58, 1119 CrossRef CAS.
- J. J. Byerly and W. K. Teo, Can. J. Chem., 1969, 47, 3355 CrossRef.
- D. Preti, S. Squarcialupi and G. Fachinetti, Angew. Chem., Int. Ed., 2009, 48, 4763 CrossRef CAS PubMed.
- R. Ramanauskas, I. Jurgaitiene and A. Vaškelis, Electrochim. Acta, 1997, 42, 191 CrossRef CAS.
- J. Jin, P. Li, G. Liu, B. Zheng, H. Yuan and D. Xiao, J. Mater. Chem. A, 2013, 1, 14736 Search PubMed.
- A. J. Bard and L. R. Faulkner, Electrochemical Methods: Fundamentals and Applications, John Wiley and Sons Publishers, 2nd edn, 2001 Search PubMed.
Footnote |
| † Electronic supplementary information (ESI) available. See DOI: 10.1039/c6ra27817e |
| This journal is © The Royal Society of Chemistry 2017 |

