 Open Access Article
Creative Commons Attribution 3.0 Unported Licence
Fe–N-Doped carbon foam nanosheets with embedded Fe2O3 nanoparticles for highly efficient oxygen reduction in both alkaline and acidic media†
Xueyan Xu,
Chengxiang Shi,
Qi Li,
Rui Chen and
Tiehong Chen *
*
Institute of New Catalytic Materials Science, School of Materials Science and Engineering, Key Laboratory of Advanced Energy Materials Chemistry (MOE), Collaborative Innovation Center of Chemical Science and Engineering (Tianjin), Nankai University, Tianjin 300350, PR China. E-mail: chenth@nankai.edu.cn
First published on 8th March 2017
Abstract
We report a facile two-step pyrolysis and acid leaching process to fabricate a high performance oxygen reduction reaction (ORR) electrocatalyst Fe2O3@Fe–N–C, which is composed of Fe–N-doped carbon foam nanosheets with embedded carbon coated Fe2O3 nanoparticles to enhance the ORR performance in acidic medium. The ORR activities of the Fe2O3@Fe–N–C electrocatalysts obtained at different pyrolysis temperatures are investigated and the catalyst fabricated by pyrolysis at 800 °C displays the optimal activity. A rotating disk electrode (RDE) study reveals that it exhibits a positive half-wave potential of 0.535 V (vs. Ag/AgCl), high selectivity (4e− process), excellent long-term stability (96.3% of the initial current remaining after 20![[thin space (1/6-em)]](https://www.rsc.org/images/entities/char_2009.gif) 000 s of continuous operation) and good tolerance against the methanol-crossover effect in acidic medium, making it a promising candidate for substituting the commercial Pt/C catalyst in polymer electrolyte membrane fuel cells (PEMFCs). The remarkable ORR activity originates from the cooperative effect of carbon coated Fe2O3 nanocrystals and Fe–N-doped carbon foam nanosheets. Moreover, the porous structure, high specific surface area, and electron conductivity could contribute to the enhanced ORR performance.
000 s of continuous operation) and good tolerance against the methanol-crossover effect in acidic medium, making it a promising candidate for substituting the commercial Pt/C catalyst in polymer electrolyte membrane fuel cells (PEMFCs). The remarkable ORR activity originates from the cooperative effect of carbon coated Fe2O3 nanocrystals and Fe–N-doped carbon foam nanosheets. Moreover, the porous structure, high specific surface area, and electron conductivity could contribute to the enhanced ORR performance.
Introduction
Electrochemical energy conversion devices are very important in the green energy field due to their high efficiency, scalability, reversibility and cleanness.1 Polymer electrolyte membrane fuel cells (PEMFCs) are currently regarded as one of the most reliable sustainable energy conversion devices for transport, and stationary and portable applications.2 Until now, Pt-based and Pt alloy electrocatalysts have been considered as the most suitable electrocatalysts for the hydrogen oxidation reaction (HOR) and oxygen reduction reaction (ORR) at the anode and cathode of PEMFCs, respectively.3,4 However, the high cost, scarcity and poor durability of Pt would hinder its widespread application in PEMFCs. Meanwhile, the sluggish kinetics of the ORR results in serious cathode polarization and energy loss, and improving the cathode catalysts is a great concern. Development of non-precious metal catalysts (NPMCs) with high activity and robust durability remains a big challenge.Among various NPMCs, one of the most promising alternatives to Pt could be M–N–C electrocatalysts (M = transition metal, i.e. Fe or Co). Fe-Containing species have been studied for ORR, including iron–nitrogen complexes,5–12 iron nitrides,13,14 iron carbides,15–20 iron oxides,21–31 metallic iron,32,33 composites and bimetallic compounds.21,34–36 It has been reported that Fe2O3 or FeOOH supported on different carbons including graphene sheets, carbon nanotubes and heteroatom-doped carbon, exhibited highly efficient ORR property.23,25–31,37 However, most of the reported Fe-containing catalysts worked only in alkaline medium, and this would limit their application in PEMFCs because the electrolyte is acidic solution. Zang et al. reported that Fe/Fe2O3 nanoparticles anchored on Fe–N-doped carbon nanosheets exhibited high ORR catalytic activity and durability in both alkaline and acidic conditions.24 Choi et al. proposed that Fe/Fe2O3 encapsulated by N-doped graphitic carbon could be used as the ORR catalyst in acid medium, although the activity needed further improvement.25 However, it still remains unclear which would be the active species in the above mentioned Fe/Fe2O3 electrocatalysts due to the co-existence of Fe and Fe2O3.
Herein, we present a facile and effective route to prepare catalyst with pure Fe2O3 nanoparticles embedded in the Fe–N-doped graphitic carbon nanosheets (Fe2O3@Fe–N–C) by a two-step pyrolysis of hemin and dicyandiamide. The electrocatalytic activities of the resulting Fe2O3@Fe–N–C composites were evaluated toward ORR in both alkaline and acidic media. The experimental results indicated that Fe2O3@Fe–N–C pyrolyzed at 800 °C exhibited a superior ORR activity and high stability, which was comparable to that of the commercial Pt/C catalyst.
Experimental
Chemicals and materials
All reagents were of analytical grade and used without further purification. Hemin was from Aladdin Chemical (China). Dicyandiamide (DCDA) and Pt/C (20% by wt, Pt nanoparticles on a Vulcan XC-72 carbon support) catalyst were purchased from Alfa Aesar. Nafion solution (5% in a mixture of lower aliphatic alcohols and water) was from Sigma Aldrich.General synthesis of catalysts
In a typical procedure, dicyandiamide (DCDA, 2 g), hemin (0.2 g), distilled water (10 mL) and ethanol (10 mL) were stirred at 60 °C until the solution completely evaporated. The dried Fe2O3@Fe–N–C precursor was placed into a crucible and then heated to an appointed temperature (700, 800, and 900 °C) with the rate of 3 °C min−1, and maintained at the temperature for 2 h in N2 atmosphere. To remove unstable phases, the pyrolyzed samples were treated in 0.5 M H2SO4 solution at 90 °C for 8 h. The acid-treated samples were washed with water until the solution was neutral, dried at 100 °C for 12 h, and then pyrolyzed again at the corresponding temperature for 2 h under N2 atmosphere to obtain the final samples. The products were referred to as Fe2O3@Fe–N–C-T (T denoting the annealing temperature).Fe2O3@Fe–N–C-800 was ground by ball-mill machine, and agitated at 800 rpm for 4 h. After milling, the catalyst was leached in 0.5 M H2SO4 at 90 °C for 12 h to remove Fe2O3 nanoparticles and submitted to further heat treatment. The resulting sample was named as Fe2O3@Fe–N–C-800-BM.
Characterization
Field-emission scanning electron microscopy (FESEM; JEOL, JSM-7500F, 8 kV) was used to analyze the surface morphology of the prepared samples. Transmission electron microscopy (TEM) was performed on a Philips Tecnai F20 microscope, working at 200 kV. All samples subjected to TEM measurements were dispersed in ethanol ultrasonically and were dropped on copper grids. Raman spectra were examined with a Lab RAMHR Raman spectrometer using laser excitation at 514.5 nm. Powder X-ray diffraction (XRD) patterns were recorded on a D/max-2500 diffractometer (Rigaku, Japan) using Cu Kα radiation (λ = 1.5406 Å). X-ray photoelectron spectroscopy (XPS) were obtained with a ESCALAB 250Xi spectrometer. Nitrogen adsorption and desorption isotherms were measured on a BELSORP-mini II sorption analyser at 77 K.Electrochemical measurements
Prior to use, the glassy carbon rotating disk electrode (5 mm in diameter, 0.196 cm2 in surface area) was polished mechanically with 1.0 μm down to 0.05 μm alumina slurry to obtain a mirror-like surface and then washed with distilled water and allowed to dry. For electrode preparation, 4 mg sample was dispersed in 1 mL of H2O by sonication for 30 min at least. Then 20 μL of the resulting homogeneous suspension was carefully dropped with pipettor onto a rotating disk electrode (RDE), which was air-dried to allow solvent evaporation. After drying at room temperature, 3 μL of 5 wt% Nafion solution was further dropped to form a protection layer against catalyst detaching from the electrode surface, the loading was 410 μg cm−2. High-purity N2 or O2 was purged for 30 min at least before each test. For comparison, the benchmark commercial Pt/C (20 wt% Pt on Vulcan XC-72) catalyst was also fabricated into electrodes through similar procedure. The loading amount was 41 μg Pt per cm2 in both alkaline and acid media.All electrochemical experiments were conducted at room temperature on a RRDE-3A (ALS, Japan) device in conjunction with a CHI660D electrochemical workstation. A three-electrode system includes a glassy carbon RDE coated with catalysts, a platinum wire auxiliary electrode, and a Ag/AgCl (3 M KCl) reference electrode. Before each ORR experiment, the electrolyte was purged with O2 for at least 30 min. The ORR activity was evaluated by cyclic voltammetry (CV) and linear sweep voltammetry (LSV) technique on RDE in O2-saturated 0.1 M KOH and 0.5 M H2SO4 electrolytes. All the CV measurements were conducted at a scan rate of 10 mV s−1, and the LSV curves were recorded at a scan rate of 5 mV s−1. The chronoamperometric measurement (i–t) was used to investigate the electrode stability at the bias potential of −0.5 V and 0.3 V (vs. Ag/AgCl) in O2-saturated 0.1 M KOH solutions and 0.5 M H2SO4 with a rotation rate of 1600 rpm, respectively. Then, the tolerance to the methanol crossover was tested by adding 3 M methanol into the O2-saturated electrolyte solution. The kinetic parameters were analyzed with the Koutecky–Levich equation (details see ESI†).
Results and discussion
The synthesis process of Fe2O3@Fe–N–C catalysts was direct pyrolysis of the mixture of hemin and dicyandiamide under N2 atmosphere at different temperatures. By adjusting the pyrolysis temperature the surface properties and composition of the as-prepared catalysts could be tuned in a wide range. XRD patterns of three synthesized samples at different pyrolysis temperatures were collected and shown in Fig. 1a. The strong peak at 2θ = 25.1° can be assigned to the (002) plane of carbon.21 With the increase of pyrolysis temperature, the peak became stronger and narrower, indicating the formation of an increasingly ordered graphitic structure. For sample Fe2O3@Fe–N–C-700, no peaks originating from iron species (such as iron, iron oxides, iron nitrides, iron chlorides and iron carbides) were detected, implying that the iron species were most likely in the form of Fe–N bonds.38 When the pyrolysis temperature increased to 800 °C, diffraction peaks indexed to Fe2O3 (JCPDS, no. 39-1346) were found, and it was proved by XPS as shown in the following discussion. Moreover, the intensities of the diffraction peaks of Fe2O3 were enhanced with increasing pyrolysis temperature. The oxygen in Fe2O3 could mainly originate from the O-containing functional groups of the carbon sources during the high-temperature pyrolysis.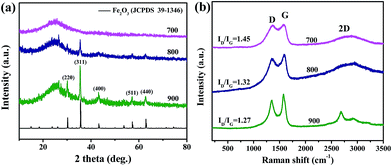 | ||
| Fig. 1 (a) XRD patterns and (b) Raman spectrum of Fe2O3@Fe–N–C catalysts synthesized at different temperatures. | ||
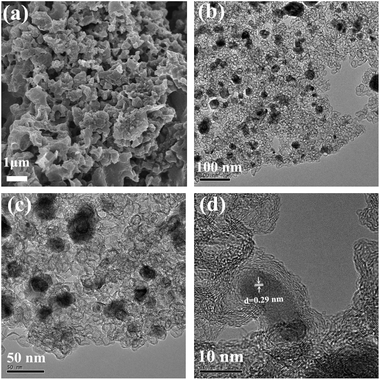
The structures of the Fe2O3@Fe–N–C-T samples were further examined by SEM and TEM measurements (Fig. 2 and S1†). After the pyrolysis treatment, Fe2O3@Fe–N–C-800 exhibited a spongy aggregated morphology (Fig. 2a). The TEM images (Fig. 2b and c) showed the presence of highly graphitized carbon nanosheets mainly composed of graphitic carbon foams in the Fe2O3@Fe–N–C-800; meanwhile, Fe2O3 nanoparticles with a size range of about 20–50 nm were embedded in the carbon nanosheets. Notably, high-resolution TEM (HR-TEM) image (Fig. 2d) showed that Fe2O3 nanoparticles were uniformly encapsulated by graphitic carbon shells, forming a well-defined metal oxide-graphitized carbon core–shell structure. At the same time, the lattice spacing of 0.29 nm was ascribed to the (220) plane of Fe2O3 (Fig. 2d). The area of the carbon foam nanosheets without any Fe2O3 nanoparticles was characterized by mapping images as shown in Fig. S2.† It can be found that Fe elements were doped in the graphitic carbon and both iron and nitrogen species were homogeneous distributed in carbon support, indicating the formation of Fe–N-doping carbon nanosheets. For the sample Fe2O3@Fe–N–C-700, no detectable metal nanoparticles were found, in agreement with the result of the XRD pattern (Fig. S1a and b†), revealing that Fe ions could exist in the form of Fe–N–C rather than formation of iron or iron oxide. When the pyrolysis temperature increased to 900 °C, as seen in Fig. S1c and d,† the carbon coated Fe2O3 nanoparticles were still uniformly embedded in the carbon nanosheets.
Fig. 1b showed the Raman spectra of all the Fe2O3@Fe–N–C-T composites, where two prominent peaks in the Raman spectrum at 1359 cm−1 (D band) and 1588 cm−1 (G band) were attributable to imperfections in sp2 carbon structures and the E2g vibrational mode of sp2 bonded carbon atoms in graphene sheets, respectively. The broad 2D bands at around 2700 cm−1 were characteristic of graphitic carbon.39 The ID/IG values were 1.45, 1.32 and 1.27 for Fe2O3@Fe–N–C-700, Fe2O3@Fe–N–C-800 and Fe2O3@Fe–N–C-900, respectively (Fig. 1b). These results indicated an increase of the graphitization degree of the carbon with increasing pyrolysis temperature. This might be favorable for electron transfer during electrocatalysis.
To further elucidate the doped element and bonding configurations, XPS measurements (Fig. 3) were conducted on Fe2O3@Fe–N–C-T. The surface survey XPS spectra show the presence of C, N, O and Fe in the samples. Furthermore, the high-resolution spectrum of C 1s (Fig. S3b†) could be deconvoluted mostly into four single peaks corresponding to 284.6 eV (C1, C![[double bond, length as m-dash]](https://www.rsc.org/images/entities/char_e001.gif) C), 285.9 eV (C2, C
C), 285.9 eV (C2, C![[double bond, length as m-dash]](https://www.rsc.org/images/entities/char_e001.gif) N and C–O), 288.3 eV (C3, C–N and C
N and C–O), 288.3 eV (C3, C–N and C![[double bond, length as m-dash]](https://www.rsc.org/images/entities/char_e001.gif) O) and 290.8 eV (C4, O–C
O) and 290.8 eV (C4, O–C![[double bond, length as m-dash]](https://www.rsc.org/images/entities/char_e001.gif) O), indicating the existence of heteroatoms in the hybrids. Remarkably, the significant difference of the sp2-hybridized carbon atom (C1 type; 58.1 at%, 60.9 at%, and 62.5 at% at 700 °C, 800 °C and 900 °C, respectively) obviously demonstrates an improvement of degree of graphitization for the obtained Fe2O3@Fe–N–C with the increase of temperature. As shown in Fig. S3c,† the N 1s spectra could be deconvoluted with three peaks at 398.3, 400.6, and 404.0 eV, indicating the presence of pyridinic-N, graphitic-N, and oxidized-N, respectively. Furthermore, the total N content was decreased from 17.8 at% to 4.8 at% when the annealing temperature increased from 700 °C to 900 °C, due to instability of N dopant at elevated temperature. The content of N in various configurations is listed in Table S2.† The presence of oxygen was probably due to the physicochemically adsorbed oxygen and the residual oxygen-containing species from the precursor. Fig. 3d showed the high-resolution spectra of Fe 2p, which could be deconvoluted with two pairs of peaks for Fe3+ (714.2 and 729.3 eV) and Fe2+ (711.3 and 724.2 eV) with a satellite peak at 718.8 eV (Fig. S3d†). Notably, the signal of Fe0 at 707 eV was not detected in the sample Fe2O3@Fe–N–C-800 and Fe2O3@Fe–N–C-900, further demonstrating the absence of Fe0 in the catalysts. In addition, the satellite Fe 2p3/2 peak at 718.8 eV was characteristic of Fe2O3, while for Fe3O4 the satellite peak was generally at ca. 715–716 eV.40 Therefore, it is believed that Fe2O3 was the only iron compound in Fe2O3@Fe–N–C-800 and Fe2O3@Fe–N–C-900, from both XRD and XPS observations. According to the previous reports,41,42 the peak at 711.3 eV in the Fe 2p3/2 XPS spectrum demonstrates the presence of Fe–Nx bonding.
O), indicating the existence of heteroatoms in the hybrids. Remarkably, the significant difference of the sp2-hybridized carbon atom (C1 type; 58.1 at%, 60.9 at%, and 62.5 at% at 700 °C, 800 °C and 900 °C, respectively) obviously demonstrates an improvement of degree of graphitization for the obtained Fe2O3@Fe–N–C with the increase of temperature. As shown in Fig. S3c,† the N 1s spectra could be deconvoluted with three peaks at 398.3, 400.6, and 404.0 eV, indicating the presence of pyridinic-N, graphitic-N, and oxidized-N, respectively. Furthermore, the total N content was decreased from 17.8 at% to 4.8 at% when the annealing temperature increased from 700 °C to 900 °C, due to instability of N dopant at elevated temperature. The content of N in various configurations is listed in Table S2.† The presence of oxygen was probably due to the physicochemically adsorbed oxygen and the residual oxygen-containing species from the precursor. Fig. 3d showed the high-resolution spectra of Fe 2p, which could be deconvoluted with two pairs of peaks for Fe3+ (714.2 and 729.3 eV) and Fe2+ (711.3 and 724.2 eV) with a satellite peak at 718.8 eV (Fig. S3d†). Notably, the signal of Fe0 at 707 eV was not detected in the sample Fe2O3@Fe–N–C-800 and Fe2O3@Fe–N–C-900, further demonstrating the absence of Fe0 in the catalysts. In addition, the satellite Fe 2p3/2 peak at 718.8 eV was characteristic of Fe2O3, while for Fe3O4 the satellite peak was generally at ca. 715–716 eV.40 Therefore, it is believed that Fe2O3 was the only iron compound in Fe2O3@Fe–N–C-800 and Fe2O3@Fe–N–C-900, from both XRD and XPS observations. According to the previous reports,41,42 the peak at 711.3 eV in the Fe 2p3/2 XPS spectrum demonstrates the presence of Fe–Nx bonding.
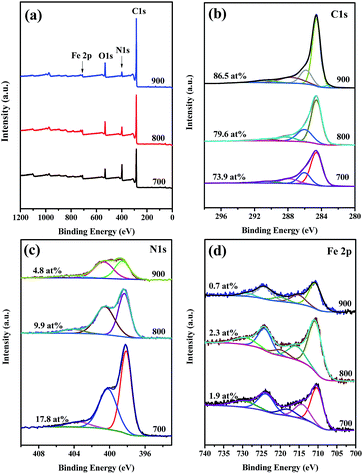 | ||
| Fig. 3 (a) Wide XPS survey of the Fe2O3@Fe–N–C-T. High-resolution (b) C 1s, (c) N 1s, and (d) Fe 2p spectra of the Fe2O3@Fe–N–C-T. | ||
Fig. S4a† showed the N2 adsorption and desorption isotherm of Fe2O3@Fe–N–C-T. Fe2O3@Fe–N–C-800 possessed the highest specific surface area (646 m2 g−1, Table S1†) and total pore volume (0.85 cm3 g−1, Table S1†). Obviously, the high surface area and pore volume are favorable for the exposure of catalytic active sites to oxygen molecules and efficient mass transport and would improve the electrocatalytic performance.
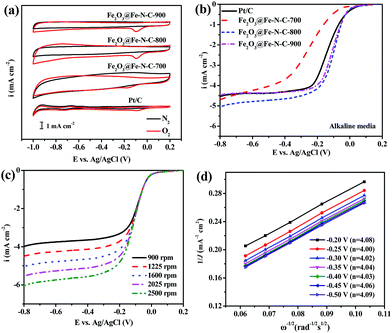
The electrocatalytic activities of the catalysts obtained at different pyrolysis temperatures were measured in O2-saturated 0.1 M KOH aqueous solution at room temperature by using RDE. No cathodic reduction current peaks were observed in the CV measurements (Fig. 4a) for all Fe2O3@Fe–N–C catalysts and the commercial Pt/C catalyst in a N2-saturated 0.1 M KOH solution. The ORR peaks were found at −0.095, −0.181, −0.096 and −0.098 V in the O2-saturated 0.1 M KOH solution for Pt/C, Fe2O3@Fe–N–C-700, Fe2O3@Fe–N–C-800 and Fe2O3@Fe–N–C-900, respectively. Fe2O3@Fe–N–C-800 had a very close cathodic reduction peak potential (−0.096 V) to that of commercial Pt/C (−0.095 V), indicating a high ORR catalytic activity. Linear sweep voltammograms (LSVs) of Fe2O3@Fe–N–C-T for ORR in an O2-saturated 0.1 M KOH solution at a rotation rate of 1600 rpm were displayed in Fig. 4b. The Fe2O3@Fe–N–C-800 displayed higher ORR onset potential (0.054 V) and half-wave potential (−0.104 V) values than those of Fe2O3@Fe–N–C-700 and Fe2O3@Fe–N–C-900 (Table S3†). With the loading of 410 μg cm−2, the ORR half-wave potential of Fe2O3@Fe–N–C-800 was 32 mV more positive than that of the commercial Pt/C (with the loading of 41 μg Pt per cm2), which was comparable with the best values of non-precious metal catalysts reported in literature.24,43 It was noticed that the ORR current density (J) over Fe2O3@Fe–N–C-800 is larger than that over Pt/C at −0.3 V and the calculated ORR kinetic current density over Fe2O3@Fe–N–C-800 (JK, 11.73 mA cm−2) at −0.1 V is much higher than the value over Pt/C (9.57 mA cm−2), indicating its highly catalytic property for ORR. The corresponding K–L plots within the potential range from −0.20 to −0.50 V exhibited good linearity with a rather constant slope (Fig. 4d), similar to that over Pt/C catalyst (Fig. S8†), suggesting first-order reaction kinetics for ORR with respect to the concentration of the dissolved oxygen and similar transferred electron numbers (n) at different electrode potentials (Fig. 4d).44 The electron transfer number calculated from the slope of the K–L plots for Fe2O3@Fe–N–C-800 catalyst was shown in the legend of Fig. 4d, suggesting that it favored a dominant 4e− reduction process. The electrochemical oxygen reduction behavior at different catalyst loading (100, 200 and 410 μg cm−2) in 0.1 M KOH solution was compared in Fig. S5a and S6,† the corresponding number of electrons transferred was calculated to be ca. 4, further indicating that Fe2O3@Fe–N–C-800 can catalyze a four-electron oxygen reduction reaction in 0.1 M KOH solution.
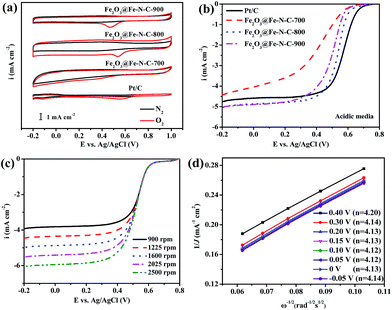
The ORR catalytic behavior of Fe2O3@Fe–N–C-T was also evaluated in acidic media. No cathodic reduction current peaks were observed in the CV measurements (Fig. 5a) for all Fe2O3@Fe–N–C-T catalysts and the commercial Pt/C catalyst in a N2-saturated 0.5 M H2SO4 solution. The cathodic reduction current peaks were found at 0.553, 0.341, 0.537 and 0.474 V in the O2-saturated 0.5 M H2SO4 solution for Pt/C, Fe2O3@Fe–N–C-700, Fe2O3@Fe–N–C-800 and Fe2O3@Fe–N–C-900, respectively. Fe2O3@Fe–N–C-800 had a close cathodic reduction peak potential (0.537 V) to that of commercial Pt/C (0.553 V), indicating a high ORR catalytic activity, similar to the result in alkaline media. Fig. 5b and Table S4† showed that Fe2O3@Fe–N–C-800 had significantly high ORR activity and its half-wave potential was only 34 mV more negative than that of Pt/C catalyst (0.569 V vs. Ag/AgCl); besides, the ORR current density (J) over Fe2O3@Fe–N–C-800 measured at 1600 rpm was larger than those over Pt/C at high potential regions (>0.4 V). The K–L plots (Fig. 5d) for Fe2O3@Fe–N–C-800 derived from Fig. 5c also exhibited good linear relationships, suggesting a first-order reaction toward the dissolved O2. Based on Fig. 5d, the electron transfer number was calculated to be around 4 at the potential range of −0.05 V to 0.40 V, implying a four-electron ORR process in 0.5 M H2SO4 solution. The K–L plots for Fe2O3@Fe–N–C-800 at different catalyst loading (100, 200 and 410 μg cm−2) in 0.5 M H2SO4 solution (Fig. S5b and S7†) also exhibited good linearity, and the value of n was approximately 4. These facts verified that Fe2O3@Fe–N–C-800 can efficiently reduce oxygen in a direct four-electron pathway in both alkaline and acidic media.
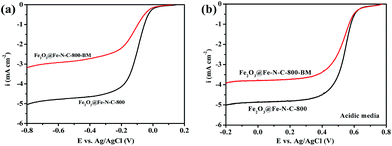
To investigate the impact of Fe2O3 nanoparticles which are embedded in the Fe–N-doped carbon nanosheets in ORR, the catalyst Fe2O3@Fe–N–C-800 was ball-milled to destroy the protective carbon shells around the iron nanoparticles. After the milling, the catalyst was leached in 0.5 M H2SO4 at 90 °C for 12 h to remove or substantially diminish Fe2O3 nanoparticles. The resulting sample was named as Fe2O3@Fe–N–C-800-BM. The XRD patterns and TEM image (Fig. S9†) confirmed that almost no Fe2O3 nanoparticles were found after the acid leaching. Fig. S11 and Table S2† showed that the total Fe content of Fe2O3@Fe–N–C-800 was 2.3 at%, while the value decreased to 0.24 at% for Fe2O3@Fe–N–C-800-BM. This further proved that almost no Fe2O3 nanoparticle was remained. As a result, the Fe2O3@Fe–N–C-800-BM showed decreased ORR activity and the corresponding number of electrons transferred in both alkaline and acid medium (Fig. 6 and S11†). This result indicated that iron oxide nanoparticles were indeed necessary for the high ORR activity in Fe2O3@Fe–N–C-800. Although the encased Fe2O3 nanoparticles were not in direct contact with the electrolyte, they still played a key role in the catalysis. In previous reports, the encased Fe/Fe3C or Fe3C nanoparticles activated the surrounding graphitic layers,17,20 making the outer surface of the carbon layer active towards the ORR. Combined with this, the high activity of Fe2O3@Fe–N–C-800 in ORR can be attributed to the presence of Fe2O3 nanoparticles which improved activity of the outer Fe–N-doped carbon layer towards the ORR.
Based on the structural characterization and electrochemical tests, it can be inferred that graphitization degree of the carbon, the specific surface area, contents of nitrogen and iron are factors that would contribute to the electrocatalytic property of the catalysts. Increasing the pyrolysis temperature from 700 to 800 °C increased graphitization degree of the carbon substrate, as well as the surface area. However, further increasing temperature to 900 °C resulted in decreasing content of doped nitrogen, surface area and iron content. Suitable pyrolysis temperature is very important to control the balance of all the structural factors, and consequently the balance between catalytic active site density and electron conductivity is in favor of ORR. The catalyst obtained at the pyrolysis temperature of 800 °C exhibited the highest ORR catalytic activity in both alkaline and acidic conditions, which is very important for an ORR electrocatalyst for practical application.
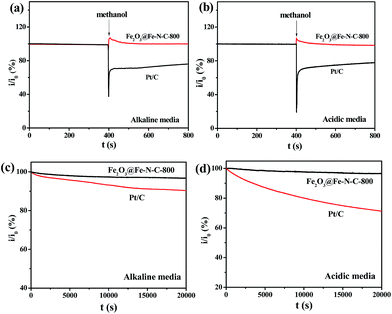
High tolerance toward fuel oxidation during cathodic reactions is of great importance in developing low-temperature fuel cells. The impact of methanol on cathodic current was observed in the chronoamperometric responses on Pt/C and Fe2O3@Fe–N–C-800 catalyst in O2-saturated 0.1 M KOH and 0.5 M H2SO4 solution, respectively (Fig. 7a and b). For Pt/C, a remarkable decrease in the ORR current density is observed, due to methanol oxidation, i.e., the poisoning of the noble metal catalyst. In sharp contrast, small activity change due to addition methanol happened to Fe2O3@Fe–N–C-800 catalyst, suggesting its excellent tolerance ability to the methanol crossover effect.
Besides high activity and high selectivity, Fe2O3@Fe–N–C-800 exhibited a strong durability as measured by a chronoamperometric response (Fig. 7c and d). The relative current of 96.7% for ORR on Fe2O3@Fe–N–C-800 in 0.1 M KOH (Fig. 7c) and 96.3% in 0.5 M H2SO4 solution (Fig. 7d) still persisted after 20![[thin space (1/6-em)]](https://www.rsc.org/images/entities/char_2009.gif) 000 s. In contrast, the ORR current on Pt/C declined to approximately 90.4% in 0.1 M KOH and 71.4% in 0.5 M H2SO4 solution measured at the same conditions. The high stability of Fe2O3@Fe–N–C-800 could be attributed to the uniformly distributed iron nanoparticles with graphitized carbon outlayer embedded in the carbon matrix, avoiding the aggregation or dissolution of iron oxide nanoparticles.
000 s. In contrast, the ORR current on Pt/C declined to approximately 90.4% in 0.1 M KOH and 71.4% in 0.5 M H2SO4 solution measured at the same conditions. The high stability of Fe2O3@Fe–N–C-800 could be attributed to the uniformly distributed iron nanoparticles with graphitized carbon outlayer embedded in the carbon matrix, avoiding the aggregation or dissolution of iron oxide nanoparticles.
Conclusions
In summary, a high-performance non-precious metal oxide catalyst for ORR in alkaline and acid medium was developed by pyrolysis of the mixture of hemin and dicyandiamide at different carbonization temperatures. The Fe2O3@Fe–N–C-800 catalyst was composed of Fe–N-doped carbon foam nanosheets and graphitized carbon coated Fe2O3 nanoparticles, and this catalyst exhibited excellent ORR activity and stability in both acidic and alkaline media. The good ORR performance of the catalyst should be attributed to the presence of carbon coated Fe2O3 nanoparticles embedded in Fe–N-doped carbon layer, the well-integration of the balance between catalytic active site density and electron conductivity. Moreover, the Fe2O3@Fe–N–C-800 catalyst exhibited good durability toward ORR in both media as well as the excellent methanol-resistance. Our work would be valuable to the design and development of low cost and abundant non-precious metal-containing N-doped carbon materials as cathode catalysts in PEMFCs.Acknowledgements
This work was supported by NSFC (no. 21373116, 21421001 and 21534005), the Tianjin Natural Science Research Fund (13JCYBJC18300), RFDP (20120031110005), and the MOE Innovation Team (IRT13022) of China.Notes and references
- M. K. Debe, Nature, 2012, 486, 43–51 CrossRef CAS PubMed.
- O. Diat and G. Gebel, Nat. Mater., 2008, 7, 13–14 CrossRef CAS PubMed.
- Y. X. Wang, H. J. Zhou, P. C. Sun and T. H. Chen, J. Power Sources, 2014, 245, 663–670 CrossRef CAS.
- X. M. Wang, Y. Orikasa and Y. Uchimoto, ACS Catal., 2016, 6, 4195–4198 CrossRef CAS.
- S. Ratso, I. Kruusenberg, A. Sarapuu, M. Kook, P. Rauwel, R. Saar, J. Aruvali and K. Tammeveski, Electrochim. Acta, 2016, 218, 303–310 CrossRef CAS.
- S. Ratso, I. Kruusenberg, A. Sarapuu, P. Rauwel, R. Saar, U. Joost, J. Aruvali, P. Kanninen, T. Kallio and K. Tammeveski, J. Power Sources, 2016, 332, 129–138 CrossRef CAS.
- A. Sarapuu, L. Samolberg, K. Kreek, M. Koel, L. Matisen and K. Tammeveski, J. Electroanal. Chem., 2015, 746, 9–17 CrossRef CAS.
- X. J. Wang, H. G. Zhang, H. H. Lin, S. Gupta, C. Wang, Z. X. Tao, H. Fu, T. Wang, J. Zheng, G. Wu and X. G. Li, Nano Energy, 2016, 25, 110–119 CrossRef.
- X. H. Yan and B. Q. Xu, J. Mater. Chem. A, 2014, 2, 8617–8622 CAS.
- M. Yang, H. B. Chen, D. G. Yang, Y. Gao and H. M. Li, J. Power Sources, 2016, 307, 152–159 CrossRef CAS.
- A. Serov, K. Artyushkova, E. Niangar, C. M. Wang, N. Dale, F. Jaouen, M. T. Sougrati, Q. Y. Jia, S. Mukerjee and P. Atanassov, Nano Energy, 2015, 16, 293–300 CrossRef CAS.
- S. Yasuda, A. Furuya, Y. Uchibori, J. Kim and K. Murakoshi, Adv. Funct. Mater., 2016, 26, 738–744 CrossRef CAS.
- J. W. Xiao, Y. Y. Xu, Y. T. Xia, J. B. Xi and S. Wang, Nano Energy, 2016, 24, 121–129 CrossRef CAS.
- M. J. Park, J. H. Lee, K. P. S. S. Hembram, K. R. Lee, S. S. Han, C. W. Yoon, S. W. Nam and J. Y. Kim, Catalysts, 2016, 6, 86–97 CrossRef.
- G. Y. Zhong, H. J. Wang, H. Yu and F. Peng, J. Power Sources, 2015, 286, 495–503 CrossRef CAS.
- Z. Y. Wu, X. X. Xu, B. C. Hu, H. W. Liang, Y. Lin, L. F. Chen and S. H. Yu, Angew. Chem., Int. Ed., 2015, 54, 8179–8183 CrossRef CAS PubMed.
- Y. L. Liu, X. Y. Xu, P. C. Sun and T. H. Chen, Int. J. Hydrogen Energy, 2015, 40, 4531–4539 CrossRef CAS.
- H. Huang, X. Feng, C. C. Du, S. Y. Wu and W. B. Song, J. Mater. Chem. A, 2015, 3, 4976–4982 CAS.
- L. Z. Gu, L. H. Jiang, J. T. Jin, J. Liu and G. Q. Sun, Carbon, 2015, 82, 572–578 CrossRef CAS.
- Y. Hu, J. O. Jensen, W. Zhang, L. N. Cleemann, W. Xing, N. J. Bjerrum and Q. F. Li, Angew. Chem., Int. Ed., 2014, 53, 3675–3679 CrossRef CAS PubMed.
- Z. L. Li, G. L. Li, L. H. Jiang, J. L. Li, G. Q. Sun, C. G. Xia and F. W. Li, Angew. Chem., Int. Ed., 2015, 54, 1494–1498 CrossRef CAS PubMed.
- D. K. Huang, Y. P. Luo, S. H. Li, M. K. Wang and Y. Shen, Electrochim. Acta, 2015, 174, 933–939 CrossRef CAS.
- V. M. Dhavale, S. K. Singh, A. Nadeema, S. S. Gaikwad and S. Kurungot, Nanoscale, 2015, 7, 20117–20125 RSC.
- Y. P. Zang, H. M. Zhang, X. Zhang, R. R. Liu, S. W. Liu, G. Z. Wang, Y. X. Zhang and H. J. Zhao, Nano Res., 2016, 9, 2123–2137 CrossRef CAS.
- C. H. Choi, S. H. Park and S. I. Woo, Int. J. Hydrogen Energy, 2012, 37, 4563–4570 CrossRef CAS.
- C. H. Choi, S. Y. Lee, S. H. Park and S. I. Woo, Appl. Catal., B, 2011, 103, 362–368 CrossRef CAS.
- X. Q. Liu and W. H. Hu, RSC Adv., 2016, 6, 29848–29854 RSC.
- K. Mohanraju and L. Cindrella, RSC Adv., 2015, 5, 39455–39463 RSC.
- H. Y. Zhu, S. Zhang, Y. X. Huang, L. H. Wu and S. H. Sun, Nano Lett., 2013, 13, 2947–2951 CrossRef CAS PubMed.
- T. Palaniselvam, H. B. Aiyappa and S. Kurungot, J. Mater. Chem., 2012, 22, 23799–23805 RSC.
- K. P. Qiu, G. L. Chai, C. R. Jiang, M. Ling, J. W. Tang and Z. X. Guo, ACS Catal., 2016, 6, 3558–3568 CrossRef CAS.
- K. Parvez, S. B. Yang, Y. Hernandez, A. Winter, A. Turchanin, X. L. Feng and K. Mullen, ACS Nano, 2012, 6, 9541–9550 CrossRef CAS PubMed.
- Z. H. Wen, S. Q. Ci, Y. Hou and J. H. Chen, Angew. Chem., Int. Ed., 2014, 53, 6496–6500 CrossRef CAS PubMed.
- S. Q. Ci, S. Mao, Y. Hou, S. M. Cui, H. Kim, R. Ren, Z. H. Wen and J. H. Chen, J. Mater. Chem. A, 2015, 3, 7986–7993 CAS.
- Q. P. Lin, X. H. Bu, A. G. Kong, C. Y. Mao, F. Bu and P. Y. Feng, Adv. Mater., 2015, 27, 3431–3436 CrossRef CAS PubMed.
- J. S. Lee, G. S. Park, S. T. Kim, M. L. Liu and J. Cho, Angew. Chem., Int. Ed., 2013, 52, 1026–1030 CrossRef CAS PubMed.
- W. H. Niu, L. G. Li, X. J. Liu, N. Wang, J. Liu, W. J. Zhou, Z. H. Tang and S. W. Chen, J. Am. Chem. Soc., 2015, 137, 5555–5562 CrossRef CAS PubMed.
- X. C. Wang, X. F. Chen, A. Thomas, X. Z. Fu and M. Antonietti, Adv. Mater., 2009, 21, 1609–1612 CrossRef CAS.
- B. Wang, X. L. Li, B. Luo, J. X. Yang, X. J. Wang, Q. Song, S. Y. Chen and L. J. Zhi, Small, 2013, 9, 2399–2404 CrossRef CAS PubMed.
- M. C. Biesinger, B. P. Payne, A. P. Grosvenor, L. W. M. Lau, A. R. Gerson and R. S. Smart, Appl. Surf. Sci., 2011, 257, 2717–2730 CrossRef CAS.
- A. G. Kong, X. F. Zhu, Z. Han, Y. Y. Yu, Y. B. Zhang, B. Dong and Y. K. Shan, ACS Catal., 2014, 4, 1793–1800 CrossRef CAS.
- Y. Zhao, K. Watanabe and K. Hashimoto, J. Am. Chem. Soc., 2012, 134, 19528–19531 CrossRef CAS PubMed.
- J. Yang, H. Y. Sun, H. Y. Liang, H. X. Ji, L. Song, C. Gao and H. X. Xu, Adv. Mater., 2016, 28, 4606–4613 CrossRef CAS PubMed.
- Y. Y. Liang, Y. G. Li, H. L. Wang, J. G. Zhou, J. Wang, T. Regier and H. J. Dai, Nat. Mater., 2011, 10, 780–786 CrossRef CAS PubMed.
Footnote |
| † Electronic supplementary information (ESI) available. See DOI: 10.1039/c6ra27826d |
| This journal is © The Royal Society of Chemistry 2017 |

