 Open Access Article
Creative Commons Attribution 3.0 Unported Licence
Sulfur-alloyed Cr2O3: a new p-type transparent conducting oxide host
Samira Dabaghmanesh *abc,
Rolando Saniza,
Erik Neyts
 b and
Bart Partoensa
aDepartment of Physics, University of Antwerp, Groenenborgerlaan 171, B-2020 Antwerpen, Belgium. E-mail: samira.dabaghmanesh@uantwerpen.be
bDepartment of Chemistry, University of Antwerp, Universiteitsplein 1, B-2610 Antwerp, Belgium
cSIM vzw, Technologiepark 935, BE-9052 Zwijnaarde, Belgium
First published on 16th January 2017
Abstract
Doped Cr2O3 has been shown to be a p-type transparent conducting oxide (TCO). Its conductivity, however, is low. As for most p-type TCOs, the main problem is the high effective hole mass due to flat valence bands. We use first-principles methods to investigate whether one can increase the valence band dispersion (i.e. reduce the hole mass) by anion alloying with sulfur, while keeping the band gap large enough for transparency. The alloying concentrations considered are given by Cr4SxO6−x, with x = 1–5. To be able to describe the electronic properties of these materials accurately, we first study Cr2O3, examining critically the accuracy of different density functionals and methods, including PBE, PBE+U, HSE06, as well as perturbative approaches within the GW approximation. Our results demonstrate that Cr4S2O4 has an optical band gap of 3.08 eV and an effective hole mass of 1.8 me. This suggests Cr4S2O4 as a new p-type TCO host candidate.
1 Introduction
There exist many theoretical and experimental studies on transparent conducting oxides (TCOs). The interest stems mainly from the fact that these materials offer both optical transparency and electrical conductivity for optoelectronics applications. According to the type of carriers that mainly contribute to the conductivity, the TCOs are divided into p-type, i.e. hole conducting, and n-type, i.e. electron conducting. To date, the n-type TCOs, with application in optoelectronic devices, solar cells, organic light emitting diodes (OLEDs), and sensors, see ref. 1 and references therein, have received more attention rather than p-type's. However, advanced applications of TCOs requiring p–n junctions, such as the active electronic devices, bipolar transistors and diodes, are still severely limited due to the lack of efficient p-type TCOs.1,2Generally, p-type TCOs suffer from low conductivity compared to their n-type counterparts. In contrast to the latter, developing a p-type TCO has always been challenging. The main reason for the low hole conductivity in most of these oxides is that the top of the valence band is dominated by oxygen p-states, which are highly localized and lead to flat bands and consequently a large effective hole mass.3
The CuAlO2 delafossite was reported by Kawazoe et al.4 as the first TCO with p-type conductivity and transparency in the visible range. This study opened a route to look for further p-type Cu-delafossites structures such as CuMO2 M ∈ {Ga, Sc, B, Cr}.5–8 The highest p-type conductivity, 220 S cm−1 (resistivity of 0.45 × 10⁻² Ω cm), in this family has been reported in the case of Mg-doped CuCrO2 (CuCrO2:Mg).8 In comparison with the best reported n-type TCO, Sn-doped In2O3, with a conductivity of the order of 104 S cm−1 (ref. 9), this amount of conductivity is very low. The spinel ZnRh2O4 (ref. 10) and distorted delafossite SrCu2O2 (ref. 11) are the other examples of p-type TCOs, with conductivities of 2.75 S cm−1 and 0.053 S cm−1 respectively.
Cr2O3 has been considered as a candidate p-type TCO host in several studies. Doping with Ni12–14 and with Li13,15 have been shown to induce p-type conductivity in Cr2O3. Cr2O3:N has received attention for applications in optoelectronic devices, in particular, as hole transporting layer in organic solar cells.16,17 Farrell et al.18 investigated the possibility of using dopants to create a p–n homojunction with Cr2O3. These authors studied the influence of Mg dopants and oxygen pressure in Cr2O3 as a p-type TCO.18 Arca et al.19,20 used a co-doping mechanism to obtain a Cr2O3-based p-type TCO. They investigated the conductivity and transparency of Cr2O3 by co-doping with Mg and N impurities. They found a resistivity of 3 Ω cm and an optical transmission up to 65% for a 150 nm thick Cr2O3 film. These properties are low compared to those reported for CuCrO2:Mg and n-type TCOs.
Chromia, Cr2O3, has the corundum structure, with a rather large experimental optical gap of 3.3–3.4 eV.21,22 However, the flat non-dispersed nature of the valence band of Cr2O3 causes a large hole effective mass, of the order of 12–13 me at the valence band maximum (VBM),23,24 resulting in the relatively poor conductivity of doped Cr2O3.
A general idea to improve the p-type conductivity in oxides was proposed by Hosono in 2007.3 He proposed to increase the VB dispersion by anion alloying, i.e., forming hybridized orbitals between O 2p states and chalcogen p orbitals (S, Se, and Te) which are more delocalized than O 2p orbitals. The hybridization is expected to lead to an increase in the VB dispersion, resulting in a smaller effective hole mass and, consequently, a higher mobility and conductivity. In this study we follow this idea to try to find new Cr2O3-based p-type TCO host candidates. We use first-principles techniques to investigate the effect of partially substituting oxygen atoms with sulfur. Since our main goal is to improve Cr2O3 as a p-type TCO host, we should keep in mind that increasing the VBM dispersion may close the gap and reduce the optical transparency of the host. In order to obtain both critical properties for a p-type TCO host, i.e. a large enough band gap (larger than 3 eV) and low hole mass, we consider different concentrations of sulfur. Applying state of the art ab initio techniques we study the compounds Cr4SxO6−x, with x = 1–5. The most advantageous properties are obtained for x = 2, Cr4S2O4, having a much lower hole effective mass (1.8 me) than Cr2O3 (12–13 me), and with a gap still larger than 3 eV (3.08 eV).
The paper is organized as follows: in Section 2 we present the methods and approaches we used in our work. In Section 3 we discuss the results and we end the paper with concluding remarks in Section 4.
2 Methods
Within a density functional theory (DFT) approach and using the plane-wave basis sets and the projector augmented-wave method25 we obtain the structural and electronic properties of Cr2O3 and Cr4SxO6−x (x = 1–5) compounds. All the calculations were performed using the VASP (Vienna Ab-initio Simulation Package) code.26–29 To the best of our knowledge, there exist no experimental data for any of the Cr4SxO6−x cases in the literature to compare with. In order to select the best computational scheme for the Cr4SxO6−x cases, we first examine various approaches for Cr2O3 and compare the results with experiment. The spin polarized generalized gradient approximation of Perdew–Burke–Ernzerhof (PBE) is used for the exchange correlation functional.30 In order to correct the strong correlation effects in the partially occupied Cr d states a +U correction is used in the form proposed by Dudarev et al.31 First, we performed geometry optimization, total energy, band structure and density of states calculations based on PBE and PBE+U. We used various U parameter values, as proposed in previous studies on Cr2O3,23,32,33 and compared them with the results obtained with the hybrid functional approach proposed by Heyd, Scuseria, and Ernzerhof (HSE)34 with the screening parameter μ = 0.2 Å−1 (HSE06).35 Next we compared all PBE, PBE+U, and HSE06 results with two levels of approximation within the perturbative GW approach,36 as implemented in the VASP code.37,38 In the first level, Kohn–Sham eigenvalues and eigenfunctions are used to compute the Green's function G and screened Coulomb interaction W in a single step (G0W0). In the second level, the eigenvalues in the Green's functions are updated self consistently (scGW0). In the case of PBE, PBE+U, and HSE06 we used a 8 × 8 × 8 k-point grid for total energy and structure optimization calculations, and a 21 × 21 × 21 grid for the density of states calculations. A cutoff energy of 500 eV was used for the plane-wave basis set. Both lattice parameters and atom coordinates are relaxed. For the electronic structure calculation we considered the results as converged when the energy difference between two successive steps was smaller than 10−6 eV and for the geometry optimization we considered a convergence criterium for the forces on the atoms of less than 0.01 eV Å−1. For the GW calculations, a 4 × 4 × 4 k-point grid was used. Convergence of the band gap was checked. The number of bands was increased to 1500 in GW calculations based on the convergence test. In the partially self-consistent GW (scGW0), four steps were found to be enough for the convergence of the band gap energy within 0.01 eV.3 Results and discussion
3.1 Cr2O3
Cr2O3 has a rhombohedral primitive cell with 2 formula units, cf. Fig. 1(a). Oxygen atoms form a hexagonal close-packed structure while Cr atoms occupy two-thirds of the interstitial octahedral sites.41 In its ground state, Cr2O3 adopts the R3c structure42,43 and is antiferromagnetic (AFM), with a Néel temperature of 308 K.44 The magnetic structure corresponds to a + − + − spin sequence on the Cr atoms along the c-axis.41,45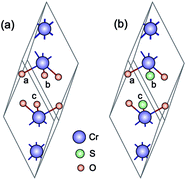 | ||
| Fig. 1 (a) Unitcell of Cr2O3 (rhombohedral) and (b) Cr4S2O4 (monoclinic). The purple, red, and green spheres represent chromium, oxygen, and sulfur, respectively. | ||
The calculated lattice constants, magnetic moments, and direct band gap, calculated with the different DFT methods mentioned above, are compared with experiment in Table 1. For the PBE+U calculations we employed U parameters as proposed in the ref. 23, 32 and 33. Ref. 32 proposed U = 3 eV and ref. 33 used U = 5 eV and J = 1 eV for the on-site Coulomb-repulsion and exchange integral for the Cr d electrons. In ref. 23, the authors proposed a +U correction of UCrd = 3 eV and UOp = 5 eV for the Cr 3d and O 2p states by comparing the electronic density of states (EDOS) of Cr2O3 with their experimental spectra obtained using ultra violet photoemission spectroscopy and X-ray photoemission spectroscopy. The PBE and PBE+U methods tend to overestimate the lattice parameters while underestimating the band gap compared to experiment. We compared the band structure and density of states obtained using three U parameter values with experiment. The experimental valence band-width, measured by XPS, is about 9 eV with a small (second) gap inside the VB.23,46–49 We found that UCrd = 3 eV and UOp = 5 eV, proposed in ref. 23, gives a larger band gap, wider band width (i.e. almost 6 eV), and narrower second gap inside the valence band compared to the other U parameters and in better agreement with experiment. Henceforth, we use these U parameters for all our results in the case of PBE+U calculations. Fig. 2 and 3 show the band structures, total EDOS and partial density of states PEDOS of Cr2O3 calculated with the PBE, PBE+U, and HSE06 approximations. Since HSE06 overestimates the band gap (by about 1 eV) using the standard Hartree–Fock mixing parameter (α = 0.25), we tuned the α parameter. We found that the optimized value α = 0.17 gives the experimental band gap (3.4 eV). The calculated VB width obtained by HSE06 (about 7.22 eV) is wider than the PBE and PBE+U methods, in better agreement with experiment. HSE06 also gives the second gap in good agreement with the DOS obtained by Robertson et al. using the screened exchange (sX) hybrid density functional.50 In order to find a reliable predictor for the band gap of the Cr4SxO6−x compounds, we also calculate the band gap of Cr2O3 using two flavors of the GW approximation, G0W0 and scGW0, as indicated above. We used as input for these the eigenvalues and eigenfunctions of both PBE and PBE+U. In Table 2 we summarize our results. Clearly, G0W0 largely overestimates the band gap whenever PBE+U results are used as the starting point, independently of the U values used. On the other hand, the band gap is underestimated when PBE results are used as a starting point. Updating G self-consistently (scGW0) on top of PBE as the staring point gives the direct band gap of 3.55 eV, which is close to HSE06 and experimental results. We also performed scGW0 on top of PBE+U, using the optimum U values mentioned before, and found a largely overestimated band gap of 4.489 eV. Fig. 4 shows the scGW0 quasiparticle energies (red dots) for several k-points on top of PBE band structure (blue lines). We see that scGW0 opens the gap by moving both the conduction and valence bands, up and down respectively. ScGW0 on top of PBE gives the wider band width (about 7.45 eV) compared to PBE, PBE+U, and HSE06 approaches, and closer to experiment. Also, the PBE second band gap tends to be closed by scGW0, again bringing it closer to experiment. Comparing these key properties, band gap, band width, and second gap, we conclude that scGW0 on top of PBE as well as HSE06 provide sound electronic structure and band gap values. Therefore, we use these approaches to obtain the band gap in the case of Cr4SxO6−x.
| Method | a | α | μ | Eg |
|---|---|---|---|---|
| PBE | 5.40 | 54.12 | 2.51 | 1.44 |
| PBE+U (UCrd = 3) | 5.42 | 55.08 | 2.78 | 2.60 |
| PBE+U (UCrd = 5) | 5.43 | 55.19 | 2.83 | 2.89 |
| PBE+U (UCrd = 3, UOp = 5) | 5.40 | 55.01 | 2.80 | 2.80 |
| HSE06 (α = 0.17) | 5.36 | 55.15 | 2.85 | 3.4 |
| Experiment | 5.35 (ref. 39) | 55.12 (ref. 39) | 3.8 (ref. 40) | 3.4 (ref. 21 and 22) |
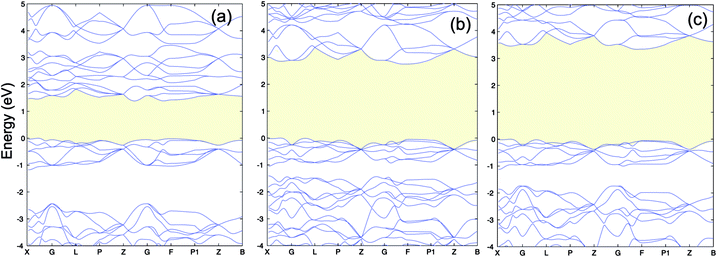 | ||
| Fig. 2 (a) PBE (b) PBE+U (UCrd = 3 eV, UOp = 5 eV) and (c) HSE06 band structure of Cr2O3. The VBM is set to 0. | ||
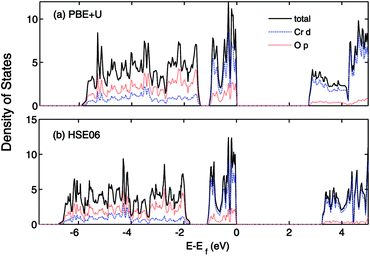 | ||
| Fig. 3 (a) PBE+U (UCrd = 3 eV, UOp = 5 eV) and (b) HSE06 calculated total (states per eV per unitcell) and partial (states per eV per atom) density of states of Cr2O3. The VBM is aligned to 0. | ||
| Method | G0W0 | scGW0 |
|---|---|---|
| PBE | 2.845 | 3.556 |
| PBE+U (UCrd = 3) | 4.20 | — |
| BE+U (UCrd = 5) | 4.58 | — |
| PBE+U (UCrd = 3, UOp = 5) | 4.238 | 4.489 |
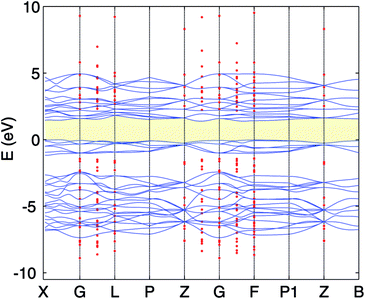 | ||
| Fig. 4 PBE band structure (full blue line) and scGW0 (red dots) for Cr2O3. The VBM of the PBE is set to 0. | ||
3.2 Anion alloying with sulfur
We find that substituting oxygen with sulfur atoms changes the crystal structure from corundum to monoclinic. As can be seen in Fig. 1 in the case of x = 2 the new structure is slightly distorted from the rhombohedral structure. The structural parameters are given in the two first columns of Table 3. First, we must find out for which concentration of sulfur we can expect to have at the same time a low hole mass and large enough gap for transparency. Given the several cases to consider (x = 1–5), we employ the PBE+U functional, which is more accurate than the PBE functional. Furthermore, it is known that PBE+U generally gives good values for the effective mass of semiconductors compared to experiment.51 Our results show that sulfur expands the volume of the corresponding unit cell, as can be expected. Fig. 5 shows the calculated spin polarized band structures of Cr4SxO6−x using the PBE+U approximation. For this we used UCrd = 3 eV and UOp = 5 eV as before. To determine the possible effect of using a U value for sulfur, we performed calculations using U = 0 and U = 5 eV for the sulfur atom. We found a small difference in DOS and band structures in the case of Cr2SO2. For instance, the difference in direct band gap is 0.06 eV (1.77 eV with U = 5 vs. 1.71 eV with U = 0). We expect the difference to be similarly small for the other sulfur concentrations. We therefore use U = 0 eV for the sulfur atom in all of our PBE+U calculations.| Compound | a, b, c | α, β, γ | μ | Eg |
|---|---|---|---|---|
| Cr4SO5 | 5.38, 5.55, 5.55 | 55.92, 54.55, 54.55 | ±2.93, ±2.99 | 1.92 |
| Cr4S2O4 | 6.08, 5.65, 5.65 | 57.31, 54.56, 54.56 | ±3, ±3 | 1.66 |
| Cr4S3O3 | 6.21, 5.75, 6.04 | 56.66, 54.11, 55.41 | 3, −2.98, −3.04, 3.06 | 1.08 |
| Cr4S4O2 | 6.37, 6.16, 6.16 | 55.72, 54.02, 54.02 | ±2.99, ±3.09 | 0.9 |
| Cr4S5O1 | 6.43, 6.25, 6.43 | 55.76, 54.44, 55.76 | ±3.04, ±3.08 | 0.74 |
 | ||
| Fig. 5 Band structures of Cr4SxO6−x (x = 0–5) calculated using PBE+U (UCrd = 3 eV, UOp = 5 eV). The blue and grey curves show the spin up and down. The VBM is aligned to 0. | ||
As can be seen in Fig. 5, increasing the concentration of sulfur atoms increases the dispersion of the VBM, i.e. lowers the hole mass, while closing the gap (the values of the fundamental band gaps are listed in Table 3). The blue (grey) curves in each panel show the band structure corresponding to spin up (down). In the case of Cr4S2O4 as well as Cr2O3, time-reversal symmetry is preserved, therefore the eigenvalues present Kramers degeneracy. But in the other concentrations, since that symmetry is broken, the band structure for up and down spin differ significantly. Inclusion of sulfur increases the magnetic moment of the Cr atoms. The calculated Cr magnetic moments are shown in Table 3 for the different concentrations. The magnetic moments for the other atoms are negligible. Cr4SxO6−x generally presents AFM order, except for x = 3 (Cr4S3O3), in which case the order is ferrimagnetic, with a total magnetic moment of −0.01 μB.
For a good p-type TCO, an optical band gap larger than 3 eV and a low hole effective mass are two critical key properties. Considering the PBE+U band gaps and VBM dispersions for the different concentrations of sulfur, we find that Cr4S2O4 presents the best chance for finding a good p-type TCO host among those compounds. Indeed, the PBE+U band gaps for x > 2 are too low to expect that a more accurate calculation will results in a gap above 3 eV.
In the next subsection we take a more careful look at the band gap and electronic properties of Cr4S2O4.
3.3 Cr4S2O4: a new p-type TCO host
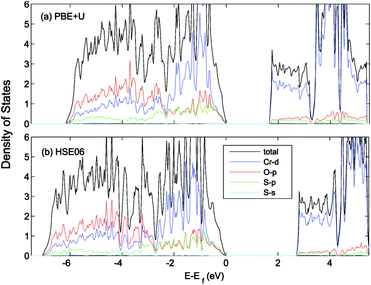
In this section we calculate the structural, electronic and magnetic properties of Cr4S2O4 using the more accurate HSE06 and scGW0 approaches. There are two different configurations when susbstituting two oxygen atoms with sulfur atoms: (i) replacing two S atoms on opposite planes by O (atoms a and c) and (ii) on the same plane (atoms a and b) (see Fig. 1(b)). We found that the first configuration is considerably more stable energetically, with an energy difference of 0.83 eV. Table 4 presents the optimized lattice parameters, magnetic moments and direct band gaps of Cr4S2O4 obtained using the HSE06 and scGW0 approaches. PBE and PBE+U results are included for completeness (for the scGW0 calculations we use the PBE lattice parameters). The results show that the HSE06 band gap is close to the scGW0 gap (the difference being 0.19 eV). This indicates that the HSE06 (α = 0.25) electronic structure is reliable. In Fig. 6, we show the band structure of Cr4S2O4 calculated using (a) PBE+U and (b) HSE06. This shows that the valence band dispersions from the two methods are very similar. We therefore calculate the hole mass of Cr4S2O4 using the PBE+U method. We find that the average hole effective mass at the VBM is 1.8 me in the directions of G–X and M–G.| Method | a, b | α, β | μ | Eg |
|---|---|---|---|---|
| PBE | 5.96, 5.62 | 56.77, 53.68 | ±2.55 | 1.09 |
| PBE+U (UCrd = 3 eV, UOp = 5 eV) | 6.08, 5.65 | 57.31, 54.56 | ±3 | 1.77 |
| HSE06 (α = 0.25) | 6.00, 5.58 | 57.28, 54.55 | ±2.95 | 2.89 |
| scGW0 | 5.96, 5.62 | 56.77, 53.68 | ±2.66 | 3.08 |
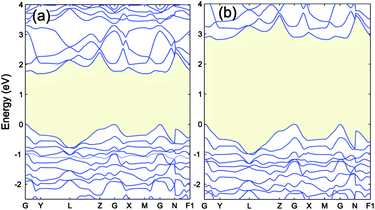 | ||
| Fig. 6 The band structure of Cr4S2O4 calculated by (a) PBE+U (UCrd = 3 eV, UOp = 5 eV) and (b) HSE06. The VBM is aligned to 0. | ||
The effect of sulfur on the electronic structure can be better understood as follows. The total EDOS and the Cr 3d, O 2p and S 3p partial PEDOS calculated with (a) PBE+U and (b) HSE06 are shown in Fig. 7. We can divide the valence region into the two energy regions. The first region, with −7 eV < E < −2.8 eV, consists mainly of O 2p and Cr 3d electrons, with a smaller contribution from S 3p (PBE+U and HSE06 show almost the same contribution). The second region, close to the valence band maximum, with −2.8 eV < E < 0, shows the Cr 3d electrons play the leading role, with a smaller mixing of O 2p and S 3p electrons. The conduction band minimum (CBM) is mainly composed of Cr 3d electrons with very small contributions from O 2p and S 3p electrons. The partial density of states shows a significant mixing of O 2p and S 3p toward the VBM. This leads to delocalization of the hole states and increasing the dispersion of the VBM compared to Cr2O3 (see Fig. 8). The higher VBM dispersion leads to significantly smaller hole mass, 1.8 me compared to 13 me in Cr2O3 (i.e., more than 7 times smaller). An equally large increase in mobility can be expected. Furthermore, in Fig. 8 we align the Cr2O3 and Cr4S2O4 PEDOS according to the position of the O 2s level. This shows that replacing oxygen with sulfur shifts the VBM upwards and is the main reason for the band gap decrease with sulfur alloying. On the other hand, a higher VBM (smaller ionization potential) should make p-type dopability easier.3
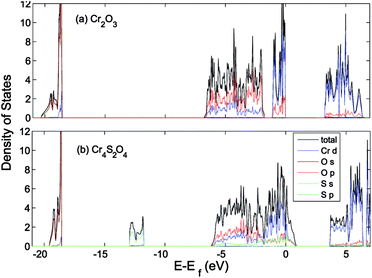 | ||
| Fig. 8 Total (states per eV per unitcell) and partial (states per eV per atom) density of states of (a) Cr2O3 and (b) Cr4S2O4 calculated using HSE06. The VB is aligned to the O 1s orbital. | ||
We now address the stability of Cr4S2O4. We obtained the mixing enthalpy ΔH from the calculated total energy of each compound52
| ΔH = 3Etot(Cr4S2O4) − 4Etot(Cr2O3) − 2Etot(Cr2S3) | (1) |
We found a mixing enthalpy of 144 meV per atom. The positive ΔH indicates that the ground state of Cr4S2O4 at zero temperature corresponds to phase separation to Cr2O3 and Cr2S3. However, at finite temperatures, the mixing entropy will tend to stabilize Cr4S2O4. Note, however, that the lattice mismatch between Cr2O3 and Cr2S3 is large nearly 23%. This is one of the main reasons why the mixing enthalpy above is high. But this large lattice mismatch can be exploited to stabilize Cr4S2O4. Indeed, if grown on suitable substrate (e.g. by epitaxy), phase separation can be avoided because of this would require overcoming high kinetic energy barriers.53 Al2O3 and stainless steel are popular substrates used to grow Cr2O3.18,54,55 These materials can also be appropriate substrates for Cr4S2O4. For instance, Al2O3 in its trigonal phase56 has only 4% lattice mismatch with Cr4S2O4 and is thus a reasonable candidate. Stainless steel is composed of different oxides, i.e. Cr, Fe, Ni, Co, and depending on growth conditions the surface can be covered by one of the oxides. In the case of, for example, Fe2O3 which has the same structure as Cr2O3 (corundum) and similar lattice constant (2% different) with Cr4S2O4, stainless steel could be a good candidate as well. Note, however, that deciding on a substrate requires the latter to have not only appropriate lattice constant but also suitable electronic and thermodynamic properties. This requires further works going beyond the scope of this paper.
4 Concluding remarks
We investigated the possibility of improving the properties of Cr2O3 as a p-type TCO host by anion alloying with sulfur. We employed different DFT approaches, namely PBE, PBE+U, HSE06, as well as GW approximation methods, in order to obtain the structural, electronic and magnetic properties of both pristine Cr2O3 and sulfur-alloyed Cr4SxO6−x (x = 1–5). We demonstrated that substituting oxygen atoms with sulfur can overcome the issue of the flat VBM in Cr2O3 and induce a highly-curved VBM, while preserving the transparency. Indeed, we found that Cr4S2O4 is the best candidate among the sulfur concentrations considered, with an optical band gap of 3.08 eV and average effective hole mass of 1.8 me. Although the stability of this material has not yet being confirmed experimentally, we think our study presents an incentive for future theoretical and experimental works.Acknowledgements
This work was supported by SIM vzw, Technologiepark 935, BE-9052 Zwijnaarde, Belgium, within the InterPoCo project of the H-INT-S horizontal program. The computational resources and services used in this work were provided by the Vlaams Supercomputer Centrum (VSC) and the HPC infrastructure of the University of Antwerp.References
- S. Nandy, A. N. Banerjee, E. Fortunato and R. Martins, Reviews in Advanced Sciences and Engineering, 2013, 2, 132 CrossRef.
- E. Fortunato, P. Barquinha and R. Martins, Adv. Mater., 2012, 24, 2945 CrossRef CAS PubMed.
- H. Hosono, Thin Solid Films, 2007, 515, 6000–6014 CrossRef CAS.
- H. Kawazoe, M. Yasukawa, H. Hyodo, M. Kurita, H. Yanagi and H. Hosono, Nature, 1997, 398, 939 CrossRef.
- K. Ueda, T. Hase, H. Yanagi, H. Kawazoe, H. Hosono, H. Ohta, M. Orita and M. Hirano, J. Appl. Phys., 2001, 89, 1790 CrossRef CAS.
- N. Duan, A. W. Sleight, M. K. Jayaraj and J. Tate, Appl. Phys. Lett., 2000, 77, 1325 CrossRef CAS.
- M. Snure and A. Tiwari, Appl. Phys. Lett., 2007, 91, 092123 CrossRef.
- R. Nagarajan, A. D. Draeseke, A. W. Sleight and J. Tate, J. Appl. Phys., 2001, 89, 8022 CrossRef CAS.
- P. P. Edwards, A. Porch, M. O. Jones, D. V. Morgan and R. M. Perks, Dalton Trans., 2004, 19, 2995 RSC.
- M. Dekkers, G. Rijnders and D. H. A. Blank, Appl. Phys. Lett., 2007, 90, 021903 CrossRef.
- E. Bobeico, E. Varsano, C. Minarini and F. Roca, Thin Solid Films, 2003, 70, 444 Search PubMed.
- N. Uekawa and K. Kaneko, J. Phys. Chem., 1996, 100, 4193 CrossRef CAS.
- G. M. Crosbie, G. J. Tennenhouse, R. P. Tischer and H. S. Wroblowa, J. Am. Ceram. Soc., 1984, 67, 498 CrossRef CAS.
- K. Hauffe and J. Block, Z. Phys. Chem., 1951, 198, 232 CAS.
- W. C. Hagel, J. Appl. Phys., 1965, 36, 2586 CrossRef CAS.
- P. Qin, G. Fang, Q. He, N. Sun, X. Fan, Q. Zheng, F. Chen, J. Wan and X. Zhao, Sol. Energy Mater. Sol. Cells, 2011, 95, 1005 CrossRef CAS.
- P. Qin, G. Fang, N. Sun, X. Fan, Q. Zheng, F. Chen, J. Wan and X. Zhao, Thin Solid Films, 2011, 519, 4334 CrossRef CAS.
- L. Farrell, K. Fleischer, D. Caffrey, D. Mullarkey, E. Norton and I. V. Shvets, Phys. Rev. B: Condens. Matter Mater. Phys., 2015, 91, 125202 CrossRef.
- E. Arca, K. Fleischer and I. V. Shvets, Appl. Phys. Lett., 2011, 99, 111910 CrossRef.
- E. Arca, K. Fleischer, S. A. Krasnikov and I. Shvets, J. Phys. Chem. C, 2013, 117, 219017 Search PubMed.
- A. Y. Dobin, W. H. Duan and R. M. Wentzcovitch, Phys. Rev. B: Condens. Matter Mater. Phys., 2000, 62, 11997 CrossRef CAS.
- R. H. Misho and W. A. Fattahallah, Thin Solid Films, 1989, 169, 235–239 CrossRef CAS.
- A. B. Kehoe, A. Elisabetta, D. O. Scanlon, I. V. Shvets and G. W. Watson, J. Phys.: Condens. Matter, 2016, 28, 125501 CrossRef PubMed.
- S. Lany, J. Phys.: Condens. Matter, 2015, 27, 283203 CrossRef PubMed.
- P. E. Blöchl, Phys. Rev. B: Condens. Matter Mater. Phys., 1994, 50, 17953 CrossRef.
- G. Kresse and J. Hafner, Phys. Rev. B: Condens. Matter Mater. Phys., 1993, 47, 558 CrossRef CAS.
- G. Kresse and J. Hafner, J. Phys.: Condens. Matter, 1994, 6, 8245 CrossRef CAS.
- G. Kresse and J. Furthmller, Phys. Rev. B: Condens. Matter Mater. Phys., 1996, 54, 11169 CrossRef CAS.
- G. Kresse and J. Furthmller, Comput. Mater. Sci., 1996, 6, 1550 CrossRef.
- J. Perdew, K. Burke and M. Ernzerhof, Phys. Rev. Lett., 1996, 77, 3865 CrossRef CAS PubMed.
- S. L. Dudarev, G. A. Botton, S. Y. Savrasov, C. J. Humphreys and A. P. Sutton, Phys. Rev. B: Condens. Matter Mater. Phys., 1998, 57, 1505 CrossRef CAS.
- V. Stevanovic, S. Lany, X. Zhang and A. Zuner, Phys. Rev. B: Condens. Matter Mater. Phys., 2012, 85, 115104 CrossRef.
- A. Rohrbach, J. Hafner and G. Kresse, Phys. Rev. B: Condens. Matter Mater. Phys., 2004, 70, 125426 CrossRef.
- J. Heyd, G. E. Scuseria and M. Ernzerhof, J. Chem. Phys., 2003, 118, 8207 CrossRef CAS.
- A. V. Krukau, O. A. Vydrov, A. F. Izmaylov and G. E. Scuseria, J. Chem. Phys., 2006, 125, 224106 CrossRef PubMed.
- L. Hedin, Phys. Rev. A, 1965, 139, 796 CrossRef CAS.
- M. Shishkin and G. Kresse, Phys. Rev. B: Condens. Matter Mater. Phys., 2006, 74, 035101 CrossRef.
- M. Shishkin and G. Kresse, Phys. Rev. B: Condens. Matter Mater. Phys., 2007, 75, 235102 CrossRef.
- H. Schober, T. May, B. Dorner, D. Strauch, U. Steigenberger and Y. Morrii, Z. Phys. B: Condens. Matter, 1995, 98, 197 CrossRef CAS.
- L. Finger and R. Hazen, J. Appl. Phys., 1980, 51, 5362 CrossRef CAS.
- M. Catti, G. Sandrone, G. Valerio and R. Dovesi, J. Phys. Chem. Solids, 1996, 57, 1735 CrossRef CAS.
- B. N. Brockhouse, J. Chem. Phys., 1953, 21, 961 CrossRef CAS.
- C. G. Shull, W. A. Strauser and E. O. Wollan, Phys. Rev., 1951, 83, 333 CrossRef CAS; T. G. Worton, R. M. Brugger and R. B. Bewman, J. Phys. Chem. Solids, 1968, 29, 435 CrossRef.
- L. M. Corliss, et al., J. Appl. Phys., 1965, 36, 1099 CrossRef CAS.
- E. A. Moore, Phys. Rev. B: Condens. Matter Mater. Phys., 2007, 76, 195107 CrossRef.
- R. Zimmermann, P. Steiner and S. Hafner, J. Electron Spectrosc. Relat. Phenom., 1996, 78, 49 CrossRef CAS.
- T. C. Kaspar, S. E. Chamberlin, M. E. Bowden, R. Colby, V. Shutthanandan, S. Manandhar, Y. Wang, P. V. Sushko and S. A. Chambers, J. Phys.: Condens. Matter, 2014, 26, 135005 CrossRef CAS PubMed.
- F. Werfel and O. Brmmer, Phys. Scr., 1983, 28, 926 CrossRef.
- T. Uozumi, K. Okada, A. Kotani, R. Zimmermann, P. Steiner, S. Hfner, Y. Tezuka and S. Shin, J. Electron Spectrosc. Relat. Phenom., 1997, 83, 920 CrossRef.
- Y. Guo, S. J. Clark and J. Robertson, J. Phys.: Condens. Matter, 2012, 24, 325504 CrossRef PubMed.
- O. Neufeld and M. Caspary Toroker, J. Chem. Phys., 2016, 144, 164704 CrossRef PubMed.
- S. H. Wei and A. Zunger, J. Appl. Phys., 1995, 78, 6 Search PubMed.
- The lattice mismatch between Cr4S2O4 and Cr2O3, and Cr2S3 is as follows: (āCr4S2O4 − aCr2O3)/aCr2O3 = 7% and (āCr4S2O4 − aCr2S3)/aCr2S3 = 13%, where āCr4S2O4 is the average of lattice parameters of Cr4S2O4, i.e. a = 6 Å, b = 5.58 Å, and c = 5.58 Å. The lattice parameters of Cr2O3 and Cr2S3 are a = 5.366 Å and a = 6.61 Å respectively. Note that the above are HSE06 values.
- S. A. Chambers, Y. Liang and Y. Gao, Phys. Rev. B: Condens. Matter Mater. Phys., 2000, 61, 13223–13229 CrossRef CAS.
- R. C. KU and W. L. Winterbottom, Thin Solid Films, 1985, 127, 241–256 CrossRef CAS.
- A. Jain, S. P. Ong, G. Hautier, W. Chen, W. D. Richards, S. Dacek, S. Cholia, D. Gunter, D. Skinner, G. Ceder and K. A. Persson, APL Mater., 2013, 1(1), 011002 CrossRef.
| This journal is © The Royal Society of Chemistry 2017 |

