 Open Access Article
Creative Commons Attribution 3.0 Unported Licence
A magnetically recoverable photocatalyst prepared by supporting TiO2 nanoparticles on a superparamagnetic iron oxide nanocluster core@fibrous silica shell nanocomposite†
Bokyung Seoa,
Chaedong Leea,
Donggeon Yooa,
Peter Kofinas*c and
Yuanzhe Piao *ab
*ab
aProgram in Nano Science and Technology, Department of Transdisciplinary Studies, Graduate School of Convergence Science and Technology, Seoul National University, Seoul 151-742, Republic of Korea. E-mail: parkat9@snu.ac.kr
bAdvanced Institutes of Convergence Technology, Seoul National University, Suwon 443-270, Republic of Korea
cFischell Department of Bioengineering, University of Maryland, College Park, MD 20742, USA. E-mail: kofinas@umd.edu
First published on 1st February 2017
Abstract
A magnetically recoverable photocatalyst was prepared by supporting TiO2 nanoparticles on a superparamagnetic iron oxide nanocluster (SION) core@fibrous silica shell (FSS) nanocomposite. Using the raspberry-shaped magnetic iron oxide nanocluster core as a seed, FSS with uniform thickness was grown directly on the core surface by a sol–gel process. The preparation method was optimized to have a single core for each nanoparticle by adjusting the amount of the silica source. The FSS has a fanning structure of radial pores, which enable large amounts of TiO2 nanoparticles to be supported easily on the pore surface. SION@FSS with amorphous TiO2 loaded on the pores (SION@FSS@Am-TiO2) was crystallized to the anatase phase (SION@FSS@A-TiO2), which shows good photocatalytic effect. When used for water purification, SION@FSS@A-TiO2 shows faster dye degradation kinetics than that of commercial P25 nanoparticles. The as-prepared SION@FSS@A-TiO2 photocatalyst could be magnetically recovered easily from water after decolorization of the dye.
Introduction
As per World Bank estimates, up to 30 percent of water pollution among G20 countries is contributed by wastewater from the textile industry.1,2 Textile effluents may cause bladder cancer to workers in dyeing and printing sections3 and it can even harm ocean animals.4 Therefore, a number of studies have focused on purifying textile effluents. There are many techniques for the decolorization of dye from wastewater, and these include physical, electrochemical/chemical, biological and photocatalytic methods. Usually, a combination of processes is necessary because using a single method alone has its constraints. One of the combined techniques is the use of UV-illuminated titania (UV/TiO2) as a photocatalyst after aerobic biological oxidation.5 In a bio-photoreactor system, UV/TiO2 can degrade nonbiodegradable molecules after a biological process.6 Anatase phase TiO2 is widely used owing to its high photocatalytic activity than that of rutile7 and its low cost.However, the growing use of TiO2 as a catalyst has given rise to increasing concerns regarding the inflammatory response8,9 and adverse effects10 of anatase TiO2. Therefore, TiO2 nanoparticles that remain in water after the purification step can pose problems, especially those in the ultrafine size regime (25 nm).11 From this point of view, there has been a continued effort to recollect TiO2 nanoparticles by immobilizing them on solid supports.12,13 When using mesoporous silica nanoparticles (MSNs)14,15 as a solid support,16,17 TiO2 clusters can be confined into the nanopores, preventing aggregation and enhancing the catalytic effect.18 As a host material, the direction, shape,19 and size20 of the MSN pore determines the size and amount of confined TiO2. Fibrous silica materials,21 also called as dendritic silica nanomaterials22 or hierarchical mesoporous silica nanoparticles,23,24 have a fanning structure of radial pores that are aligned perpendicularly.25 Easily accessible pores enabled its enhanced adsorption and release ability than that of counterparts.22 As a support for TiO2 photocatalyst, it increase the loading of TiO2 and enhance the catalytic effect than that of conventional MSNs.19 The fibrous structure also make them suitable for kinds of applications including catalyst,26 column in liquid chromatography27 and excellent superhydrophilic material.28
During the synthesis of fibrous silica nanomaterials, an oil–water dual solvent is used with a catalyst, surfactant, and tetraethyl orthosilicate (TEOS) as a silica precursor. Polshettiwar et al.21 prepared silica spheres with radially oriented channels using a microwave-assisted hydrothermal technique. In that study, the sphere has an overall size of 250–450 nm and dendritic fibers of 8–10 nm thickness. The authors observed a highly fibrous structure on increasing the urea to TEOS ratio. Mesoporous to wrinkled fibrous nanoparticles were obtained23 by increasing the oil to water ratio. By changing the oil–water-surfactant ratio, the authors found that a fibrous morphology could be obtained in a bicontinuous micro emulsion phase. Small-sized fibrous silica spheres (130 nm) were synthesized29 using cetyltrimethyl-ammonium tosylate as a surfactant. When cetyltrimethylammonium bromide (CTAB) was used as a surfactant, the surface areas and pore size were increased as the concentration of small organic amines increased. Raspberry and worm-like structures were obtained when using CTAB with triethyleneamine (TEA) or triethanolamine (TEAH) respectively. The larger surface area and pore volume obtained for the raspberry or worm-like structures were owing to the thinner and connected walls in these structures. In another work, the dependence of the connectivity of fibrous silica spheres on the phase behavior of the oil–water-surfactant system has been studied.30 The results show that the oil–water-surfactant ratio is an important factor determining the pore size and pore volume of fibrous silica nanoparticles synthesized in a bicontinuous (Windsor II) system. By changing the oil-solvent composition, multigenerational fibrous silica spheres were synthesized that enabled pore size tuning from 2.8 to 13 nm.31 For each generation, the thickness of the layer was controlled from 5 to 180 nm depending on the reaction time and the amount of the silica source. Therefore, these spheres showed a high bovine β-lactoglobulin loading capacity.
However, the key issue remains the separation of TiO2 nanoparticle with MSN support from purified water. Since nanoparticle separation requires filtering or centrifugation, separating catalyst nanoparticles from a large quantity of solution is not very suitable. As an alternative, magnetic nanoparticles were embedded in the catalysts for magnetic recollection.32–39 When the size of magnetic nanoparticles is in the 10–20 nm range and remains constant above the blocking temperature, the nanoparticles have a single magnetic domain and show superparamagnetism.40 Superparamagnetic nanoparticles have large magnetic moment without coercivity and have remnant magnetism close to zero.40 Hence, such superparamagnetic nanoparticles can be used in biomedical and environmental applications. When a magnetic field is applied, superparamagnetic nanoparticles face a high magnetic moment, which is advantageous for magnetic separation/recollection. In contrast, when the magnetic field is removed, magnetic nanoparticles lose their magnetism and hence their aggregation reduces.40 Superparamagnetic iron oxide nanoclusters (SIONs) which consists of small magnetic grains recently attracted much research interest.41,42 Contrary to the ferromagnetic behavior of iron oxide with the same size, magnetic interaction among grains within the nanocluster results in a superparamagnetic behavior of the nanocluster.41 These nanoclusters combine the advantages of individual grains and result in an enhanced magnetic property.42
Nanoparticle separation performed with SIONs core coated with easily accessible FSS is suitable for catalyst recollection where significant mass transport is essential. About coating FSS on dense amorphous silica pre-coated magnetic nanoparticles, there are several reports.43–45 Direct synthesis of FSS on an iron oxide nanocore is also investigated.46
When a silica shell was coated on magnetic nanoparticle,47–50 magnetic properties can be engineered. Saturation magnetization could enhance after annealing SION coated with the silica shell because of reduced particle–particle interactions.47 In that work, a decrease in the blocking temperature of the annealed sample was observed. Similarly, increased magnetization and increased surface spins was reported after sol–gel combustion synthesis of hematite nanoparticles embedded in silica nanostructures.49 When controlling the thickness of silica shell on a SION cluster, saturation magnetization decreased with the increasing shell area compared to the SION core area.48 Those articles show that it is possible to change the magnetic property of magnetic core@silica shell nanoparticles. By magnetic property engineering, the SION core coated with a silica shell can be designed to fit suitable applications such as biomedical applications, bio-separation, and nanoparticle recollection. In this regard, photocatalyst-supported magnetic core@silica shell nanoparticles can be designed to fit the bio-photoreactor system.6 Using an additional magnetic separation device, both bio-degradable and non-biodegradable molecules in wastewater can be purified, without producing any photocatalyst nanoparticle/nanocomposite sludge.
In this work, we applied a biphase stratification approach31 to grow a FSS on the SION core up to the third generation. The results show that a FSS layer with easily accessible high surface areas was successfully generated on the SION. TiO2 nanoparticles were further loaded on the radial pore surface to generate a magnetically recoverable photocatalyst (SION@FSS@A-TiO2). The SION@FSS@A-TiO2 photocatalyst shows higher dye degradation kinetics than that of commercial P25 nanoparticles when used for water purification.
Experimental
Materials
Ethylene glycol (99.9%), ethyl alcohol (ETOH) (95.0%), acetone (99.5%), cyclohexane (99.0%) and hydrochloric acid (35–37%) were obtained from Samchun. Iron (III) chloride hexahydrate (97.0%), sodium citrate tribasic dehydrate (≥99.0%), triethanolamine (TEA, 98%), sodium acetate (99%), 1-octadecene (90%), hydroxyl propyl cellulose (HPC), titanium butoxide (TBOT, 97%), titanium(IV) oxide (Aeroxide® P25), and methylene blue solution (MetB, 1.5 g/100 mL) were purchased from Sigma Aldrich. CTAB and TEOS (98%) were obtained from across. Decahydronaphthalene (97%) was obtained from Junsei. All reagents were used without further purification unless specified.Preparation of SION
The iron oxide nanocluster cores were synthesized by following a previously reported procedure.52 Briefly, 1.95 g of iron (III) chloride hexahydrate, 0.6 g of sodium citrate tribasic dehydrate, and 60 mL of ethylene glycol were mixed with magnetic stirrer. When 3.6 g of sodium acetate was added to the solution, the color of the mixture was changed from yellowish red to yellowish brown. After stirring for 30 min, the resulting mixture was poured into a 100 mL stainless steel autoclave equipped with a Teflon liner. Next, the Teflon lined autoclave was heated in a 200 °C oven. After 10 h of the hydrothermal reaction, the black precipitate was dispersed in distilled water. After washing for 3 times with water and acetone, the resulting SION was dispersed in distilled water with the concentration of 9.3 mg mL−1.Preparation of SION@FSS
The FSS was generated on the SION by following a previously reported procedure.31 Typically, 200 mL of the SION colloid, 416 mL of distilled water, 92.9 g of CTAB and 2.5 g of TEA were mixed in a 2 L multi-neck reaction flask. The mixture was heated to 60 °C for 30 min and maintained at that temperature with overhead stirrer (OS40-Pro, Proneer, Korea) accompanied with PTFE impeller of 8 mm shaft length. After an hour, 685 μL of TEOS in 274 mL of 1-octadecene was added to the solution. After stirring for 12 h, the oil phase layer was discarded and replaced with 685 μL of TEOS in 274 mL of decahydronaphthalene. The mixture was reacted for another 12 h at 60 °C to generate a fibrous silica coating layer again. Then, the oil phase layer was removed again and 685 μL of TEOS in 274 mL of cyclohexane was added to the mixture solution to further grow the silica layer. The final reaction was carried out at 60 °C for another 12 h. At the end of the reaction, an excess amount of ethanol was added to the mixture solution. After centrifugation (10![[thin space (1/6-em)]](https://www.rsc.org/images/entities/char_2009.gif) 000 RPM, 30 min), the pellet was redispersed in ethanol, washed with ethanol and distilled water two times, and then dried in a 60 °C oven. To remove residual CTAB, the resulting brown powder was collected and calcinated in a tube furnace at 550 °C for 5 h. The final product was named as SION@FSS.
000 RPM, 30 min), the pellet was redispersed in ethanol, washed with ethanol and distilled water two times, and then dried in a 60 °C oven. To remove residual CTAB, the resulting brown powder was collected and calcinated in a tube furnace at 550 °C for 5 h. The final product was named as SION@FSS.
Preparation of SION@FSS@Am-TiO2 and SION@FSS@A-TiO2
In a 500 mL round bottom flask, 110 mg of SION@FSS, 0.6 mg of HPC, and 100 μL of distilled water were dispersed in 200 mL of ethanol. The mixture was mixed vigorously using an overhead stirrer for the entire duration of the reaction. The solution was heated to 85 °C and maintained at that temperature for 1 h. After mixing 800 μL of TBOT with 10 mL ethanol, the solution were added dropwise using a syringe pump at a flow rate of 0.5 mL min−1. The mixture was followed by refluxing at 85 °C for 100 min. After the reaction, the resulting nanoparticles were washed first with methanol and then with ethanol twice. The products were sonicated for 10 min to enhance the surface area of the TiO2 nanoparticles51 followed by centrifugation (10![[thin space (1/6-em)]](https://www.rsc.org/images/entities/char_2009.gif) 000 RPM, 30 min). The pellet (SION@FSS@Am-TiO2) was collected and redispersed in ethanol. After a hydrothermal reaction at 180 °C for 1.5 h, the final nanoparticle composites were denoted as SION@FSS@A-TiO2. Synthesis conditions from SION to SION@FSS@A-TiO2 synthesis is summarized in the (Table S1, ESI†).
000 RPM, 30 min). The pellet (SION@FSS@Am-TiO2) was collected and redispersed in ethanol. After a hydrothermal reaction at 180 °C for 1.5 h, the final nanoparticle composites were denoted as SION@FSS@A-TiO2. Synthesis conditions from SION to SION@FSS@A-TiO2 synthesis is summarized in the (Table S1, ESI†).
FSS thickness control of SION@FSS
For the control of FSS thickness on SION core, the amount of TEOS is controlled while reducing the batch volume. Only the amounts of nanoparticles and batch size (250 mL round-bottom-flask) and reagents are changed in the above procedure, preparation of SION@FSS. In detail, 14.6 mL of SION colloid (9.3 g mL−1) dispersed in DI water, 30 mL of additional DI water, 6.78 g of CTAB, 0.18 of TEA and 20 mL of oil solvents (1-octadecene and cyclohexane) are used. FSS control is tested separately initially on a small scale in 500 mL RBF, which is a different procedure from that carried out in the 2 L multi-neck reaction flask. The summary of synthesis parameters for FSS control is written in the (Table S2, ESI†).Material characterization
The morphology and size of the particles were observed with both a transmission electron microscope (TEM) and field emission scanning electron microscope (FE-SEM). TEM images were taken using JEM-2100F (JEOL). Selected area electron diffraction (SAED) measurements were performed using the same TEM device. A Hitachi/Brucker S-4800/Quantax200 was used to obtain FE-SEM images. Every sample was coated with platinum using a Pt coater (Leica) prior to FE-SEM image acquisition. To make the sample more conductive, the sample was pretreated with 15 mA current for 100 seconds before Pt coating. Energy-dispersive X-ray spectroscopy (EDX) was used for chemical characterization, and elemental analysis was carried out using a Quantax200 (Hitachi). A zeta-potential and particle size analyzer (Otsuka Electronics, Japan) was used to measure the hydrodynamic size of the nanoparticles using dynamic light scattering (DLS). The Brunauer–Emmett–Teller (BET) specific surface area, adsorption isotherm, and pore size distribution at 77.35 K were measured with a BELSORP-max and ASAP 2420. X-ray diffraction (XRD) patterns were obtained using a New D8 Advance diffractometer. During the scan, the incident angle was varied from 20° to 80° at a scanning rate of 2° per min. The magnetic property of the nanoparticle was characterized using a PPMS 14 T (Quantum Design, San Diego), from which we obtained a DC magnetization (M) versus magnetic field graph from 0 T to 14 T.Photodecolorization test
The dye degradation test was performed using UV transilluminators as a UV light source. WUV-M20 (WiseUV) is geared with 6 pieces of 8 W UV lamps radiating 312 nm light over an area of 350 mm × 275 mm with 100% intensity (50 mW cm−2). MetB containing 0.1 mg mL−1 of catalyst nanoparticles in 100 mL ethanol solution was firstly prepared in 100 mL vial. Next, the mixture is stirred in the dark on a multi-axle roller-mixer (RM 5-40, LAT and Raczek analysis GmbH, Germany). After 2 h, the mixture is transferred to 500 mL 2-neck round bottom flask. Together with UV irradiation, mechanical stirring (200 RPM) and refluxing (Fig. S9, ESI†), 1 mL aliquots were withdrawn at designated intervals and centrifuged (10![[thin space (1/6-em)]](https://www.rsc.org/images/entities/char_2009.gif) 000 RPM, 30 min). The absorbance of the supernatants was measured using a UV-VIS spectrophotometer (UV-1700, Shimadzu). The absorbance vs. concentration (mg L−1) curve were obtained and linear fitted (Fig. S8, ESI†) to obtain the equation for compute unknown concentration from absorbance of a sample. Comparison of reaction rate with Aeroxide® P25 was performed by applying pseudo-first-order kinetics. The rate constant was calculated from the slope of
000 RPM, 30 min). The absorbance of the supernatants was measured using a UV-VIS spectrophotometer (UV-1700, Shimadzu). The absorbance vs. concentration (mg L−1) curve were obtained and linear fitted (Fig. S8, ESI†) to obtain the equation for compute unknown concentration from absorbance of a sample. Comparison of reaction rate with Aeroxide® P25 was performed by applying pseudo-first-order kinetics. The rate constant was calculated from the slope of  versus the photocatalytic reaction time. C0 and C indicate the initial concentration and concentration at time t, respectively.
Recollection and reusability test
To test recyclability, the MetB solution containing catalyst nanoparticles was placed under a UV lamp for 30 min. Nanoparticles were separated using a small handheld magnet. Finally, the supernatant was taken and the absorbance spectrum was measured. The nanoparticle pellets were redispersed in the MetB solution to repeat UV illumination. The above procedures were repeated to examine the reusability.Results and discussion
The procedure for the synthesis of SION@FSS@A-TiO2 (Scheme 1) involves three steps. First, the SIONs are homogeneously coated with dendritic FSS by a sol–gel process.31 Next, amorphous TiO2 nanoparticles were deposited on the FSS to form SION@FSS@Am-TiO2, which undergo a hydrothermal reaction to yield the SION@FSS@A-TiO2.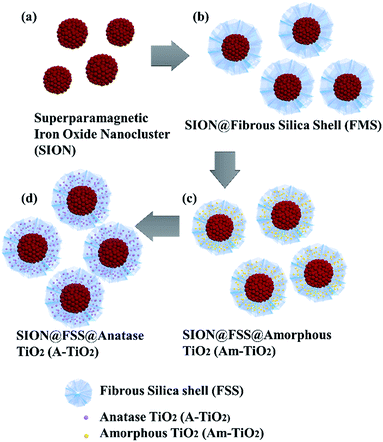 | ||
| Scheme 1 Schematic of the procedure for preparing magnetically recoverable photocatalyst: (a) SION, (b) SION@FSS, (c) SION@FSS@Am-TiO2 and (d) SION@FSS@A-TiO2. | ||
The starting SION has a raspberry-like shape 4s, which is a conglobulation of 5–10 nm iron oxide nanocrystals packed into a 280 ± 37 nm nanoclusters (Fig. S1, ESI†).52 These SIONs combine the advantages of individual grains and confer an enhanced magnetic property.42 The oil–water biphase stratification approach31 was used to prepare a silica coating shell with fibrous large pores that enable enhanced adsorption and release ability. To generate such silica coating shells, SIONs were first dispersed in water and mixed with CTAB and TEA. Then, TEOS and 1-octadecene were added to the mixture; the mixture was hydrolyzed and condensed to generate the first FSS layer on SION. The second-layer generation step starts with discarding the oil layer and adding TEOS and decalin. The final layer is generated using a mixture of TEOS and cyclohexane as an oil-based solvent. After removing residual CTABs by calcination, TBOT was added dropwise to an ethanolic solution of SION@FSS and water. Amorphous TiO2 nanoparticles supported on SION@FSS were crystallized using the hydrothermal method. EDX analysis (Fig. S6, ESI†) shows that iron and oxide spectra are dominant in the center of the particles and silica and titanium spectra dominate on the outer side of the particles.
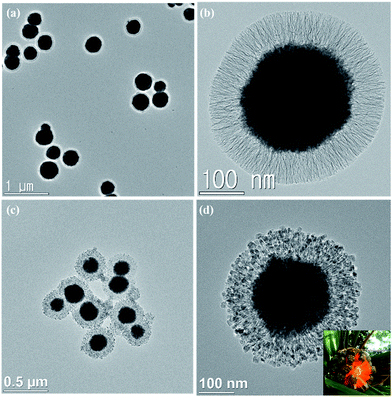
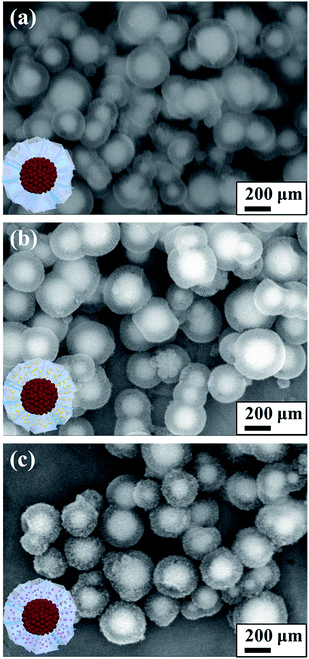
Fibrous silica shell with uniform layer thickness could be clearly seen in both TEM (Fig. 1) and SEM images (Fig. 2). Average size of SION@FSS was 317.7 ± 56.2 nm, as shown in the SEM images. The average layer thickness of SION@FSS was 71.1 ± 7.5 nm. SION@FSS shows wide size distribution owing to the polydispersity of the iron oxide cores, but the thickness of FSS is uniform irrespective of the size of the core. The size of prehydrothermal SION@FSS@Am-TiO2 was 324 ± 50.0 nm and that of posthydrothermal SION@FSS@A-TiO2 was 305 ± 37.9 nm, as derived from the SEM observations. The thickness of the coating FSS + Am-TiO2 layer was 70.5 ± 9.1 nm. To crystalize the TiO2 nanoparticle from amorphous to anatase phase, hydrothermal method is used due to low energy required compared to high temperature furnace method. After the posthydrothermal treatment, the layer shrunk a little to 68.9 ± 8.3 nm. It has been reported that silica could be partially etched during the hydrothermal treatment.33
For SION@FSS synthesis without residual FSS particles, the amount of TEOS was adjusted from 4 mL to 12.5 μL during the first layer stratification (Fig. S2, ESI†). When 4 mL of TEOS was added, SION@FSS spheres were fused with several FSS particles (Fig. S2(a), ESI†). The aggregated FSS spheres were separated when the TEOS amount was reduced to 1 mL (Fig. S2(b), ESI†), but SION@FSS agglomerates were still present. Separation of fused SION@FSS was obtained by gradually reducing the TEOS volume to 250 μL (Fig. S2(b)–(e), ESI†). Fully separated SION@FSS nanoparticles started to appear on using 50 μL of TEOS (Fig. S2(f), ESI†). By reducing the TEOS volume below 50 μL, the FSS layer becomes thinner and cannot be observed by TEM (Fig. S2(g) and (h), ESI†). After first and second FSS were coated on single SION@FSS nanoparticles, TEOS volume were controlled for the third layer generation (Fig. S3, ESI†). Likewise, the amount of TEOS is optimized to have single core for each nanocomposites.
To take advantage of their wide surface area and application in photocatalysis, TiO2 spheres were confined in pores. To increase the filling amount without remnant TiO2 spheres, the amount of TBOT was adjusted from 10 μL to 2 mL (Fig. S4, ESI†). Experimental results showed that 400–800 μL of TBOT was sufficient to fill in the FSS pores (Fig. S4(b) and (c), ESI†). When the TBOT concentration reached 1% (v/v), fused SION@FSS@Am-TiO2 nanoparticles were observed (Fig. S4(d), ESI†). Otherwise, when TBOT concentration was too low, considerable number of the FSS pores remained empty (Fig. S4(a), ESI†). As a result, SION@FSS@Am-TiO2 synthesized with 800 μL of the titanium precursor was used for further analysis.
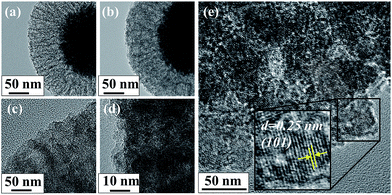
Titanium dioxide nanoparticle loading were verified from both TEM images (Fig. 3) and EDX analysis (Fig. S6, ESI†). When 400 μL of TBOT was used (Fig. 3a), more pore voids between the FSS layers were observed compared to when 800 μL of TBOT was used (b). On magnified view (b and d), more TiO2 nanoparticles were observed when 400 μL of TBOT was used (c) compared with that when 800 μL of TBOT (d). It shows high possibility of greater TiO2 nanoparticles loading on SION@FSS@Am-TiO2 by increasing the amount of titanium precursor. Loading of TiO2 nanoparticles after hydrothermal reaction was determined by the crystalline structure the grains observed between the FSS layers, which matches the (101) plane of the anatase nanocrystals (e).
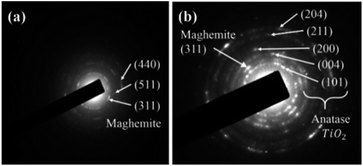
Crystalline structures were investigated by powder X-ray diffraction (XRD) (Fig. 4). The grain size of SION was calculated by the Debye–Scherrer equation. Using the most intense diffraction peak from Fig. 4c, the (311) plane of maghemite, it was found that the SION has 10.94 nm grains. Since amorphous TiO2 shows less photocatalytic activity compared to anatase TiO2, the nanocomposite undergoes crystallization. The phases of the titanium-coated samples before and after the crystallization step were characterized (Fig. 4). Prehydrothermal TiO2 nanoparticles were amorphous as no SION@FSS@Am-TiO2 spectrum (b) matched that of anatase (ICDD PDF card 03-065-5714). Maghemite (ICDD PDF card 00-004-0755) peaks or patterns are dominant in both XRD (Fig. 4) and SAED (Fig. 5) results, suggesting that the iron oxide core is maghemite in nature with polycrystalline structure. The core is initially magnetite,52 but undergoes transition to maghemite during the hydrothermal reaction. After the hydrothermal reaction, the diffraction spectrum obtained from SION@FSS@A-TiO2 (Fig. 4a) shows a peak at 25.3° corresponding to the (101) reflection of anatase. Peaks at 48.04° and 53.88° are attributed to the (200) and (105) planes, respectively, of the anatase-phase TiO2.
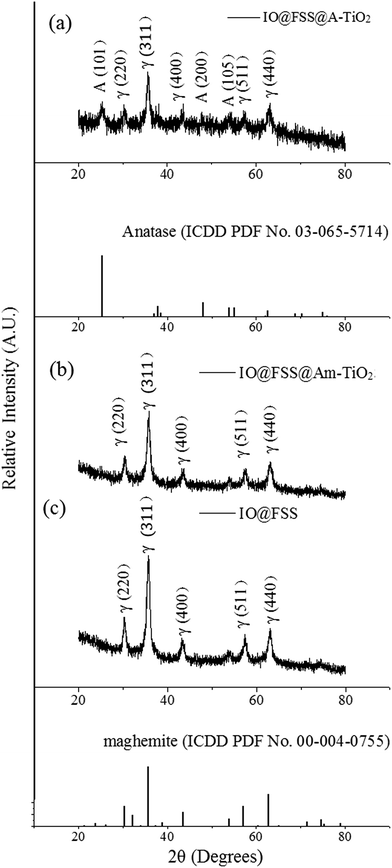 | ||
| Fig. 4 X-ray diffraction analysis of (a) SION@FSS@A-TiO2, (b) SION@FSS@Am-TiO2 and (c) SION@FSS. Crystal planes are indexed with γ (maghemite) and A (anatase). | ||
Although maghemite spectra are dominant in XRD, SAED analysis clearly revealed the existence of other anatase planes. The five ring patterns in (Fig. 5(b)) correspond to the (204), (211), (200), (004), and (101) planes of anatase TiO2. The most intense peak of SION@FSS@A-TiO2 in the SAED patterns corresponds to the (311) plane of maghemite. To sum up, appearance of anatase peaks prove the transition of amorphous to anatase phase of the supported TiO2 after the hydrothermal treatment.
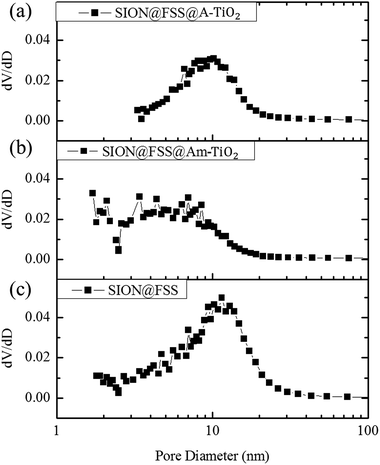
Morphological change at each synthesis step is summarized in the Table 1. Total pore volume of the SION@FSS spheres, 0.745 cm3 g−1, match that of the FSS spheres from the previous report, 0.689 cm3 g−1. Reduced surface area of SION@FSS@Am-TiO2 confirms that TiO2 is supported in the SION@FSS pores. During the hydrothermal reaction, amorphous TiO2 undergoes crystallization and crystal growth, leading to the increased TiO2 nanoparticle size. Thus, pores below 10 nm are absent from the pore size distribution graph of SION@FSS@A-TiO2 (Fig. 6). Therefore, increased pore size after hydrothermal reaction is expected to be due to the removal of micropores and mesopores from between the TiO2 nanoparticles.53 This also leads to close packing of the TiO2 nanoparticles, which reduces the SION@FSS@A-TiO2 surface area to 149.98 m2 g−1.
| Sample name | SBET (m2 g−1) | Vt (cm3 g−1) | DBJH (nm) |
|---|---|---|---|
| a SBET, Brunauer–Emmett–Teller pore surface area (m2 g−1). Vt, single-point adsorption total pore volume at P/Po = 0.994; DBJH, Barrett–Joyner–Halenda adsorption average pore diameter. | |||
| SION@FSS | 265.62 | 0.745 | 11.22 |
| SION@FSS@Am-TiO2 | 237.07 | 0.434 | 8.39 |
| SION@FSS@A-TiO2 | 149.98 | 0.434 | 12.77 |
The nanoparticles were recollected using the magnetic property of the iron oxide core. The graph of induced magnetization versus field shows saturation magnetization at 4.114 emu per g (Fig. 7). Saturation magnetization of SION@FSS@Am-TiO2 is lower than that of the iron oxide core,52 owing to the presence of silica and TiO2 nanoparticle that do not contribute to magnetic induction. In addition, the combined effect may be integrated with the reduced magnetization value. Surfactants on SION cores may act as a carbon source and become amorphous carbon during the annealing of SION@FSS so does magnetization value may slightly enhanced.47 Due to the thickness of the shell, magnetic moment may change.48 All the nanoparticles that were synthesized based on SION@FSS were dragged by a small handheld magnet and were redispersed easily by shaking the vials after withdrawing the magnet.
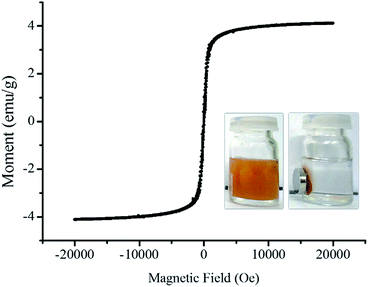 | ||
| Fig. 7 Field-dependence of magnetization graph of SION@FSS@A-TiO2 measured at 20 K. Inset shows SION@FSS@A-TiO2 dispersed in ethanol (left) and magnetically collected SION@FSS@A-TiO2 (right). | ||
Finally, the catalytic effect of the anatase TiO2 decorated on the particle surface is evaluated (Fig. 8, S11 and S12, ESI†), after reaching the absorption–desorption equilibrium (Fig. S10, ESI†) after 2 h. MetB solution was purified using UV-illuminated catalyst nanoparticles, SION@FSS@A-TiO2. With the aid of SION@FSS@A-TiO2, 3 mg L−1 of dye molecules were degraded before 3 h of UV-irradiation (Fig. S11(c), ESI†). SION@FSS@A-TiO2 shows much higher dye decomposition rate than same amount of commercial P25 TiO2 nanoparticles (Fig. 8b and c). Since a considerable amount of non-catalytic materials are included in the mass of SION@FSS@A-TiO2, rate constant in Fig. 8 might be higher for the reaction with catalysts, SION@FSS@A-TiO2. Considering the very low first-order rate constant of anatase TiO2 nanoparticles54 and thin film55 made in a similar manner without magnetic core and silica supports, the synthesis and the use of SION@FSS@A-TiO2 may enhance the photocatalytic effect. Finally, the nanoparticles were reused after the degradation (Fig. S11d, ESI†). The recycled SION@FSS@A-TiO2 shows less catalyst deterioration after the repeated trials while retaining its structure (Fig. S7, ESI†) at the end of the degradation trials. The removal time and concentration of degraded MetB dye is compared with other magnetically recollectable nanocomposites with TiO2 nanoparticles (Table S3, ESI†). From the results, SION@FSS@A-TiO2 show comparable degradation performance while considering the lamp intensity and amount of catalysts used.
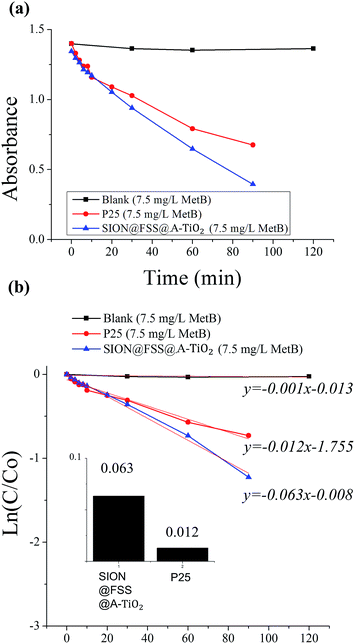 | ||
| Fig. 8 Degradation test with MetB solution (7.5 mg L−1) and SION@FSS@A-TiO2 compared to that with commercial P25. Absorbance vs. time (a) data was linear fitted (b) to compare rate constants (inset). | ||
Conclusions
In summary, a magnetically recoverable photocatalyst was prepared by supporting TiO2 nanoparticles on a superparamagnetic iron oxide nanocluster core@fibrous silica shell nanocomposite. Using the raspberry-shaped magnetic core as a seed, seed-mediated growth was used to form a fibrous silica shell (FSS), which enabled enhanced adsorption and release ability, directly on the iron oxide nanocluster surface. The FSS shell coating was repeated thrice to increase the pore radius of the core@shell nanostructures. FSS with fibrous-shaped large pores enables large amounts of nanoparticles to be easily supported on the pore surface.The core@shell nanostructure was optimized to have a single core for each nanoparticle by adjusting the amount of the silica source. Amorphous TiO2 supported on a superparamagnetic iron oxide nanocluster core@fibrous silica shell nanocomposite was crystallized to the anatase phase (SION@FSS@A-TiO2), as it shows a good photocatalytic effect. When used for water purification, the screwpine-shaped SION@FSS@A-TiO2 shows higher dye degradation kinetics compared to commercial P25 nanoparticles. Additionally, the presence of a magnetically inducible SION core in SION@FSS@A-TiO2 enables its recollection from water after use.
Acknowledgements
This work was supported by Nano Material Technology Development Program (NRF-2015M3A7B6027970) of MSIP/NRF and by the Center for Integrated Smart Sensors funded by the Ministry of Science, ICT and Future Planning, Republic of Korea, as Global Frontier Project (CISS-012M3A6A6054186).Notes and references
- D. Paraschiv, C. Tudor and R. petrariu, Sustainability, 2015, 7, 1280–1291 CrossRef.
- H. Hettige, M. Mani and D. Wheeler, J. Dev. Econ., 2000, 62, 445–476 CrossRef.
- C. A. Gonzales, E. Riboli and G. Lopez-Abente, Am. J. Ind. Med., 1988, 14, 673–680 CrossRef CAS PubMed.
- J. S. Bae and H. S. Freeman, Dyes Pigm., 2007, 73, 81–85 CrossRef CAS.
- A. L. Linsebigler, G. Lu and J. T. Yates, Chem. Rev., 1995, 95, 735–758 CrossRef CAS.
- X. Li and Y. Zhao, Water Sci. Technol., 1997, 36, 165–172 CrossRef CAS.
- J. Augustynski, Electrochim. Acta, 1993, 38, 43–46 CrossRef CAS.
- V. H. Grassian, A. Adamcakova-Dodd, J. M. Pettibone, P. I. O'shaughnessy and P. S. Thorne, Nanotoxicology, 2007, 1, 211–226 CrossRef CAS.
- C. M. Sayes, R. Wahi, P. A. Kurian, Y. Liu, J. L. West, K. D. Ausman, D. B. Warheit and V. L. Colvin, Toxicol. Sci., 2006, 92, 174–185 CrossRef CAS PubMed.
- J. G. Ayres, P. Borm, F. R. Cassee, V. Castranova, K. Donaldson, A. Ghio, R. M. Harrison, R. Hider, F. Kelly and I. M. Kooter, Inhalation Toxicol., 2008, 20, 75–99 CrossRef CAS PubMed.
- T. Kuhlbusch, H. Krug and K. Nau, NanoCare Project Partners, NanoCare, Health related Aspects of Nanomaterials, DECHEMA e. V., Germany, 2009 Search PubMed.
- J. A. Byrne, B. R. Eggins, N. M. D. Brown, B. McKinney and M. Rouse, Appl. Catal., B, 1998, 17, 25–36 CrossRef CAS.
- A. Fernández, G. Lassaletta, V. M. Jiménez, A. Justo, A. R. González-Elipe, J. M. Herrmann, H. Tahiri and Y. Ait-Ichou, Appl. Catal., B, 1995, 7, 49–63 CrossRef.
- D. Zhao, J. Feng, Q. Huo, N. Melosh, G. H. Fredrickson, B. F. Chmelka and G. D. Stucky, Science, 1998, 279, 548–552 CrossRef CAS PubMed.
- C. Kresge, M. Leonowicz, W. Roth, J. Vartuli and J. Beck, nature, 1992, 359, 710–712 CrossRef CAS.
- Z. Luan, E. M. Maes, P. A. W. van der Heide, D. Zhao, R. S. Czernuszewicz and L. Kevan, Chem. Mater., 1999, 11, 3680–3686 CrossRef CAS.
- Y. Xu and C. H. Langford, J. Phys. Chem. B, 1997, 101, 3115–3121 CrossRef CAS.
- B. J. Aronson, C. F. Blanford and A. Stein, Chem. Mater., 1997, 9, 2842–2851 CrossRef CAS.
- R. Singh, R. Bapat, L. Qin, H. Feng and V. Polshettiwar, ACS Catal., 2016, 6, 2770–2784 CrossRef CAS.
- R. van Grieken, J. Aguado, M. J. López-Muñoz and J. Marugán, J. Photochem. Photobiol., A, 2002, 148, 315–322 CrossRef CAS.
- V. Polshettiwar, D. Cha, X. Zhang and J. M. Basset, Angew. Chem., Int. Ed., 2010, 49, 9652–9656 CrossRef CAS PubMed.
- X. Huang, Z. Tao, J. C. Praskavich, A. Goswami, J. F. Al-Sharab, T. Minko, V. Polshettiwar and T. Asefa, Langmuir, 2014, 30, 10886–10898 CrossRef CAS PubMed.
- D.-S. Moon and J.-K. Lee, Langmuir, 2012, 28, 12341–12347 CrossRef CAS PubMed.
- X. Du and J. He, Langmuir, 2011, 27, 2972–2979 CrossRef CAS PubMed.
- X. Du and S. Z. Qiao, Small, 2015, 11, 392–413 CrossRef CAS PubMed.
- A. Fihri, D. Cha, M. Bouhrara, N. Almana and V. Polshettiwar, ChemSusChem, 2012, 5, 85–89 CrossRef CAS PubMed.
- Q. Qu, Y. Min, L. Zhang, Q. Xu and Y. Yin, Anal. Chem., 2015, 87, 9631–9638 CrossRef CAS PubMed.
- X. Du, X. Li and J. He, ACS Appl. Mater. Interfaces, 2010, 2, 2365–2372 CAS.
- K. Zhang, L.-L. Xu, J.-G. Jiang, N. Calin, K.-F. Lam, S.-J. Zhang, H.-H. Wu, G.-D. Wu, B. Albela, L. Bonneviot and P. Wu, J. Am. Chem. Soc., 2013, 135, 2427–2430 CrossRef CAS PubMed.
- D.-S. Moon and J.-K. Lee, Langmuir, 2014, 30, 15574–15580 CrossRef CAS PubMed.
- D. Shen, J. Yang, X. Li, L. Zhou, R. Zhang, W. Li, L. Chen, R. Wang, F. Zhang and D. Zhao, Nano Lett., 2014, 14, 923–932 CrossRef CAS PubMed.
- J. Liu, S. Z. Qiao and Q. H. Hu, Small, 2011, 7, 425–443 CrossRef CAS PubMed.
- S. Linley, T. Leshuk and F. X. Gu, ACS Appl. Mater. Interfaces, 2013, 5, 2540–2548 CAS.
- M. Ye, Q. Zhang, Y. Hu, J. Ge, Z. Lu, L. He, Z. Chen and Y. Yin, Chem.–Eur. J., 2010, 16, 6243–6250 CrossRef CAS PubMed.
- S. Kurinobu, K. Tsurusaki, Y. Natui, M. Kimata and M. Hasegawa, J. Magn. Magn. Mater., 2007, 310, e1025–e1027 CrossRef CAS.
- L. Zhao, Y. Chi, Q. Yuan, N. Li, W. Yan and X. Li, J. Colloid Interface Sci., 2013, 390, 70–77 CrossRef CAS PubMed.
- S. Watson, D. Beydoun and R. Amal, J. Photochem. Photobiol., A, 2002, 148, 303–313 CrossRef CAS.
- F. Chen, Y. Xie, J. Zhao and G. Lu, Chemosphere, 2001, 44, 1159–1168 CrossRef CAS PubMed.
- F. Chen and J. Zhao, Catal. Lett., 1999, 58, 246–247 CrossRef.
- A. H. Lu, E. E. Salabas and F. Schüth, Angew. Chem., Int. Ed., 2007, 46, 1222–1244 CrossRef CAS PubMed.
- J. Ge, Y. Hu, M. Biasini, W. P. Beyermann and Y. Yin, Angew. Chem., Int. Ed., 2007, 46, 4342–4345 CrossRef CAS PubMed.
- O. Gerber, B. P. Pichon, C. Ulhaq, J.-M. Grenèche, C. Lefevre, I. Florea, O. Ersen, D. Begin, S. Lemonnier, E. Barraud and S. Begin-Colin, J. Phys. Chem. C, 2015, 119, 24665–24673 CAS.
- Z. Sun, H. Li, D. Guo, J. Sun, G. Cui, Y. Liu, Y. Tian and S. Yan, J. Mater. Chem. C, 2015, 3, 4713–4722 RSC.
- J. Yang, D. Shen, Y. Wei, W. Li, F. Zhang, B. Kong, S. Zhang, W. Teng, J. Fan and W. Zhang, Nano Res., 2015, 8, 2504–2514 Search PubMed.
- K. Yu, X. Zhang, H. Tong, X. Yan and S. Liu, Mater. Lett., 2013, 106, 151–154 CrossRef CAS.
- T. Atabaev, J. H. Lee, J. J. Lee, D. W. Han, Y. H. Hwang, H. K. Kim and N. H. Hong, Nanotechnology, 2013, 24, 345603 CrossRef PubMed.
- M. Tadic, S. Kralj, M. Jagodic, D. Hanzel and D. Makovec, Appl. Surf. Sci., 2014, 322, 255–264 CrossRef CAS.
- L. Kopanja, S. Kralj, D. Zunic, B. Loncar and M. Tadic, Ceram. Int., 2016, 42, 10976–10984 CrossRef CAS.
- L. Kopanja, I. Milosevic, M. Panjan, V. Damnjanovic and M. Tadic, Appl. Surf. Sci., 2016, 362, 380–386 CrossRef CAS.
- M. Tadic, I. Milosevic, S. Kralj, M. Mbodji and L. Motte, J. Phys. Chem. C, 2015, 24, 13868–13875 Search PubMed.
- J. Lee, M. Othman, Y. Eom, T. Lee, W. Kim and J. Kim, Microporous Mesoporous Mater., 2008, 116, 561–568 CrossRef CAS.
- J. Liu, Z. Sun, Y. Deng, Y. Zou, C. Li, X. Guo, L. Xiong, Y. Gao, F. Li and D. Zhao, Angew. Chem., Int. Ed., 2009, 121, 5989–5993 CrossRef.
- J. Yu, G. Wang, B. Cheng and M. Zhou, Appl. Catal., B, 2007, 69, 171–180 CrossRef CAS.
- S. Senthilkumaar, K. Porkodi and R. Vidyalakshmi, J. Photochem. Photobiol., A, 2005, 31, 225–232 CrossRef.
- N. R. Mathews, E. R. Morales, M. A. Cortés-Jacome and J. T. Antonio, Sol Energ, 2009, 83, 1499–1508 CrossRef CAS.
Footnote |
| † Electronic supplementary information (ESI) available: TEM images of the as-prepared SION and SION@FSS; nitrogen adsorption desorption isotherms of SION@FSS, SION@FSS@Am-TiO2 and SION@FSS@A-TiO2; EDS of SION@FSS, SION@FSS@Am-TiO2 and SION@FSS@A-TiO2; TEM image of the SION@FSS@A-TiO2 after the detoxification of water; and calibration curve of methylene blue. See DOI: 10.1039/c6ra27907d |
| This journal is © The Royal Society of Chemistry 2017 |

