 Open Access Article
Creative Commons Attribution 3.0 Unported Licence
The formation mechanisms of porous silicon prepared from dense silicon monoxide†
Shao-zhong Zeng ab,
Xierong Zengabc,
Lin Huanga,
Hongliang Wua,
Yuechao Yaoa,
Xianfeng Zhengd and
Jizhao Zou*a
aShenzhen Key Laboratory of Special Functional Materials, Shenzhen Engineering Laboratory for Advance Technology of Ceramics, College of Materials Science and Engineering, Shenzhen University, Shenzhen 518060, PR China. E-mail: zoujizhao@szu.edu.cn
bKey Laboratory of Optoelectronic Devices and Systems of Ministry of Education and Guangdong Province, College of Optoelectronic Engineering, Shenzhen University, Shenzhen 518060, PR China
cJANUS (Dongguan) Precision Components Co., Ltd., China
dCollege of Medicine, Shenzhen University, Shenzhen, 518060, P. R. China
First published on 23rd January 2017
Abstract
Porous silicon (PSi) has been widely investigated for use in many applications. PSi is usually prepared through the selective etching of silicon. Recently, PSi has been prepared by reducing dense silicon monoxide (SiO) with magnesium. Although the porosity has been confirmed to be a result of the selective acid dissolution of MgO, the formation mechanisms of the composite of MgO and PSi are not very clear. To better understand the formation mechanisms, we synthesized two types of PSi by reducing compact SiO and disproportionate SiO (d-SiO) with different magnesium content. The BET surface area and pore volume of these PSi samples first increased and then decreased. The highest BET surface area was 304 and 328 m2 g−1 for PSi prepared from SiO and d-SiO, respectively. These BET surface areas are among the highest for PSi prepared from dense SiO or silica. An inductive effect of the preformed silicon network in d-SiO was found by contrasting the pore characteristics of the two types of PSi derived from SiO and d-SiO. Accordingly, we suggested two models for the formation mechanisms of PSi from SiO and d-SiO.
Introduction
Porous silicon (PSi) has been widely investigated for applications in energy storage devices,1–4 optoelectronics and drug delivery devices.5–7 Generally, PSi is made from metallurgical silicon by metal-assisted chemical etching,8,9 stain etching and catalytic gas etching.10,11 PSi prepared using these methods retains the crystal structure and purity of the metallurgical silicon.8,9,11 In addition to these methods, magnesiothermic reduction is a newly developed method for preparing PSi through the redox reaction between magnesium and porous silica.12–17 Numerous porous silicas, such as mesoporous silica,2,18 hollow porous SiO2,13 silica aerogels,14 silica nanotubes,19 diatomite,20 and silica from rice husks and bamboo leaves,16,21 have been used as raw materials for PSi. PSi prepared using this method will partially retain the pore structure of the porous silica raw material,2,18 resulting in high surface area of the PSi. Therefore, dense silicon is an expected product from the reaction of dense silica and Mg. However, several pioneering works have shown that PSi with high porosity formed unexpectedly in the magnesiothermic reduction of nonporous silica and silicon monoxide (SiO).1,22,23 Although the porosity of PSi has been confirmed to be a result of the selective acid dissolution of MgO,1 the formation mechanisms of the composite of MgO and PSi is not very clear.Compared with silica, SiO has a high silicon content and low heat release per mole silicon in the magnesiothermic reduction,24 which facilitates the scalable production of PSi.17 Therefore, we focused on the reduction reaction between SiO and Mg. SiO has a homogeneous amorphous structure which is a metastable phase and converts into a composite of silicon and SiO2 at high temperature.25 The silicon and SiO2 in this composite form two networks interpenetrated with each other,25 which is different from the original homogeneous SiO material. These differences may lead to different reactivity with Mg and different pore structure of the final product. A detailed study of the differences in the reaction of SiO and disproportionate SiO (d-SiO) with Mg will further our understanding of the formation mechanisms of PSi. In this work, two types of PSi were prepared through the magnesiothermic reduction of SiO and d-SiO with different Mg content. We observed an inductive effect of the preformed silicon network in d-SiO by contrasting the pore characteristics of the two types of PSi derived from SiO and d-SiO. The formation mechanisms of the composite of MgO and PSi were thoroughly studied by analysing the relationship between the pore structures and Mg content in magnesiothermic reduction.
Experimental
Sample preparation
SiO (200 mesh, 99.99%) and Mg (100 mesh, 99.8%) were purchased from Macklin Co. (Shanghai, China). First, 4.40 g of SiO was mixed thoroughly with different magnesium contents (0.60, 1.20, 1.80 and 2.40 g) using a ball grinder. The mixture was transferred into a tubular furnace, heated to 300 °C at a heating rate of 5 °C min−1, held at 300 °C for 3 h, heated to 500 °C at a heating rate of 2 °C min−1 and held at 500 °C for 12 h. All the heat treatments were done under Ar flow (50 mL min−1). After cooling, the mixture was added slowly to an excess amount of 10 wt% HCl, stirred for 12 h, vacuum-filtered, washed with large amounts of water and ethanol and dried at 80 °C. The PSi with 0.60, 1.20, 1.80 and 2.40 g was denoted as PSi-06, PSi-12, PSi-18 and PSi-24, respectively. d-SiO was obtained by heat treating SiO at 950 °C under Ar flow (50 mL min−1) for 4 h. PSi was similarly synthesized from d-SiO and named as PSi-06D, PSi-12D, PSi-18D and PSi-24D, respectively.Characterizations
Powder X-ray diffraction (XRD) patterns were recorded on a Bruker D8 Advance diffractometer using Cu-Kα radiation (40 kV and 200 mA). Data were collected from 2θ = 15° to 80° with a step of 0.02° and a scanning rate of 0.2° s−1. Nitrogen isotherms were measured at 77 K using an ASAP 2020 system (Micromeritics Co.). The samples were pretreated at 373 K and a pressure of less than 1.33 Pa for 1 h with further degassing at 473 K and a pressure of less than 26.7 Pa for 4 h. The specific surface area was calculated using the Brunauer–Emmett–Teller (BET) method based on the adsorption data obtained within a partial pressure (P/Po) range of 0.05–0.20, and the total pore volume was determined from the amount of nitrogen adsorbed at P/Po = 0.99. The pore size distribution was calculated by the original density functional theory (DFT) included in the software ASAP 2020 system. The average pore diameter was calculated from Barrett–Joyner–Halenda (BJH) analyses. Scanning electron microscopy (SEM) and energy dispersive spectroscopy (EDS) were carried out on a field emissionSU-70 microscope. TEM images were obtained using a JEOL JEM2010 electron microscope.Results and discussion
The powder XRD patterns of the composites of PSi and MgO are shown in Fig. 1. As the magnesium content increased, the diffraction peaks of silicon and MgO (Fig. 1a and c) strengthened, and the peak of amorphous SiO weakened, which demonstrates that an increasing amount of SiO was converted into PSi and MgO. After the removal of MgO, only the peaks corresponding to silicon and amorphous SiO remained (Fig. 1b and d). According to the Scherrer formula, the crystallite sizes of MgO and silicon were obtained from the half width of the strongest peaks. As shown in Table S1,† the crystallite size of MgO and silicon were approximately 10 nm. After the removal of MgO, the crystallite size of silicon increased in the PSi obtained from SiO, whereas that of the silicon obtained from d-SiO remained unchanged. However, the larger crystallite size is probably an illusion rather than real growth because the weak peaks of the PSi from SiO and the broad peak of amorphous SiO limit the accuracy of the estimation of crystallite size. The crystallite size of silicon in PSi-06D (6 nm) was obviously larger than that of d-SiO (4 nm), which suggests that the silicon reduced by Mg grows on the preformed silicon network. To gain further insight into the reaction process, four samples containing 0.60 g of Mg + 4.40 g of SiO, 0.60 g of Mg + 4.40 g of d-SiO, 2.40 g of Mg + 4.40 g of SiO and 2.40 g of Mg + 4.40 g of d-SiO were heat-treated at 300 °C for 3 h. The powder XRD patterns of the corresponding products are shown in Fig. S1.† All the patterns contain strong Mg peaks, proving that part of the Mg remains under these reaction conditions. The peaks at 2θ = 24.24 and 40.12 belong to Zintl-phase Mg2Si and demonstrate the formation of Mg2Si under these conditions. A wide peak at 42.8° is attributed to the strongest main peak of MgO (200), which suggests that the MgO grains were very small in these samples. Obviously, MgO is the most stable and thermodynamically favourable form of Mg. However, not all the Mg forms MgO at low temperature because of the high activation energy of the corresponding reaction. Instead, part of the Mg forms Mg2Si owing to the fast generation rate of this compound.26 Therefore, the formation of Mg2Si is the result of a dynamic effect rather than a thermodynamic effect.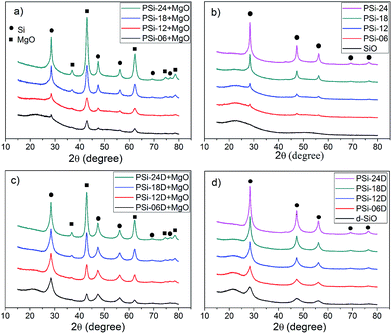 | ||
| Fig. 1 Powder XRD patterns of the products obtained from SiO before (a) and after (b) removing MgO. Powder XRD patterns of the products obtained from d-SiO before (c) and after (d) removing MgO. | ||
As shown in Fig. 2, the surface morphology of the PSi from SiO changed from randomly distributed particles to a sponge-like network when the Mg content changed from 0.6–1.8 g. The surface morphology of the PSi prepared with 2.4 g of Mg transformed into a flat surface with visible pores, and many particles with diameters of 20–100 nm grew on the surface of large particles. The netlike surface morphology of PSi-06D was different from that of PSi-06, which probably resulted from the induction effect of the preformed silicon network in the d-SiO. The preformed silicon network plays two roles. First, it acts as a nucleus for the growth of the newly formed silicon; second, it acts as a magnesium transfer channel because the diffusion of magnesium is faster in silicon than in MgO.26 As a result of the inductive effect, the surface morphologies of PSi-12D and PSi-18D were almost the same as that of PSi-06D, except for the difference in porosity, which suggests that the d-SiO particles were transferred into PSi from the outside to the inside along with the increase of the Mg content. PSi-24D was significantly different from the PSi prepared with low Mg content and appeared similar to PSi-24, but with larger pores.
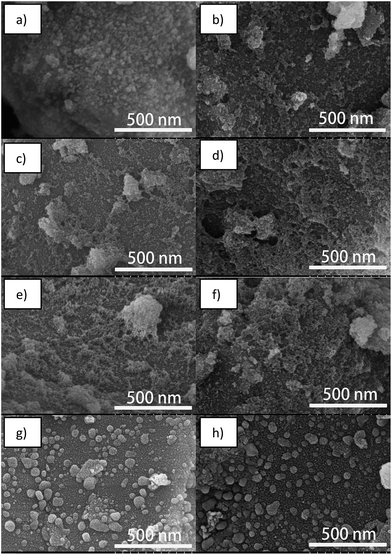 | ||
| Fig. 2 SEM images of PSi prepared by reducing 4.40 g of SiO (left) and d-SiO (right) with different Mg contents; from top to bottom, the Mg content was 0.6, 1.2, 1.8 and 2.4 g. | ||
The TEM images of PSi-06 (Fig. 3a) and PSi-06D (Fig. 3b) show dense cores coated with PSi, which is an expected result because the lack of Mg can only convert the outside of the particles into PSi. Dense cores should also be present in PSi-12 and PSi-12D but are difficult to clearly observe using TEM (Fig. 3c and d) because of the thicker PSi coating. The TEM images of PSi-18 (Fig. 3e) and PSi-18D (Fig. 3f) show a highly developed pore network without dense cores. The TEM images of PSi-06D, PSi-12D and PSi-18D demonstrate that the thickness of the PSi coating increased with the Mg content and the pore structure of the PSi coating was not obviously different among these samples. The pore diameter in PSi-24 (Fig. 3g) was decreased compared with that of PSi-18. The pore networks in PSi-24 and PSi-24D contained some degree of order compared with the totally disordered network in the other PSi samples. High-resolution TEM images (Fig. S2 and S3†) show that all the PSi samples contained silicon grains with sizes of ∼10 nm, which is consistent with the XRD results. The insets of Fig. S2 and S3† showed the selected area electron diffraction (SAED) patterns of PSi-24 and PSi-24D, which were the characteristic reflections of polycrystalline silicon. The three diffraction rings corresponded to Si (111), (220) and (311) crystal planes of cubic phase. The SAED pattern of PSi-24D also showed rings of high index crystal planes because of its developed crystal structure as compared with PSi-24.
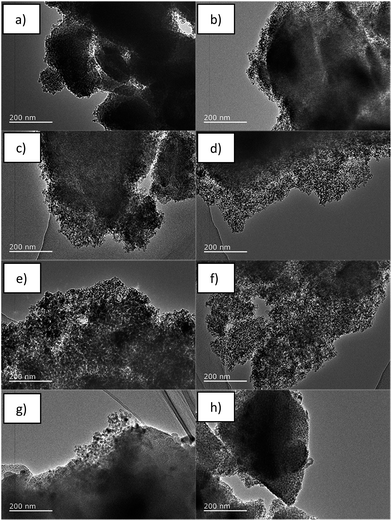 | ||
| Fig. 3 TEM images of PSi prepared by reducing 4.40 g of SiO (left) and d-SiO (right) with different Mg contents; from top to bottom, the Mg content was 0.6, 1.2, 1.8 and 2.4 g. | ||
The composition and element distribution of PSi were obtained from EDS analyses. As shown in Table S2,† the silicon content increased and oxygen content decreased along with the increase of Mg content, which matched with the powder XRD results (Fig. 1) and TEM images (Fig. 3). The highest silicon contents of PSi samples prepared from SiO and d-SiO were 85.05 (PSi-24) and 90.25 wt% (PSi-24D), respectively. The Mg contents for all these PSi samples were ∼1 wt%, demonstrating an effective removal of MgO by HCl. The element distributions of PSi-18 and PSi-24 were shown in Fig. S4 and S5,† respectively. The elements silicon, oxygen and Mg were uniformly distributed in these samples. The element distribution of other samples was similar and did not show.
Nitrogen adsorption–desorption isotherms were measured at 77 K to calculate the surface area and thoroughly analyse the pore characteristics of the PSi. According to the classification of the International Union of Pure and Applied Chemistry, all the nitrogen adsorption–desorption isotherms (Fig. 4a and b) were type IV with H3-type hysteresis loops. The isotherm of PSi-06 was close to type II because the pores of PSi-06 were almost uniformly distributed in the range of 2–50 nm. The multilayer adsorption of these large pores gives rise to a type II/IV isotherm.
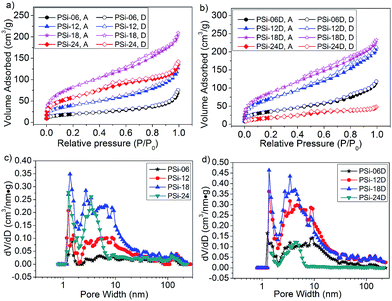 | ||
| Fig. 4 Nitrogen adsorption (filled) and desorption (unfilled) curves of the PSi obtained from (a) SiO and (b) d-SiO; DFT pore size distribution of PSi obtained from (c) SiO and (d) d-SiO. | ||
The BET surface area and pore volume (Table 1) of these PSi samples first increased and then decreased. These parameters increased in turn when the magnesium content increased from 0.60 to 1.80 g and decreased when the magnesium content increased from 1.80 to 2.40 g. The highest BET surface area was 304 and 328 m2 g−1 for PSi obtained from SiO and d-SiO, respectively, which are 50% larger than the surface area of the PSi prepared from dense SiO with sufficient Mg (212 m2 g−1). To the best of our knowledge, these values are among the highest of those obtained for PSi prepared by reducing dense silica or SiO with Mg.1,17,22,23 Unexpectedly, the highest Mg content did not correspond to the largest surface area and pore volume, which could be due to the larger pores formed at high Mg content through the confusion of MgO grains. Due to the developed silicon grains of PSi-24D (Table S1 and inset of Fig. S3†), the BET surface area and pore volume of PSi-24D were far smaller than those of PSi-18D and PSi-24.
| Sample number | BET surface area (m2 g−1) | Pore volume (cm3 g−1) | Average pore diameter (nm) |
|---|---|---|---|
| PSi-06 | 69 | 0.11 | 8.7 |
| PSi-12 | 145 | 0.20 | 7.0 |
| PSi-18 | 304 | 0.31 | 4.9 |
| PSi-24 | 212 | 0.21 | 4.6 |
| PSi-06D | 130 | 0.18 | 6.1 |
| PSi-12D | 267 | 0.32 | 5.1 |
| PSi-18D | 328 | 0.35 | 4.5 |
| PSi-24D | 67 | 0.07 | 4.1 |
Remarkably, the surface area and pore volume of PSi-06D and PSi-12D were approximately two times larger than those of PSi-06 and PSi-12, which probably resulted from the inductive effect of the preformed silicon network in the d-SiO. The pore size distributions of PSi (Fig. 4c and d) were calculated using DFT. All PSi contained some micropores less than 2 nm in size. The pore size distributions of the PSi from SiO (Fig. 4c) changed greatly along with the increase of Mg content. The pore size of PSi-06 was widely distributed in the range of 2–50 nm, whereas those of PSi-12 and PSi-18 were mainly distributed in the range of 2–20 nm; moreover, the shapes of the two curves had a certain degree of similarity. The pore size of PSi-24 mainly centred in the range of 2–8 nm with a peak at 3.4 nm. The pore sizes of PSi-06D, PSi-12D and PSi-18D (Fig. 4d) were distributed in the range of 2–20 nm, and the shapes of these curves showed high similarities. For the PSi from d-SiO, the pores with sizes of 2–20 nm increased proportionally when the Mg content increased from 0.60 to 1.80 g. This result suggests that the d-SiO particles transferred into PSi from outside to inside with the increase of Mg content, which agrees with the TEM results. The similarity in the pore size distribution of PSi-06D, PSi-12D and PSi-18D is consistent with the similarity of the SEM images, which is evidence for the inductive effect of the preformed silicon network in d-SiO. By contrast, the similarity in the pore size distribution of PSi-06, PSi-12 and PSi-18 is not obvious because there is no preformed silicon network in untreated SiO.
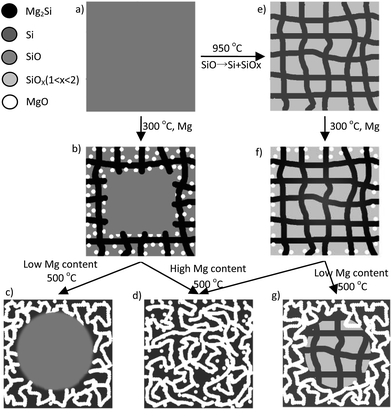
Accordingly, we suggested two models for the formation mechanisms of the PSi derived from SiO and d-SiO, respectively. The amorphous SiO (Fig. 5a) reacted with Mg to form randomly distributed silicon and MgO nuclei at the surface of the SiO particles. Because Mg was present in local excess at the surface of SiO, the silicon nuclei instantly converted into Mg2Si nuclei. Both Mg2Si (Fig. 5b) and MgO grew into the inside of the SiO particle, which was supported by Fig. S1.† When the temperature increased, Mg2Si further reacted with adjacent SiO to form silicon and MgO. The silicon and MgO formed two networks that interpenetrated with each other. After removing the MgO network by acid, the silicon network remained as the PSi samples. At Mg content lower than 1.8 g per 4.4 g of SiO, the core of the SiO particle did not convert into PSi and MgO (Fig. 5c), which was confirmed by Fig. 3. Moreover, the BET surface area and pore volume of PSi (Table 1) were near-linear with Mg content when Mg was lower than 1.8 g per 4.4 g of SiO and deviated from linear relationship at higher Mg content, which was an indirect evidence for turning point happened at 1.8 g of Mg and transformation from outside to inside. At Mg content higher than 1.8 g per 4.4 g of SiO, the whole SiO particle converted into PSi and MgO (Fig. 5d), which was confirmed by TEM images (Fig. 3e–h).
The reaction between d-SiO and Mg is similar but more straightforward. According to previous study,25 d-SiO is composed of two networks interpenetrated with each other. Although the silicon network in d-SiO could not be clearly observed in Fig. S6,† the silicon network probably formed by connecting silicon grains with amorphous silicon that was invisible in TEM image. Furthermore, the existences of the silicon network could be indirectly proved by the formation of PSi after selectively removing of SiOx (1 < x < 2) network.25 With this knowledge, we deduced that the preformed silicon network (Fig. 5e) of d-SiO first reacted with Mg to form Mg2Si at 300 °C (Fig. 5f). Meanwhile, some MgO was formed from the reaction between Mg and SiOx (1 < x < 2). Mg2Si reacted with adjacent SiOx (1 < x < 2) to form silicon and MgO at higher temperatures (Fig. 5d and g). The inductive effect of the preformed silicon network was exhibited in the following two roles. First, it acted as a channel for Mg diffusion. Second, it served as a skeleton on which the reduced silicon grows. The inductive effect led to higher BET surface area and pore volume of PSi-06D and PSi-12D as compared with PSi-06 and PSi-12.
Conclusions
In summary, two types of PSi have been synthesized by the magnesiothermic reduction of SiO and d-SiO. The pore formation mechanisms were thoroughly analysed by comparing the pore structure of PSi reduced by different Mg contents. Conversion of the SiO and d-SiO particles into PSi and MgO from outside to inside as the Mg content increased from 0.6 g of Mg to 1.8 g of Mg per 4.4 g of SiO was confirmed. The BET surface area and pore volume of these PSi samples increased in turn when the magnesium content increased from 0.60 to 1.80 g and decreased when the magnesium content increased from 1.80 to 2.40 g per 4.40 g of SiO. The highest BET surface area was 304 and 328 m2 g−1 for the PSi obtained from SiO and d-SiO, respectively. These BET surface areas are among the highest of those obtained for PSi prepared from dense SiO and silica. The preformed silicon network in d-SiO exerted an inductive effect on the formation of PSi at low Mg content, which led to a BET surface area and pore volume that were approximately twice as large as those of the PSi from SiO. Accordingly, two models were suggested to describe the formation mechanisms of the PSi derived from SiO and d-SiO. These results are of great importance for precisely controlling the pore structure of PSi prepared from dense SiO or silica.Acknowledgements
This work was financially supported by the National Natural Science Foundation of China (No. 51202150 and 51272161), Program of Introducing Innovative Research Team in Dongguan (No. 2014607109), foundation of the State Key Laboratory of Solidification Processing in NWPU (SKLSP201110) and Shenzhen Basic Research Program (No. JCYJ20160422091418366).Notes and references
- A. Xing, J. Zhang, Z. Bao, Y. Mei, A. S. Gordin and K. H. Sandhage, Chem. Commun., 2013, 49, 6743–6745 RSC.
- H.-C. Tao, L.-Z. Fan and X. Qu, Electrochim. Acta, 2012, 71, 194–200 CrossRef CAS.
- L. Shi, W. Wang, A. Wang, K. Yuan and Y. Yang, J. Alloys Compd., 2016, 661, 27–37 CrossRef CAS.
- J. Cho, J. Mater. Chem., 2010, 20, 4009–4014 RSC.
- P. Jongho, Y. Yanagida and T. Hatsuzawa, Sens. Actuators, B, 2016, 233, 136–143 CrossRef.
- N. Shrestha, F. Araujo, M. A. Shahbazi, E. Makila, M. J. Gomes, B. Herranz-Blanco, R. Lindgren, S. Granroth, E. Kukk, J. Salonen, J. Hirvonen, B. Sarmento and H. A. Santos, Adv. Funct. Mater., 2016, 26, 3405–3416 CrossRef CAS.
- T. Yong, J. Hu, X. Zhang, F. Li, H. Yang, L. Gan and X. Yang, ACS Appl. Mater. Interfaces, 2016, 8(41), 27611–27621 CAS.
- B. M. Bang, J.-I. Lee, H. Kim, J. Cho and S. Park, Adv. Energy Mater., 2012, 2, 878–883 CrossRef CAS.
- B. M. Bang, H. Kim, H.-K. Song, J. Cho and S. Park, Energy Environ. Sci., 2011, 4, 5013–5019 CAS.
- Z. Zhang, Y. Wang, W. Ren, Q. Tan, Y. Chen, H. Li, Z. Zhong and F. Su, Angew. Chem., 2014, 126, 5265–5269 CrossRef.
- M. Ge, Y. Lu, P. Ercius, J. Rong, X. Fang, M. Mecklenburg and C. Zhou, Nano Lett., 2014, 14, 261–268 CrossRef CAS PubMed.
- P. Wu, H. Wang, Y. Tang, Y. Zhou and T. Lu, ACS Appl. Mater. Interfaces, 2014, 6, 3546–3552 CAS.
- D. Chen, X. Mei, G. Ji, M. Lu, J. Xie, J. Lu and J. Y. Lee, Angew. Chem., Int. Ed., 2012, 51, 2409–2413 CrossRef CAS PubMed.
- K. Chen, Z. Bao, J. Shen, G. Wu, B. Zhou and K. H. Sandhage, J. Mater. Chem., 2012, 22, 16196–16200 RSC.
- Z. Bao, M. R. Weatherspoon, S. Shian, Y. Cai, P. D. Graham, S. M. Allan, G. Ahmad, M. B. Dickerson, B. C. Church, Z. Kang, H. W. Abernathy Iii, C. J. Summers, M. Liu and K. H. Sandhage, Nature, 2007, 446, 172–175 CrossRef CAS PubMed.
- A. Xing, S. Tian, H. Tang, D. Losic and Z. Bao, RSC Adv., 2013, 3, 10145–10149 RSC.
- Z. Favors, W. Wang, H. H. Bay, Z. Mutlu, K. Ahmed, C. Liu, M. Ozkan and C. S. Ozkan, Sci. Rep., 2014, 4, 5623 CAS.
- H. Jia, P. Gao, J. Yang, J. Wang, Y. Nuli and Z. Yang, Adv. Energy Mater., 2011, 6, 1036–1039 CrossRef.
- Y. Zhang and J. Huang, J. Mater. Chem., 2011, 21, 7161–7165 RSC.
- Z.-L. Xu, B. Zhang, Z.-Q. Zhou, S. Abouali, M. Akbari Garakani, J. Huang, J.-Q. Huang and J.-K. Kim, RSC Adv., 2014, 4, 22359–22366 RSC.
- L. Wang, B. Gao, C. Peng, X. Peng, J. Fu, P. K. Chu and K. Huo, Nanoscale, 2015, 7, 13840–13847 RSC.
- D. F. Qiu, G. Bu, B. Zhao and Z. X. Lin, J. Solid State Electrochem., 2015, 19, 935–939 CrossRef CAS.
- W. Wang, Z. Favors, R. Ionescu, R. Ye, H. H. Bay, M. Ozkan and C. S. Ozkan, Sci. Rep., 2015, 5, 8781 CrossRef CAS PubMed.
- S. M. Schnurre, J. Gröbner and R. Schmid-Fetzer, J. Non-Cryst. Solids, 2004, 336, 1–25 CrossRef CAS.
- R. Yi, F. Dai, M. L. Gordin, S. Chen and D. Wang, Adv. Energy Mater., 2013, 3, 295–300 CrossRef CAS.
- I. Kogut and M. C. Record, Thin Solid Films, 2012, 522, 149–158 CrossRef CAS.
Footnote |
| † Electronic supplementary information (ESI) available: The crystallite sizes of MgO and Si, XRD, EDS, HRTEM and SAED. See DOI: 10.1039/c6ra27929e |
| This journal is © The Royal Society of Chemistry 2017 |

