 Open Access Article
Creative Commons Attribution 3.0 Unported Licence
Highly CO tolerant PtRu/PtNi/C catalyst for polymer electrolyte membrane fuel cell
Qi Wang *a,
Guoxiong Wangb,
Hualong Taoa,
Zhiqiang Lia and
Lei Hana
aLiaoning Key Materials Laboratory for Railway, School of Materials Science and Engineering, Dalian Jiaotong University, Dalian, 116028, Liaoning, China. E-mail: qiwang@djtu.edu.cn; Fax: +86-411-84109417; Tel: +86-411-84106925
bState Key Laboratory of Catalysis, Dalian Institute of Chemical Physics, Chinese Academy of Sciences, 457 Zhongshan Road, Dalian, 116023, China
First published on 26th January 2017
Abstract
Galvanic displacement and annealing treatment were used to construct a PtRu/PtNi/C catalyst with PtRu on the surface and PtNi in the core. PtNi alloy was formed during high-temperature reduction, and the surface Ni in the PtNi alloy was subsequently replaced by Ru in RuCl3 solution. The H2 annealing treatment at 300 °C increased the crystallinity by surface PtRu alloy formation. The prepared PtRu/PtNi/C catalyst demonstrated higher CO electro-oxidation activity than PtNi/C, PtNi–Ru/C and PtRu/C catalysts. The enhanced CO tolerance is ascribed to the synergistic effect between the PtRu surface and the PtNi core, which induces oxygen containing species produced on surface Ru sites at low potentials, weakened adsorption of CO on metal sites, and high PtRu utilization.
1. Introduction
Carbon monoxide (CO) poisoning of the anode catalyst has remained one of the key challenges in the research and development of polymer electrolyte membrane fuel cells (PEMFC) in the last decades.1–3 Even trace amounts of CO (ppm level) in the anode feeds can severely decrease the output power and energy efficiency of PEMFC using a Pt catalyst at the anode.4,5 Alloying Pt with other elements has been extensively explored to improve the CO tolerance, such as bi-metallic PtRu/C, PtNi/C, PtIr/C and PtSn/C catalysts etc.6–10 The PtRu/C catalyst exhibits the highest CO tolerance among these bimetallic catalysts. A bifunctional mechanism and ligand effects are usually proposed as the origin of improved CO tolerance on PtRu catalysts. The bifunctional mechanism is attributed to the facilitation of COads oxidation on Pt in the presence of Ru by producing oxygen-containing species at low potentials.6,11 The ligand effect suggests that the electronic structure of Pt is modified by forming an alloy with Ru, which weakens CO adsorption on Pt.12,13PtRu-based ternary catalysts were explored in order to further improve the CO tolerance along with decreasing the content of precious metals.9,14–16 PtRuNi ternary catalysts have been prepared by co-reduction of the corresponding metal precursors, however, the composition and structure of PtRuNi catalysts are rather complicated.17–21 In addition, Ni species on the surface is easily to be dissolved in acidic medium in PEMFC.22 Therefore, preparation of a core–shell structure, in which Ni species is preferred to be located inside the bulk of nanoparticles, would prevent it from dissolution in acidic medium while keeping the interaction between Ni and surface Pt. Herein, a sequential preparation procedure is explored to synthesize PtRuNi catalyst with PtRu rich on the surface and PtNi rich in the core. The obtained PtRu/PtNi/C catalyst shows a much higher CO tolerance than PtRu/C and PtNi/C catalysts.
2. Experimental
2.1 Catalyst preparation
Carbon supported PtNi catalyst was prepared by impregnation-reduction method. Pt/C catalyst (Tanaka, 37 wt% Pt) was ultrasonically dispersed in 0.01 mol L−1 Ni(NO3)2 solution and the solvent was evaporated on a hot plate at 60 °C. The nominal atomic ratio of Pt to Ni is 3. Then it was dried in vacuum and calcined in 5% H2/Ar atmosphere from room temperature to 800 °C at a heating rate of 10° min−1. After the furnace temperature reached 800 °C, the sample was cooled to room temperature. The obtained sample was denoted as PtNi/C catalyst. PtNi/C catalyst was then added to 0.7 mg mL−1 RuCl3 solution under stirring for 24 h to obtain PtNi–Ru/C catalyst by the galvanic displacement reaction between Ni and Ru species. The solid was washed thoroughly with distilled water, and annealed at 300 °C for 2 h in 5% H2/Ar atmosphere. The final sample was denoted as PtRu/PtNi/C catalyst. PtRu/C catalyst with the same ratio of Pt to Ru in PtRu/PtNi/C catalyst was also prepared by the same method for comparison. Pt/C catalyst was ultrasonically dispersed in 0.7 mg mL−1 RuCl3 solution and then the solvent was evaporated on a hot plate at 60 °C. Finally the sample was annealed in 5% H2/Ar atmosphere for 2 h at 300 °C.2.2 Physicochemical characterization
X-ray diffraction (XRD) patterns of all the samples were obtained with an Empyrean X-ray diffractometer using Cu Ka radiation. The 2θ angular scan was measured from 10° to 90° with a scan rate of 0.2° s−1. The tube current was 40 mA with a tube voltage of 40 kV. Catalyst morphology was investigated by using a JSM 2100F transmission electron microscopy (TEM). More than 200 particles were measured to obtain the particle size distribution and mean particle size of the catalysts. X-ray energy dispersive spectroscopy (EDS) analysis was applied to analyze the element composition of the catalysts. High-angle annular dark field-scanning transmission electron microscopy (HAADF-STEM) was carried out using a JEM-ARM200F with a JED-2300T for energy dispersive X-ray spectrometer (EDS) mappings. X-ray photoelectron spectroscopy (XPS) measurements were carried out using a Thermo Scientific spectrometer with an Escalab 250 Xi X-ray as excitation source. The Pt 4f, Ru 3p and Ni 2p signals were collected. The position of the C 1s peak, that is, 284.6 eV was used to correct the binding energies of the elements.2.3 Electrochemical measurements
Electrochemical measurements were carried out in a three-electrode cell at room temperature. A glassy carbon (GC) electrode (Φ = 5 mm, Φ is the diameter of GC) covered by the prepared catalyst with Nafion ionomer as a binder was used as a working electrode.23 Pt sheet and saturated calomel electrode (SCE) was used as the counter electrode and reference electrode, respectively. While all the potential values in this paper were referred to the reversible hydrogen electrode (RHE). For CO stripping voltammetry measurements, pure CO was supplied into the electrolyte solution (0.1 mol L−1 HClO4) for 20 min. Then high-purity Ar was bubbled for 30 min to remove the CO dissolved in the electrolyte solution at a fixed potential of 0.09 V. The current–potential cycles were obtained from 0 to 1.0 V at a scan rate of 20 mV s−1. The potential of the working electrode was controlled by a PARSTAT 2273 potentiostat/galvanostat (Princeton).2.4 Membrane & electrode assembly fabrication and single cell test
A Toray 060 carbon paper (Toray Inc.) was employed as the anode and cathode backing layer. The carbon black loading was about 1.2 mg cm−2 and the PTFE content in the microporous layer was 40 wt%. The 37 wt% Pt/C catalyst (Tanaka) was used as the cathode catalyst. The resulting catalyst loading was 1.0 mg cm−2 and the Nafion ionomer content was 10 wt% in the anode and cathode catalyst layer. And the Nafion ionomer loading on the surface of the catalyst layer was about 0.5 mg cm−2. Finally, the anode and cathode (2 cm × 2 cm) were placed onto the two sides of a Nafion 212 membrane, and hot pressed at 135 °C and 1 MPa for 3 min to form the membrane & electrode assembly (MEA).24 The MEA with two silastic gasket was assembled into a single cell with graphite flow field plates and copper end plates attached with a heater. The single cell was installed on a Fuel Cell Testing Equipment (Arbin Corp.). Pure H2 (or H2/30 ppm CO mixture) at a flow rate of 80 mL min−1 and oxygen at a flow rate of 300 mL min−1 were fed into the anode and cathode at 0.2 MPa. During the measurement, the single cell was operated at 75 °C, and the anode and cathode humidifier temperatures were set at 75 and 70 °C, respectively. For stability test, the single cell was operated at 0.5 A cm−2 under the same conditions.3. Results and discussion
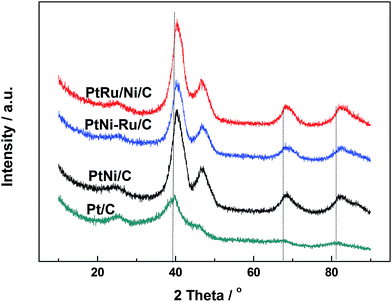
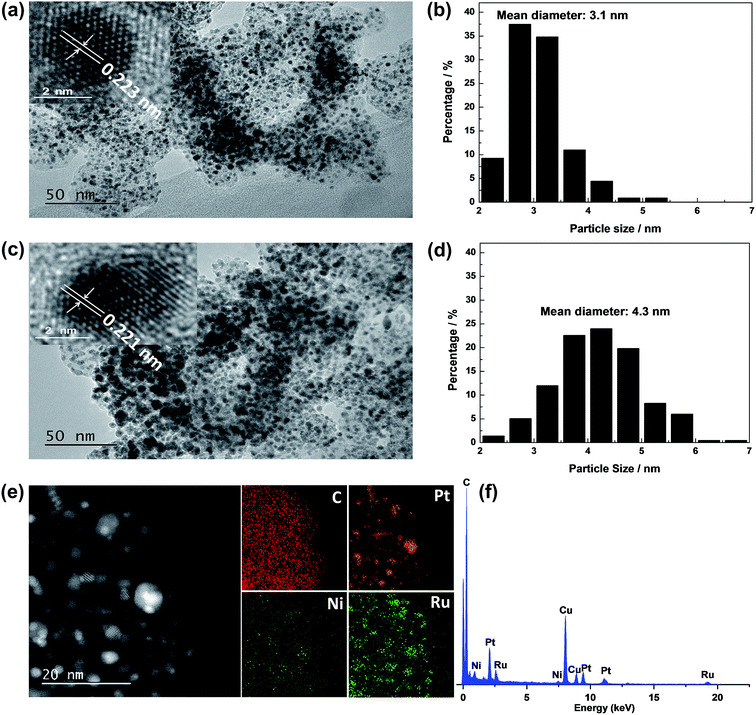
Fig. 1 shows XRD patterns of different catalysts. The first broad peak at 24.8° is associated with (002) plane of the carbon support. The diffraction peaks at about 39.2°, 45.8°, 67.5° and 81.3° are attributed to Pt(111), Pt(200), Pt(220) and Pt(311), respectively, showing a face-centred cubic (fcc) structure. The peaks of the other catalysts noticeably shift towards higher 2θ value while no additional diffraction peaks appear, indicating that PtNi/C catalyst shows the fcc structure with a decrease of lattice parameter due to alloying Pt with Ni. Based on the peak position of Pt(220), the lattice constant was calculated according to Bragg's law,25 and the value is 0.388, 0.386 and 0.386 nm for PtNi/C, PtNi–Ru/C and PtRu/PtNi/C catalysts, respectively. Compared with PtNi/C catalyst, the displacement of Ni by Ru further induces the peaks a slight shift to a higher angle in PtNi–Ru/C and PtRu/PtNi/C catalysts due to the alloying Pt with Ru. PtRu/PtNi/C catalyst has sharper diffraction peaks than PtNi–Ru/C catalyst, indicative of the increased crystallinity after H2 annealing.The morphologies and corresponding particle size distribution of PtNi/C and PtRu/PtNi/C catalysts were characterized by TEM, as shown in Fig. 2a–d. The mean particle size of PtNi/C catalyst is 3.1 nm, which is smaller than that of PtRu/PtNi/C catalyst (4.3 nm). Furthermore, it can be observed that the particles of PtNi/C catalyst are uniformly dispersed on the carbon support with a narrow size distribution. Comparatively, the larger particles size and broader particle distribution for PtRu/PtNi/C catalyst are attributed to the galvanic replacement reaction and the subsequent annealing treatment, which induced the growth and agglomeration of some nanoparticles. The high resolution TEM (HRTEM) images are inserted in Fig. 2a and c. The crystal lattice fringes are clearly visible and the lattice fringes distance is about 0.223 nm and 0.221 nm for PtNi/C and PtRu/PtNi/C catalysts, respectively, which is assigned to the crystalline face of the Pt(111) plane. The values are smaller than the standard data of 0.227 nm for Pt(111) due to the lattice contraction upon alloying (reference code: 00-001-1190). HADDF-STEM image and the corresponding EDS mappings in Fig. 2e show that the intensity distribution of Ni, Pt and Ru elements are similar on the carbon support in PtRu/PtNi/C catalyst. Fig. 2f confirms the existence of C, Pt, Ru and Ni elements. The atomic content of Pt, Ru and Ni is 69.4%, 25.0% and 5.6%, respectively. During the galvanic replacement reaction, most of the surface Ni was displaced by Ru ions. The following annealing treatment in H2 atmosphere may induce segregation of Pt to the surface of nanoparticles and leads to the formation of PtRu skin surface.26,27 HADDF-STEM image and the corresponding EDS mappings in Fig. 3 suggest that the PtRu/PtNi/C catalyst has a core–shell structure with PtRu on the surface and PtNi in the core.
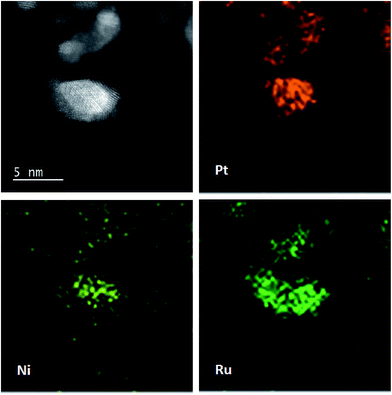 | ||
| Fig. 3 HAADF-STEM image with corresponding EDS mappings of Pt, Ru and Ni elements in the PtRu/PtNi/C catalyst. | ||
XPS measurements were carried out to elucidate the surface composition and oxidation state of Pt, Ru and Ni elements in PtNi/C, PtNi–Ru/C and PtRu/PtNi/C catalysts. The spectra of Pt 4f, Ru 3p, and Ni 2p in these catalysts are shown in Fig. 4. Pt 4f spectra contain two peaks corresponding to the Pt 4f7/2 and Pt 4f5/2 states from spin–orbital splitting. The Pt 4f7/2 spectra were deconvoluted with two different Pt oxidation states of Pt(0) and Pt(II), corresponding to the peaks at 71.6 and 72.4 eV. The data in Table 1 shows that the atomic ratio of Pt(0) in PtRu/PtNi/C catalyst is 77.7%, higher than 61.2% of PtNi–Ru/C catalyst and 67.7% of PtNi/C catalyst, indicating that the content of alloyed Pt increases after H2 annealing treatment. The Ru 3p3/2 signals can be deconvoluted into two peaks with binding energies corresponding to Ru(0) and Ru(IV) oxide, as shown in Fig. 4b. The Ru 3p signals in PtRu/PtNi/C and PtNi–Ru/C catalysts confirm the successful galvanic replacement of Ni in RuCl3 solution. The content of Ru(0) is 66.2% in PtRu/PtNi/C catalyst, higher than 58.7% in PtNi–Ru/C catalyst. The existence of atomic Pt and Ru further proves that PtRu alloy was formed and the alloy degree increased after H2 annealing treatment in PtRu/PtNi/C catalyst. From the spectra in Fig. 4c, it can be seen that the Ni 2p3/2 peak was deconvoluted into three peaks at about 853.0, 855.9 and 861.2 eV, which are assigned to Ni(0), Ni(OH)2 and NiO(OH), respectively.28 The content of Ni(OH)2 is 51.3% for PtRu/PtNi/C catalyst as the main existent form of Ni in the catalyst. The nickel hydroxides (NiO(OH) and Ni(OH)2) possess high proton and electron conductivities, in favor of CO electro-oxidation. Nevertheless, the metallic Ni with the content of 32% indicates the existence of PtNi alloy in PtRu/PtNi/C catalyst in combination with the diffraction peak shift in XRD patterns. In addition, the peak intensity of Ni 2p3/2 for PtRu/PtNi/C catalyst is much smaller than that of PtNi/C catalyst, as a result of the galvanic displacement reaction.
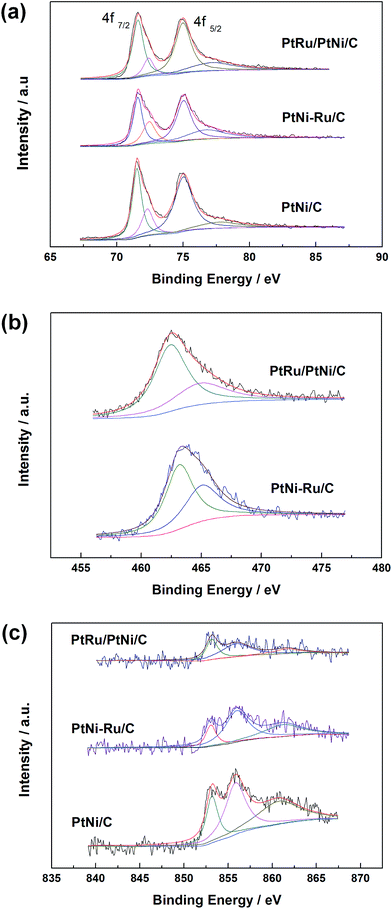 | ||
| Fig. 4 XPS spectra of Pt 4f (a), Ru 3p3/2 (b) and Ni 2p3/2 (c) in PtNi/C, PtNi–Ru/C and PtRu/PtNi/C catalysts. | ||
| Catalyst | Species | Binding energy/eV | Peak half-width | Assignment | Atomic ratio/% |
|---|---|---|---|---|---|
| PtRu/PtNi/C | Pt 4f7/2 | 71.6 | 1.0 | Pt | 77.7 |
| 72.4 | 0.9 | PtO | 22.3 | ||
| Ru 3p3/2 | 462.4 | 3.3 | Ru | 66.2 | |
| 464.9 | 5.2 | RuO2 | 33.8 | ||
| Ni 2p3/2 | 853.1 | 1.5 | Ni | 32.0 | |
| 855.9 | 3.8 | Ni(OH)2 | 51.3 | ||
| 861.6 | 3.5 | NiOOH | 16.7 | ||
| PtNi–Ru/C | Pt 4f7/2 | 71.6 | 0.8 | Pt | 61.2 |
| 72.4 | 1.1 | PtO | 38.8 | ||
| Ru 3p3/2 | 463.1 | 2.8 | Ru | 58.7 | |
| 465.0 | 3.5 | RuO2 | 41.3 | ||
| Ni 2p3/2 | 853.0 | 1.4 | Ni | 16.1 | |
| 855.9 | 3.1 | Ni(OH)2 | 51.9 | ||
| 861.2 | 5.0 | NiOOH | 32.0 | ||
| PtNi/C | Pt 4f7/2 | 71.5 | 0.8 | Pt | 67.7 |
| 72.3 | 1.0 | PtO | 32.3 | ||
| Ni 2p3/2 | 853.1 | 1.6 | Ni | 21.7 | |
| 855.8 | 2.7 | Ni(OH)2 | 41.0 | ||
| 860.7 | 5.6 | NiOOH | 37.3 |
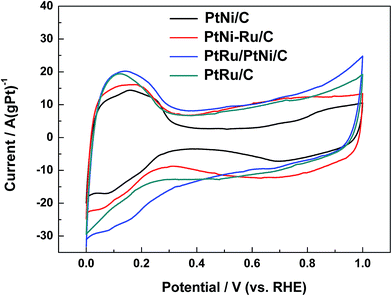
Typical cyclic voltammograms (CVs) of different catalysts in 0.1 mol L−1 HClO4 are shown in Fig. 5. CVs of PtNi/C catalyst shows the characteristic features of polycrystalline Pt, including hydrogen adsorption/desorption region, surface Pt oxidation/reduction region and double layer region between them. When the surface Ni was displaced by Ru, the features is not be well defined, indicating that the surface replacement broaden the double layer due to the capacitive characteristics of Ru.29 In addition, the OH adsorption on the surface metal active sites of PtNi–Ru/C catalyst occurs at about 0.45 V with a wide peak, showing a negative shift of 0.2 V compared to PtNi/C catalyst. The difference may originate from the lower crystallinity and the stronger oxygen infinity of Ru on PtNi–Ru/C catalyst. After H2 annealing treatment at 300 °C, CVs of PtRu/PtNi/C catalyst shows the broadest double layer with the same characteristics of PtRu/C catalyst. One broad current peak of hydrogen desorption is observed at about 0.1 V from the CVs compared to the defined two current peaks of PtNi/C catalyst, showing the features of typical PtRu alloy catalysts,11,30 which further verifies the increase of crystallinity and the formation of PtRu alloy on the catalyst surface.
Fig. 6 shows CO stripping voltammograms on different catalysts in 0.1 mol L−1 HClO4. The electro-oxidation of COads occurs at about 0.63 V and centers at 0.76 V for PtNi/C catalyst. While for PtNi–Ru/C catalyst, the onset of COads electro-oxidation is 0.38 V, showing negative shift of about 0.25 V. PtNi–Ru/C catalyst exhibits a wide CO stripping peak with a negative shift of about 0.06 V on the peak potential. After H2 annealing treatment at 300 °C, COads can be oxidized over PtRu/PtNi/C catalyst at almost the same onset potential of about 0.38 V with PtNi–Ru/C and PtRu/C catalysts. However, the current for CO electro-oxidation increases rapidly after the onset potential and current peak appears at 0.6 V, showing a negative shift of 0.16 V and 0.04 V compared to PtNi/C and PtRu/C catalysts, respectively. In addition, the CO electro-oxidation current is much higher than that of the other three catalysts. Based on the assumption of 420 μC cm−2 surface charges for linearly adsorbed CO, the electrochemical surface area was calculated according to the CO stripping peak.31 The electrochemical surface area of PtRu/PtNi/C catalyst is 35.4 cm2, larger than 15.3 cm2 for PtNi/C catalyst, 23.3 cm2 for PtNi–Ru/C catalyst and 28.4 cm2 for PtRu/C catalyst. The increased electrochemical surface area of PtNi–Ru/C catalyst compared to PtNi/C catalyst induces the improved CO electro-oxidation activities due to the successful replacement of surface Ni by Ru. After H2 annealing treatment, there is a further improvement towards electrochemical surface area of PtRu/PtNi/C catalyst, which is also larger than PtRu/C catalyst. In consideration of the structure advantages of PtRu/PtNi/C catalyst, the highly improved activity for CO electro-oxidation can be explained by the following three aspects. Firstly, oxygen containing species can be produced on Ru sites at relatively low potentials. Secondly, the bond between CO and Pt sites becomes weak induced by the synergetic effect between surface PtRu and PtNi alloy in the core. Finally, the utilization of PtRu alloy can be improved due to its large electrochemical surface area.
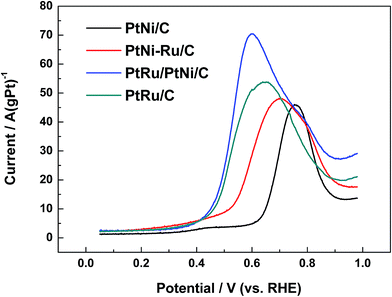 | ||
| Fig. 6 CO stripping voltammograms of different catalysts in 0.1 mol L−1 HClO4 solution at a scan rate of 20 mV s−1. | ||
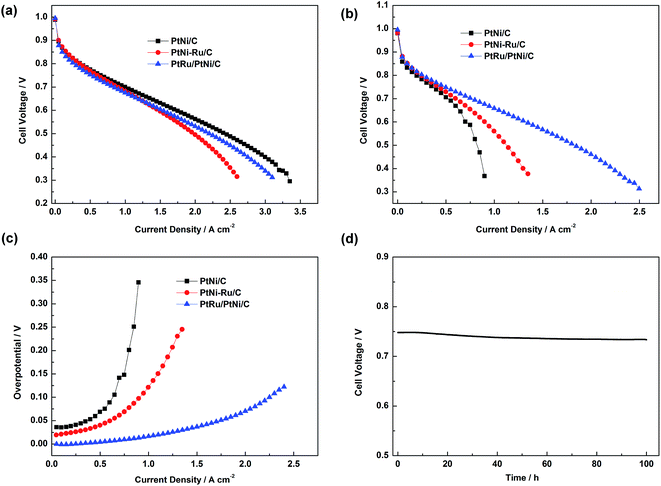
Single cell test was carried out to investigate the electrochemical activities of PtNi/C, PtNi–Ru/C and PtRu/PtNi/C catalysts toward H2 and H2/30 ppm CO mixture, as shown in Fig. 7a and b. When the anode was fed with pure H2, the performances of different catalysts show little difference in low current density region. PtNi–Ru/C catalyst shows the poorest performance in high current density region, probably due to that the hydrophilic Ru oxide or hydroxide on the catalyst surface inhibits oxygen mass transport. When the anode was fed with H2/30 ppm CO mixture, the performance difference becomes more obvious. PtNi/C catalyst shows a great performance decline, while PtNi–Ru/C catalyst gives an improved CO tolerance compared with PtNi/C catalyst, indicative of the promotional role of Ru species in PtNi–Ru/C catalyst. While for PtRu/PtNi/C catalyst, the performance for CO tolerance is much higher than the other two catalysts. The cell voltage of PtNi/C, PtNi–Ru/C and PtRu/PtNi/C catalysts is 0.53, 0.64 and 0.69 V at 0.8 A cm−2, respectively. The corresponding CO overpotential can directly evaluate the CO tolerance of different catalysts,26 as shown in Fig. 7c. The overpotential increases rapidly with current density for PtNi/C catalyst. However, it gently rises with the PEMFC discharging for PtRu/PtNi/C catalyst, indicative of a high CO tolerance. The improved performance is mainly ascribed to the structure merits of high utilization of Pt and Ru on the surface and the synergetic effect between the PtRu surface and PtNi core. Single cell test fed with H2/30 ppm CO mixture at 0.5 A cm−2 also indicate that the PtRu/PtNi/C catalyst has a high stability (Fig. 7d).
4. Conclusion
PtRu/PtNi/C catalyst was prepared by impregnation and high-temperature reduction, followed by galvanic displacement and annealing treatment. Physicochemical characterization and cyclic voltammetry results suggest that PtRu/PtNi/C catalyst has core–shell structure with PtRu alloy surface and PtNi alloy core. COads electro-oxidation activities of PtRu/PtNi/C catalyst are significantly improved compared to PtNi/C and PtRu/C catalysts. PtRu/PtNi/C catalyst also shows the highest CO tolerance in PEMFC test. The improved electro-catalytic activity is ascribed to the synergetic effect between the PtRu surface and PtNi core, which induces oxygen containing species produced on surface Ru sites at low potentials, weakened adsorption of CO on metal sites, and high PtRu utilization.Acknowledgements
We gratefully acknowledge the financial support from the National Scientific Fund of China (Grant 21403023) and Specialized Research Fund for the Doctoral Program of Higher Education of China (Grant No. 20122124120004).References
- N. V. Long, Y. Yang, C. M. Thi, N. V. Minh, Y. Cao and M. Nogami, Nano Energy, 2013, 2, 636–676 CrossRef
.
- S. G. Chen, Z. D. Wei, H. Li and L. Li, Chem. Commun., 2010, 46, 8782–8784 RSC
.
- T. Takeguchi, T. Yamanaka, K. Asakura, E. N. Muhamad, K. Uosaki and W. Ueda, J. Am. Chem. Soc., 2012, 134, 14508–14512 CrossRef CAS PubMed
.
- X. Cheng, Z. Shi, N. Glass, L. Zhang, J. Zhang, D. Song, Z.-S. Liu, H. Wang and J. Shen, J. Power Sources, 2007, 165, 739–756 CrossRef CAS
.
- H. F. Oetjen, V. M. Schmidt, U. Stimming and F. Trila, J. Electrochem. Soc., 1996, 43, 3838–3842 CrossRef
.
- E. Antolini, RSC Adv., 2016, 6, 3307–3325 RSC
.
- L. Zhang, J. Kim, H. M. Chen, F. Nan, K. Dudeck and R. Liu, J. Power Sources, 2011, 196, 9117–9123 CrossRef CAS
.
- A. Radillo-Diaz, Y. Coronado, L. A. Perez and I. L. Garzon, Eur. Phys. J. D, 2009, 52, 127–130 CrossRef CAS
.
- M. Zhu, G. Sun, S. Yan, H. Li and Q. Xin, Energy Fuels, 2009, 23, 403–407 CrossRef CAS
.
- J. C. M. Silva, R. F. B. De Souza, L. S. Parreira, E. Teixeira Neto, M. L. Calegaro and M. C. Santos, Appl. Catal., B, 2010, 99, 265–271 CrossRef CAS
.
- Q. Wang, G. Q. Sun, L. H. Jiang, Q. Xin, S. G. Sun, Y. X. Jiang, S. P. Chen, Z. Jusys and R. J. Behm, Phys. Chem. Chem. Phys., 2007, 9, 2686–2696 RSC
.
- A. U. Nilekar, K. Sasaki, C. A. Farberow, R. R. Adzic and M. Mavrikakis, J. Am. Chem. Soc., 2011, 133, 18574–18576 CrossRef CAS PubMed
.
- J. Melke, A. Schoekel, D. Dixon, C. Cremers, D. E. Ramaker and C. Roth, J. Phys. Chem. C, 2010, 114, 5914–5925 CAS
.
- Y. N. Wu, S. J. Liao, H. F. Guo and X. Y. Hao, J. Power Sources, 2013, 224, 66–71 CrossRef CAS
.
- A. Arun, M. Gowdhamamoorthi, K. Ponmani, S. Kiruthika and B. Muthukumaran, RSC Adv., 2015, 5, 49643–49650 RSC
.
- E. Antolini, ChemSusChem, 2013, 6, 966–973 CrossRef CAS PubMed
.
- A. B. A. A. Nassr, I. Sinev, W. Grünert and M. Bron, Appl. Catal., B, 2013, 142–143, 849–860 CrossRef CAS
.
- L. Chen, Y. Bao, Y. Sun, D. Ma, D. Ye and B. Huang, Catal. Sci. Technol., 2016, 6, 98–106 Search PubMed
.
- P. S. Roy, J. Bagchi and S. K. Bhattacharya, Catal. Sci. Technol., 2012, 2, 2302–2310 CAS
.
- R. Xiu, F. Zhang, Z. Wang, M. Yang, J. Xia, R. Gui and Y. Xia, RSC Adv., 2015, 5, 86578–86583 RSC
.
- Y. Zhao, Y. F. E, L. Z. Fan, Y. F. Qiu and S. H. Yang, Electrochim. Acta, 2007, 52, 5873–5878 CrossRef CAS
.
- H. Nan, X. Tian, J. Luo, D. Dang, R. Chen, L. Liu, X. Li, J. Zeng and S. Liao, J. Mater. Chem. A, 2016, 4, 847–855 CAS
.
- Q. Wang, H. Tao, Z. Li, C. Chen, S. Liu, L. Han and X. Lu, J. Energy Chem., 2016, 25, 811–816 CrossRef
.
- J. Li, G. Wang, J. Wang, S. Miao, M. Wei, F. Yang, L. Yu and X. Bao, Nano Res., 2014, 7, 1519–1527 CrossRef CAS
.
- G. Wang, T. Takeguchi, T. Yamanaka, E. N. Muhamad, M. Mastuda and W. Ueda, Appl. Catal., B, 2010, 98, 86–93 CrossRef CAS
.
- V. R. Stamenkovic, B. S. Mun, K. J. J. Mayrhofer, P. N. Ross and N. M. Markovic, J. Am. Chem. Soc., 2006, 128, 8813–8819 CrossRef CAS PubMed
.
- M. Huang, G. Dong, N. Wang, J. Xu and L. Guan, Energy Environ. Sci., 2011, 4, 4513–4516 CAS
.
- J. Zhao, H. Li, Z. Liu, W. Hu, C. Zhao and D. Shi, Carbon, 2015, 87, 116–127 CrossRef CAS
.
- B. C. Kima, G. G. Wallace, Y. I. Yoon, J. M. Ko and C. O. Too, Synth. Met., 2009, 159, 1389–1392 CrossRef
.
- M. S. Zheng, S. G. Sun and S. P. Chen, J. Appl. Electrochem., 2001, 31, 749–757 CrossRef CAS
.
- X. Jian, D. Tsai, W. Chung, Y. Huang and F. Liu, J. Mater. Chem., 2009, 19, 1601–1607 RSC
.
| This journal is © The Royal Society of Chemistry 2017 |

