 Open Access Article
Creative Commons Attribution 3.0 Unported Licence
Novel poly(ADP-ribose) polymerase inhibitor veliparib: biophysical studies on its binding to calf thymus DNA
Hongqin Yang,
Peixiao Tang,
Bin Tang,
Yanmei Huang,
Xinnuo Xiong and
Hui Li *
*
College of Chemical Engineering, Sichuan University, Chengdu, Sichuan, China. E-mail: Lihuilab@sina.com; Fax: +86 85401207; Tel: +86 28 85405149
First published on 7th February 2017
Abstract
Veliparib (ABT-888), which can inhibit cancer growth by blocking DNA base excision repair, is one of several recently developed oral inhibitors of poly(ADP-ribose) polymerases, which are currently used in clinical trials. In this work, interaction of calf thymus DNA (ctDNA) with ABT-888 was first investigated following UV-visible absorption, nuclear magnetic resonance (NMR) spectroscopy, steady-state and time-resolved fluorescence, viscosity measurements, circular dichroism (CD), and Fourier transform infrared (FT-IR) spectroscopy coupled with molecular docking methods. UV-visible absorption indicated that ABT-888 was indeed bound to ctDNA. Broadening and upfield shift of the proton peaks of ABT-888 in the proton NMR spectrum indicated that ABT-888 interacted with ctDNA primarily by partial intercalation. Fluorescence quenching and time-resolved fluorescence spectroscopy studies showed that binding of ABT-888 with ctDNA occurred through a static quenching mechanism, resulting in the formation of a ctDNA–ABT-888 complex. Thermodynamic calculations revealed that interaction was an enthalpy-driven process caused by hydrogen bonds and van der Waals forces. Competitive fluorescence experiments coupled with viscosity, CD, and FT-IR studies revealed that ABT-888 intercalates partially and binds to the groove, phosphate group, and deoxyribose sugar of ctDNA and also induces conformational changes. Molecular docking showed that ABT-888 preferably binds to the DNA groove. However, other types of binding, including classic intercalation and partial intercalation, cannot be ruled out.
1. Introduction
Currently, cancer remains a leading cause of death in countries around the world. A majority of anti-cancer drugs cause cell death through DNA damage, and in this situation, functioning DNA repair pathways act as mechanisms of drug resistance.1,2 Cancer cells can activate their own DNA damage repair to restore themselves, thus causing drug resistance against anti-cancer drugs and radiotherapy.3,4 Further research indicates that there is over-expression of DNA repair pathways in cancer cells. Thus, blocking DNA damage repair pathways is an important and new method of cancer therapy. Polyadenylation diphosphate ribose transferase (poly ADP-ribose polymerase, PARP) is a DNA repair enzyme, which plays a key role in DNA repair pathways. The superfamily of PARPs consists of six different enzymes: PARP-1, PARP-2, PARP-3, PARP-4/VPARP, tankyrase-1 and tankyrase-2.5 These enzymes engage in various cellular functions, including cell cycle regulation, transcription, and DNA damage repair.6 Thus, PARP inhibitors could be developed as chemosensitizers of DNA-damaging agents. PARP-1 is currently the best characterized enzyme in this group and is critical to repair of breaks in single-strand DNA through base excision repair pathway.5,7Veliparib (also called ABT-888) is a novel oral benzimidazole derivative and is the most represented PARP-1 inhibitors.8 Fig. 1 shows the complete chemical name of the compound (2-[(R)-2-ethylpyrrolidin-2-yl]-1H-benzimidazole-4-carboxamide) and its chemical structure. In vivo and in vitro experiments confirmed that ABT-888 increases cellular apoptosis and consequently inhibits cancer growth via blocking DNA base excision repair.9–11 Efficacy and safety data from recent phase I and II trials demonstrated that ABT-888, in combination of cytotoxic agents or as monotherapy, was well-tolerated and showed anticancer activity.12,13 In treatment of metastatic breast cancer, colon cancer, metastatic melanoma, and brain tumor, the compound has significant effects, and its combination with temozolomide is going to enter phase III clinical trials for treatment of breast cancer.14 Recent studies reported that ABT-888 also inhibits vessel formation in radiated cells.13 Many reports focus on functional targets of ABT-888, but none centered on detailed aspects of binding mode and binding region of ABT-888 and DNA and DNA structural change. Interestingly, investigation of interactive nature of ABT-888 with DNA can provide insight into drug anticancer activities involved in DNA damage repair pathways and provide support for continued clinical investigation of the drug.
Given the information above, this work aimed to investigate the mechanism of interaction (including binding mode, binding region, and structural feature) between ABT-888 and DNA using calf thymus DNA (ctDNA) in vitro under simulated physiological conditions. ctDNA has a relatively low protein content with a highly polymerized DNA skeleton which contains alternating sugar phosphate sequence.15,16 It is a natural DNA widely used in studies of binding between DNA and anticancer agents, which modulate DNA structure and function.17–19 It is also used in physicochemical studies of DNA behavior in solution. In the present study, UV-visible absorption and proton nuclear magnetic resonance (1H NMR) investigations were carried out to explore whether ABT-888 binds to ctDNA in solution. The quenching mechanism, binding constants, number of binding sites, and thermodynamic parameters were evaluated by steady-state and time-resolved fluorescence spectroscopy. Ethidium bromide (EB) and Hoechst 33258 were used as DNA probes for comparative study of the interaction of ABT-888 with ctDNA helix, and comparison was further supported by viscosity measurements, circular dichroism (CD), and Fourier transform infrared (FT-IR) spectroscopy. Furthermore, molecular docking was used to interpret experimental observations and to propose a three-dimensional (3D) model for the binding region of ctDNA–ABT-888 complex.
2. Materials and methods
2.1. Materials
Veliparib (purity > 99%) was purchased from Selleck (USA) [http://www.selleckchem.com]. Highly polymerized ctDNA sodium salt was purchased from Sigma-Aldrich Corporation (Milwaukee, USA) and was used without further purification. EB, Hoechst 33258, deuterium oxide (D2O, 99.9% purity), and dimethyl sulfoxide-d6 (DMSO-d6) were purchased from J&K Scientific Ltd. (Beijing, China). All reagents were of analytical reagent grade, and thrice-distilled water were used throughout the experiment.2.2. Sample preparation
ctDNA was dissolved in 10 mM phosphate buffer solution (PBS) of pH 7.4 and stored at 4 °C. Concentration of nucleotide was determined using UV-1800 Shimadzu ultraviolet (UV)-spectrophotometer (Japan). UV absorbance at 260 and 280 nm of ctDNA solution yielded a ratio of 1![[thin space (1/6-em)]](https://www.rsc.org/images/entities/char_2009.gif) :
:![[thin space (1/6-em)]](https://www.rsc.org/images/entities/char_2009.gif) 1.9 (ε260 = 6600 L mol−1 cm−1), indicating that ctDNA was sufficiently free of protein.19,20 Stock standard solution (5.0 × 10⁻³ M) of ABT-888 was prepared by dissolving the compound in DMSO. 1.0 × 10⁻³ M EB and 1.0 × 10⁻³ M Hoechst 33258 were prepared in thrice-distilled water.
1.9 (ε260 = 6600 L mol−1 cm−1), indicating that ctDNA was sufficiently free of protein.19,20 Stock standard solution (5.0 × 10⁻³ M) of ABT-888 was prepared by dissolving the compound in DMSO. 1.0 × 10⁻³ M EB and 1.0 × 10⁻³ M Hoechst 33258 were prepared in thrice-distilled water.
2.3. Apparatus and methods
![[thin space (1/6-em)]](https://www.rsc.org/images/entities/char_2009.gif) :
:![[thin space (1/6-em)]](https://www.rsc.org/images/entities/char_2009.gif) 3) were mixed thoroughly and added into the NMR tube for 1H NMR measurement of ABT-888. As a comparison, drug–DNA complex was prepared by mixing 2.4 mg ABT-888 and 2.8 mg ctDNA in 5.0 mL DMSO-d6 and D2O (2
3) were mixed thoroughly and added into the NMR tube for 1H NMR measurement of ABT-888. As a comparison, drug–DNA complex was prepared by mixing 2.4 mg ABT-888 and 2.8 mg ctDNA in 5.0 mL DMSO-d6 and D2O (2![[thin space (1/6-em)]](https://www.rsc.org/images/entities/char_2009.gif) :
:![[thin space (1/6-em)]](https://www.rsc.org/images/entities/char_2009.gif) 3). In all NMR experiments, 0.5 mL solutions were added into the NMR tube. 1H NMR spectra were processed using TopSpin 3.5 software (Bruker BioSpin, Ltd.).
3). In all NMR experiments, 0.5 mL solutions were added into the NMR tube. 1H NMR spectra were processed using TopSpin 3.5 software (Bruker BioSpin, Ltd.).| Fc = Fme(A1+A2)/2 | (1) |
![[thin space (1/6-em)]](https://www.rsc.org/images/entities/char_2009.gif) 000 energy evaluations and 27
000 energy evaluations and 27![[thin space (1/6-em)]](https://www.rsc.org/images/entities/char_2009.gif) 000 generations. All other parameters were measured at default setting. The lowest energy docked conformation, according to AutoDock scoring function, was selected as binding mode.
000 generations. All other parameters were measured at default setting. The lowest energy docked conformation, according to AutoDock scoring function, was selected as binding mode.3. Results and discussion
3.1. UV-visible absorption studies
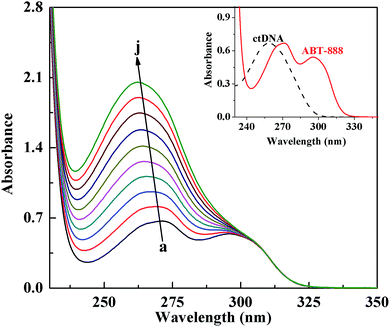
The strength and nature of binding interaction between ABT-888 and ctDNA can be obtained from the absorption titration method by following the changes in the absorbance and shift in the wavelength of DNA–drug complex.26–28 Most of small molecules noncovalently interact with DNA through three distinct mode types: (I) intercalation, (II) partially intercalated binding, and (III) groove binding, which can be stabilized by hydrophobic, electrostatic, and hydrogen bonding interactions.18,29,30 The absorption spectra of ABT-888 in the absence and presence of increasing concentration of ctDNA were recorded and are shown in Fig. 1. The inset shows the characteristic maximum absorption of ctDNA and ABT-888 centered at 271 and 296 nm in the wavelength range of 230–350 nm, respectively. With the gradual addition of ctDNA (0–22.8 × 10⁻⁵ M) to the fixed concentration of ABT-888 (8.0 × 10⁻⁵ M), there was a continuous increase of the absorption spectrum of ABT-888. Fig. 1 clearly shows the occurrence of the hyperchromicity of absorbance at 271 nm along with a blue shift of about 9 nm. In addition, the absorption peak at 296 nm gradually disappeared with the increasing concentration of ctDNA. These changes may be a result of the interaction of ABT-888 with ctDNA. Some investigators have reported that the binding of small molecules to the base pairs of DNA through intercalation usually results in hypochromic (or hyperchromic) effect and a red shift of the small molecules absorption band.20 Thus, our results show that ABT-888 is likely to interact with ctDNA through mixed-ligand type binding modes. Since the UV-visible spectroscopic results did not provide some defined evidence regarding the nature of binding between ABT-888 and ctDNA, some other experiments were needed to confirm the strength and nature of this interaction and its clear-cut binding mechanism.3.2. 1H NMR spectroscopy of ctDNA–ABT-888 system
NMR technique is a leading tool for probing and understanding at molecular level the binding between a small molecule and its target receptor. Specifically, 1H is the most commonly used atomic nuclei for DNA binding study given that it is not limited by molecular size and does not require isotope-labeling.31–33 The aforementioned three distinct types of ligand–DNA interaction mode are easily differentiated by 1H NMR signals based on changing line widths and chemicals shifts.31 In type I binding, intercalation of molecules into base pairs of DNA results from total line broadening of 1H NMR signal.34 For type II binding, observation includes line broadening and upfield chemical shift of the signal. These changes may arise from two reasons: (1) weak restrictions of molecular tumbling in the DNA complex; (2) slow rate exchange between various DNA binding sites and the unbound state of molecules. For type III binding, binding of molecules with DNA grooves is not exhibited in line broadening and upfield shift of the 1H NMR signal.In this experiment, 1H NMR measurements were carried out to understand how interaction mode is formed in the ctDNA–ABT-888 system. Fig. 2 shows ABT-888 1H NMR spectra obtained at 298 K in the absence and presence of ctDNA. Compared with Fig. 2A and B clearly shows line broadening of H-a, b, c, and d proton peaks after adding ctDNA, indicating that addition of ctDNA influences the microenvironment around ABT-888 protons.35 Table 1 shows the upfield shift of proton resonances of a, b, c, and d hydrogen atoms in the presence of ctDNA, indicating that π–π stacking interactions between ABT-888 and base pairs of ctDNA possibly exist, and magnetic shielding effects resulted in increased electron density in the surroundings of these protons after binding. Zhang et al.32 suggested that magnetic shielding effects may be caused by hydrogen bond formation between small drug molecules and ctDNA. There was a phenomenon that changes in the chemical shifts of the hydrogen of the benzimidazolyl moiety of ABT-888 were greater than those of the hydrogen of pyrrolidyl moiety in the presence of ctDNA (Table 1). This difference implies an unequal participation of the two moieties of ABT-888 in the formation of the complex and the benzimidazolyl moiety may be more intimate contact with ctDNA. Broadening and upfield shift of peaks of ABT-888 in the presence of ctDNA indicate that ABT-888 indeed bound to ctDNA through partial intercalation binding.
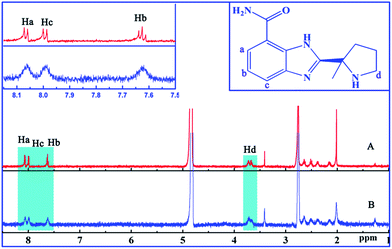 | ||
Fig. 2 ABT-888 1H NMR spectra in the absence (A) and presence (B) of ctDNA in DMSO-d6![[thin space (1/6-em)]](https://www.rsc.org/images/entities/char_2009.gif) : :![[thin space (1/6-em)]](https://www.rsc.org/images/entities/char_2009.gif) D2O (2 D2O (2![[thin space (1/6-em)]](https://www.rsc.org/images/entities/char_2009.gif) : :![[thin space (1/6-em)]](https://www.rsc.org/images/entities/char_2009.gif) 3) at 298 K. 3) at 298 K. | ||
| System | Ha | Hb | Hc | Hd |
|---|---|---|---|---|
| ABT-888 | 8.045 | 7.973 | 7.611 | 3.642–3.700 (multiple splitting peaks) |
| 8.033 | 7.950 | 7.599 | ||
| — | — | 7.598 | ||
| ctDNA–ABT-888 | 8.028 | 7.955 | 7.590 | 3.623–3.682 (multiple splitting peaks) |
3.3. Analysis of fluorescence quenching
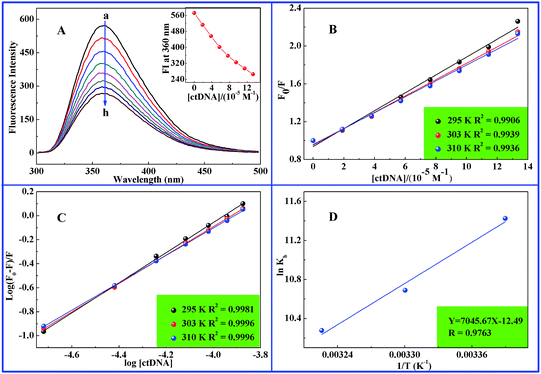
Fluorescence titration experiment was used to study relative binding of ABT-888 to ctDNA. Fluorescence signal was not observed for the sample with ctDNA alone in the buffer solution. However, ABT-888 exhibited strong fluorescence emission peak at 360 nm with excitation wavelength at 271 nm. In the present study, ABT-888 and ctDNA interaction was investigated by gradually adding ctDNA to ABT-888 solution (5.0 μM). Fig. 3A shows the remarkable decreasing trend of emission intensity of ABT-888 at 360 nm with increasing concentrations of ctDNA. Quenching rate was 53.5%, and there was a slight blue shift (2 nm) at the maximum wavelength of ABT-888 fluorescence emission when the solution of ctDNA was added. Sameena and Enoch27 suggested that such a blue lift showed the increase in the hydrophobicity around the macromolecule due to the formation of new non-fluorescent complex between small molecule and macromolecule. Therefore, the results indicated that ctDNA could quench the intrinsic fluorescence of ABT-888, and that binding of this compound to ctDNA indeed exists. Results further support the findings of UV absorption and 1H NMR.Different quenching mechanisms are usually classified as dynamic or static quenching, and the two can be distinguished by analyzing fluorescence data at different temperatures. Decrease in fluorescence intensity is described by the Stern–Volmer equation:36,37
| F0/F = 1 + KSV[Q] | (2) |
Table 2 provides the KSV obtained using the Stern–Volmer equation. By analyzing results of KSV values, dynamic or static quenching were differentiated. Dynamic quenching depends upon diffusion. Since the higher temperature leads to the larger diffusion coefficients, the KSV increases with rising the temperature. In contrast, increased temperature is likely to cause the decrease of complex stability, and thus lower values of the static quenching constants were resulted.20 Fig. 3B and Table 2 present the decreasing trend of KSV values with increasing temperature. Therefore, fluorescence quenching mechanism of ABT-888 by ctDNA may be controlled by static rather than dynamic quenching along with ctDNA–ABT-888 complex formation.
To further substantiate the quenching mechanism, fluorescence lifetime measurements were carried out on a single-photon counting setup given that lifetime would be unaffected in ground-state quenching but would decrease in the excited-state type.38 Time-resolved fluorescence decay of ABT-888 was ascertained in the absence and presence of various concentrations of ctDNA (Fig. 4). All time-resolved fluorescence data were analyzed by bi-exponential iterative fittings. Fitting parameters are listed in Table 3. Goodness of fit was evaluated from reduced chi-square (χ2) values, and in general, χ2 < 1.3 is acceptable. Mean fluorescence lifetimes (τavg) were calculated from the decay times (τ1, τ2) and normalized pre-exponential factors (α1, α2) using the following equation:39
| τavg = α1τ1 + α2τ2 | (3) |
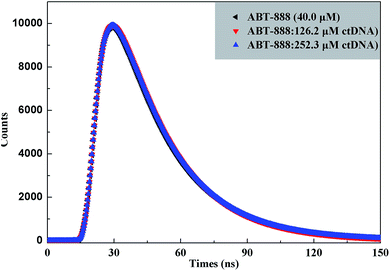 | ||
| Fig. 4 Time-resolved fluorescence decay of ctDNA–ABT-888 systems in the absence and presence of various concentrations of ctDNA. | ||
| Sample | τ1 | τ2 | α1 | α2 | τavg | χ2 |
|---|---|---|---|---|---|---|
| ABT-888 (40.0 μM) | 0.5095 | 2.4677 | 0.0665 | 0.9335 | 2.3375 | 1.0598 |
| ABT-888 + ctDNA (126.2 μM) | 0.5922 | 2.4799 | 0.0660 | 0.9340 | 2.3553 | 1.1574 |
| ABT-888 + ctDNA (252.3 μM) | 0.5041 | 2.4838 | 0.0573 | 0.9427 | 2.3703 | 1.1897 |
As mentioned in Table 3, χ2 < 1.3 indicates acceptable quality of exponential fits. ABT-888 exhibits bi-exponential fluorescence decay in buffer solution with the lifetime of 2.3375 ns. With gradually increasing ctDNA concentrations, the lifetime value increases to 2.3703 ns. The result shows that a short lifetime increment of ∼33 ps appeared in the decay profile. Thus the τavg, estimated from the lifetime decay measurements, almost does not change in the presence of increasing ctDNA concentrations. The results are practically the same as the steady-state fluorescence data that the quenching is mainly static quenching mechanism. Hence, both steady-state fluorescence and time-resolved fluorescence decay measurements confirmed that static type fluorescence quenching was caused mainly by ground-state complex formation.
3.4. Determination of binding constants and number of binding sites
From variations in intrinsic fluorescence of small molecules in the presence of ctDNA, binding constant (Kb) between small molecules and ctDNA can be possibly calculated.19,20 Thus, binding constant (Kb) and a number of binding sites (n) in ABT-888 and ctDNA were determined from the above fluorimetric titration. Parameters were calculated using the following equation:40,41
log(F0 − F)/F = log![[thin space (1/6-em)]](https://www.rsc.org/images/entities/char_2009.gif) Kb + n Kb + n![[thin space (1/6-em)]](https://www.rsc.org/images/entities/char_2009.gif) log[Q] log[Q]
| (4) |
3.5. Determination of thermodynamic parameters
Thermodynamic analysis is normally used to determine the essence of interaction between small molecules and biomolecules. Interaction forces between small molecules and biomolecules may involve van der Waals interactions, hydrophobic forces, hydrogen bonds, electrostatic interactions, etc.25,40 To characterize the binding force involved in ABT-888 and ctDNA, thermodynamic parameters, such as enthalpy change (ΔH), entropy change (ΔS), and free energy change (ΔG) of the interaction, were determined using the following equations:41
ln![[thin space (1/6-em)]](https://www.rsc.org/images/entities/char_2009.gif) Kb = −ΔH/RT + ΔS/R Kb = −ΔH/RT + ΔS/R
| (5) |
| ΔG = ΔH − TΔS | (6) |
![[thin space (1/6-em)]](https://www.rsc.org/images/entities/char_2009.gif) Kb versus 1/T, and ΔG values were estimated from eqn (6) at corresponding temperatures (Fig. 3D). ΔH was −14.00 kcal mol−1, and ΔS was −24.80 cal mol−1 K−1 (Table 2), indicating that hydrogen bond and van der Waals play major roles in ABT-888-to-ctDNA binding. Per the rules summarized by Ross and Subramanian,44 negative values of ΔH and ΔG revealed that the interaction was spontaneous and predominantly enthalpically-driven reaction.
Kb versus 1/T, and ΔG values were estimated from eqn (6) at corresponding temperatures (Fig. 3D). ΔH was −14.00 kcal mol−1, and ΔS was −24.80 cal mol−1 K−1 (Table 2), indicating that hydrogen bond and van der Waals play major roles in ABT-888-to-ctDNA binding. Per the rules summarized by Ross and Subramanian,44 negative values of ΔH and ΔG revealed that the interaction was spontaneous and predominantly enthalpically-driven reaction.
3.6. Competitive displacement assay
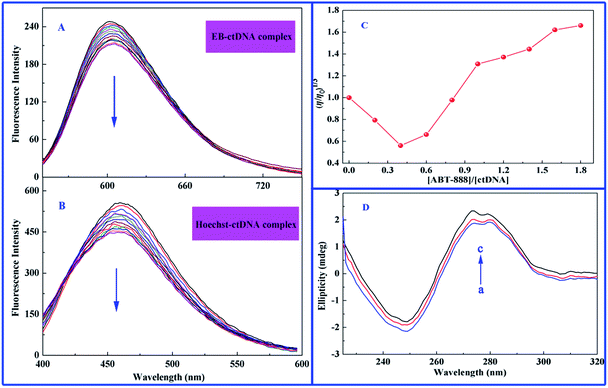
To corroborate the interacting mode, competition binding experiments were carried out using two well-known DNA binding dyes, EB and Hoechst 33258. Dye-competition-binding study can confirm whether this dye and an unknown drug compete for the same binding locus on the DNA. EB is a classic intercalating dye that can produce bright, intense fluorescence when it binds to DNA.45,46 Changes observed in the fluorescence intensities of the ctDNA–EB complex are associated with quenching of its luminescence. Such events may indicate displacement of intercalating EB and efficient interaction of the studied compound with the DNA helix. Hoechst 33258 binds strongly to the minor groove of double-stranded B-DNA with specificity for A–T rich sequence.47 Addition of excess unknown drug in solution containing Hoechst 33258 and DNA reduces fluorescence intensity of Hoechst 33258–DNA complex when the drug also binds to the groove region.In this study, EB was first selected as fluorescence probe to explore the binding mode between ABT-888 and ctDNA, and molar ratio ([ctDNA]/[EB]) of 14.5 was used as basis for EB fluorescence intensity, which did not further increase upon sequential addition of DNA to EB solution. Fig. 5A displays the effect of increasing concentration of ABT-888 on fluorescence spectra of EB–ctDNA complex. Apparently, fluorescence intensity of EB–ctDNA complex at 601 nm remarkably decreased with increasing concentrations of ABT-888 until measurements reached 1.8 × 10⁻⁴ M. Such result suggests that ABT-888 could interact with DNA through a similar intercalative mode and was able to replace the intercalation-bound EB dye from double-stranded DNA. Under the same molar ratio of dye–ctDNA (14.5), Hoechst 33258 competition displacement assay was also conducted. Upon subsequent addition of ABT-888, maximum emission wavelength (464 nm) significantly decreased in the Hoechst–ctDNA system (Fig. 5B), suggesting that some Hoechst 33258 molecules were released from Hoechst 33258–ctDNA after an exchange with ABT-888. Results indicate that groove binding is also an interaction mode between ABT-888 and ctDNA. Thus, ABT-888 is not a simple intercalator or groove binder. Instead, ABT-888 and ctDNA bind with each other through a mixed type or partial intercalated mode of DNA binding.
3.7. Viscosity measurements
Viscosity measurement is a hydrodynamic method of determining the binding mode of drugs with DNA.48 A classical intercalation binding requires separation of adjacent base pairs to accommodate binding drug molecules into the double helix of DNA, leading to an increased contour length of DNA and DNA viscosity.32 By contrast, a drug molecule that interacts with DNA by groove binding or electrostatic interaction does not change the relative viscosity of DNA, because molecules do not alter the axial length of DNA upon binding.31,32 In addition, a partial or non-classical intercalation of drug molecules could bend or kink DNA helix, resulting in decreased effective length of DNA molecule with concomitant decrease in its viscosity. Fig. 5C shows the relative viscosity (η/η0)1/3 versus ABT-888-concentration-to-ctDNA mole ratios (ri = [ABT-888]/[ctDNA]). At lower ri values, relative viscosity showed a decreasing trend, which then increased at higher mole ratios up to the initial viscosity. We then conclude that at low amounts of ABT-888, drugs bind to ctDNA by partial intercalation mode, whereas at higher drug concentrations, intercalation of ABT-888 into the adjacent base pairs of ctDNA increases the effective length of DNA.3.8. CD study
CD titration is one of the most direct means of examining the binding modes of drug molecules to DNA. Within visible range, a majority of drug molecules do not show any ellipticity in CD spectra. However, right-hand B form of DNA produced a characteristic spectrum with a positive band at 275 nm because of base-stacking and a negative band at 245 nm because of polynucleotide helicity.49 Simple groove-binding and electrostatic interaction of drug molecules with DNA show little or no perturbations on base stacking and helicity bands, whereas intercalation changes the intensities of both bands, stabilizing the right-handed B conformation of DNA.50 As shown in Fig. 5D, upon addition of ABT-888 to ctDNA, characteristic CD spectrum of ctDNA undergoes changes in both bands. Moreover, ABT-888 increase moderately intensities of the positive band at 275 nm and decrease moderately that of the negative band at 245 nm. However, interestingly, ABT-888 did not affect the peak shapes of ctDNA. Observation of increased CD signals at 275 nm is an important evidence of interaction of ABT-888 with the base pairs, resulting in the conformational changes in ctDNA.50 Possibly, different changes in both bands resulted from binding of ABT-888 with ctDNA via mixed binding or partial intercalation mode; such result is consistent with conclusions of above competition experiments.3.9. FT-IR studies
FT-IR spectroscopy has emerged as an efficient tool for characterization of drug–biomolecules interaction and for identification of biomolecule conformations.17 Earlier experiments demonstrated that infrared spectra of DNA consist primarily of three principal regions.51 The first region (∼1750–1600 cm−1) contains absorption bands assigned to ring stretching vibrations of nitrogenous bases (C![[double bond, length as m-dash]](https://www.rsc.org/images/entities/char_e001.gif) O, C
O, C![[double bond, length as m-dash]](https://www.rsc.org/images/entities/char_e001.gif) N, C
N, C![[double bond, length as m-dash]](https://www.rsc.org/images/entities/char_e001.gif) C) and bending vibrations of exocyclic NH2 in the DNA duplex.52 The second region (∼1600–1500 cm−1) results primarily from purine and pyrimidine ring vibrations. The last region (∼950–1250 cm−1) is mostly due to stretching vibrations of symmetric and asymmetric PO2 groups in the phosphodiester–deoxyribose backbone.53 Specifically, vibrational bands of free DNA at 1710, 1663, 1608, and 1491 cm−1 were assigned to guanine, thymine, adenine, and cytosine nitrogenous base, respectively.17,33
C) and bending vibrations of exocyclic NH2 in the DNA duplex.52 The second region (∼1600–1500 cm−1) results primarily from purine and pyrimidine ring vibrations. The last region (∼950–1250 cm−1) is mostly due to stretching vibrations of symmetric and asymmetric PO2 groups in the phosphodiester–deoxyribose backbone.53 Specifically, vibrational bands of free DNA at 1710, 1663, 1608, and 1491 cm−1 were assigned to guanine, thymine, adenine, and cytosine nitrogenous base, respectively.17,33
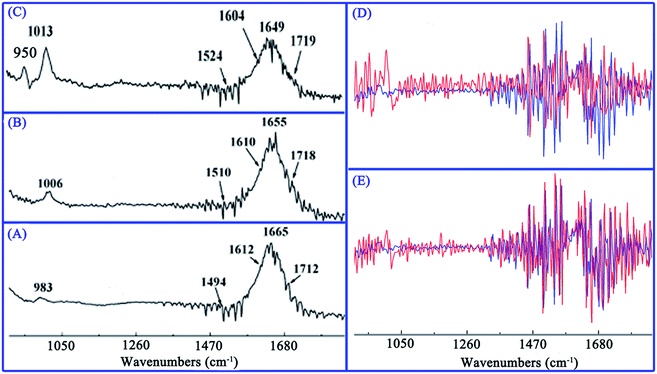
In this study, diverse IR spectra were obtained by addition of different amounts of ABT-888 to ctDNA solution, as evident in Fig. 6A–C. A discernible shift in G band from 1712 to 1718 and 1719 cm−1 were observed with increasing ABT-888 concentration, suggesting that ABT-888 interacted with the G base of ctDNA. Similarly, major shifting of the T band from 1665 to 1655 and 1649 cm−1 was observed, suggesting that ABT-888 probably interacted with O-2 atoms of T base.30 A (1612 cm−1) and C bands (1494 cm−1) also showed obvious shifts, which correspond respectively to NH2 scissoring and N–H bending changes in purine and pyrimidine ring.29 Major shifts in IR bands specify ABT-888 intercalation between A/T and G/C base pairs. The band at 983 cm−1 also shifted to 1006 and 1013 cm−1, and a new absorption band appeared at 950 cm−1, indicating that phosphate backbone was weak influenced by ABT-888 interaction with ctDNA. In view of free ctDNA and its complexes spectra, these changes are clearer in the first derivative spectrum (Fig. 6D and E). These feature changes imply that ABT-888 induces local conformational changes in ctDNA to accommodate molecules between base pairs. Result was consistent with that suggested by above CD spectra.
3.10. Molecular docking analysis
Molecular docking is an accepted method in search of therapeutic agents designed to interact with a specific biomolecule. Especially in studies of binding of small molecules to DNA, docking underwent substantial development in the last few years. The method allows for virtual screening on large libraries of compounds, ranking of results, and proposing structural hypotheses on how small molecules bind to DNA.19,20,54 Molecular docking calculations were performed using AutoDock strategy to search the entire DNA surface for binding locus while simultaneously optimizing conformation of base pairs. Geometry-optimized ABT-888 molecule was successfully docked onto DNA segments. A total of 11 multimember conformational clusters were gathered from 200 docking runs, in which case the highest populated cluster contained almost half of the obtained conformationals and was lowest on energy scale. Table 4 displays binding free energies [kcal mol−1] and remarks for the top five conformationals in this highest cluster. Data analysis showed that interaction is basically non-covalent interaction, that is, van der Waals and electrostatic interactions exist between ABT-888 and DNA. Interactions may be either through phosphate backbone atoms of DNA or via the DNA bases.| Sub rank | Binding energy (kcal mol−1) | Electrostatic energy (kcal mol−1) | van der Waals | Inhibition constant (nmol) | Number of H-bonds | Cluster rmsd | Reference rmsd |
|---|---|---|---|---|---|---|---|
| 1 | −9.38 | −1.39 | −8.58 | 132.71 | 3 | 0 | 25.89 |
| 2 | −9.38 | −1.36 | −8.62 | 132.77 | 2 | 1.18 | 25.54 |
| 3 | −9.38 | −1.39 | −8.59 | 133.04 | 2 | 0.04 | 25.91 |
| 4 | −9.38 | −1.39 | −8.59 | 133.15 | 2 | 0.05 | 25.90 |
| 5 | −9.38 | −1.40 | −8.58 | 133.16 | 2 | 0.04 | 25.90 |
Optimum binding conformation between ABT-888 and DNA with the lowest binding energy of −9.38 kcal mol−1 was selected for discussion and shown in Fig. 7. As shown in Fig. 7, it was obvious that the benzimidazolyl moiety of ABT-888 bound into the base pairs of DNA by parallel way, while the pyrrolidyl moiety was perpendicular to the base pairs. And the hydrogen atoms (a, b, c) of the benzimidazolyl moiety located inside, which shows that the benzimidazolyl moiety is closer to the inside of DNA duplex. The result was coincided with the deduction of 1H NMR study. Fig. 7 also shows that ABT-888 binds mainly to minor grooves in A–T base pairs region of DNA. ABT-888 bends base pairs by intermolecular hydrogen bonds, namely, the ABT-888 three N–H groups, which forms three hydrogen bonds with DT7, DA17 and DT20, respectively. The O-2 oxygen of DT7 is at a distance of 2.13 Å from the NH2 amide H atom of ABT-888. Similarly, O-3 oxygen of DT17 is 1.95 Å from the NH imidazole H atom of ABT-888, and O-3 oxygen of DT20 with the NH pyrrole H atom is 1.96 Å. Based on above analysis, groove binding interaction may be play a major role in binding of ABT-888 to DNA, whereas other binding types, including classic intercalation and partial intercalation, cannot be ruled out. Thus, molecular docking studies shed light on binding modes between ABT-888 and DNA and complement experimental observations.
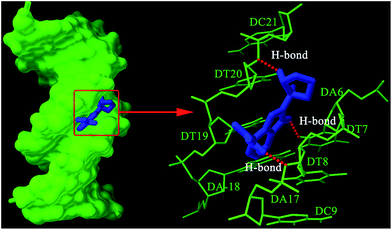 | ||
| Fig. 7 Molecule docked poses of ABT-888 with DNA (left) and hydrogen bonds (red dotted lines) between ABT-888 and bases (right). | ||
4. Conclusions
The present study attempted to analyze binding properties of ABT-888 to ctDNA. From these multispectroscopic experiments and molecular docking studies, results showed that mixed-ligand type binding occurs between ABT-888 and DNA with a binding constant of 9.17 × 10⁴ M−1 at 295 K. Calculated thermodynamic parameters suggested that binding of ABT-888 to ctDNA is driven mainly by hydrogen bonds and van der Waals force. Competition fluorescence displacement experiments were studied using EB and Hoechst 33258 as probes for intercalation and minor groove binding modes, respectively, and these experiments indicated that ABT-888 can compete simultaneously for binding sites on ctDNA with the two probes. In viscometric titration, relative viscosity of ctDNA decreased and increased steadily at low and high ABT-888 concentration regions respectively, suggesting transition from predominantly partial intercalation to predominantly classic intercalation. Changes in CD and FT-IR spectra indicated that ABT-888 induces conformational transformation of ctDNA. Theoretical calculations applying AutoDock have been carried out, and calculational results can reasonably complement experimental findings when ABT-888 interacted with DNA by groove binding mode.Acknowledgements
This work was supported by the National Development and Reform Commission and Education of China (Grant No. 2014BW011) and the Large-scale Science Instrument Shareable Platform Construction of Sichuan Province (Grant No. 2015JCPT0005-15010102).References
- C. Jones and E. R. Plummer, Br. J. Radiol., 2008, 81, 2–5 CrossRef PubMed.
- Y. Drew and R. Plummer, Drug Resist. Updates, 2009, 12, 153–156 CrossRef CAS PubMed.
- L. Gatti and F. Zunino, in Chemosensitivity: Volume II: In vivo Models, Imaging, and Molecular Regulators, 2005, pp. 127–148 Search PubMed.
- P. Borst, S. Rottenberg and J. Jonkers, Cell Cycle, 2008, 7, 1353–1359 CrossRef CAS PubMed.
- J. R. Marchand, A. Carotti, D. Passeri, P. Filipponi, P. Liscio, E. Camaioni, R. Pellicciari, A. Gioiello and A. Macchiarulo, Biochim. Biophys. Acta, Proteins Proteomics, 2014, 1844, 1765–1772 CrossRef CAS PubMed.
- B. Basu, S. K. Sandhu and J. S. de Bono, Drugs, 2012, 72, 1579–1590 CrossRef CAS PubMed.
- M. Rouleau, A. Patel, M. J. Hendzel, S. H. Kaufmann and G. G. Poirier, Nat. Rev. Cancer, 2010, 10, 293–301 CrossRef CAS PubMed.
- L. M. Wagner, OncoTargets Ther., 2015, 8, 1931–1939 CrossRef PubMed.
- H. Farmer, N. Mccabe, C. J. Lord, A. N. Tutt, D. A. Johnson, T. B. Richardson, M. Santarosa, K. J. Dillon, I. Hickson and C. Knights, Nature, 2005, 434, 917–921 CrossRef CAS PubMed.
- L. Virág and C. Szabó, Pharmacol. Rev., 2002, 54, 375–429 CrossRef.
- S. Bogliolo, C. Cassani, M. Dominoni, V. Musacchi, P. L. Venturini, A. Spinillo, S. Ferrero and B. Gardella, Expert Opin. Invest. Drugs, 2016, 25, 367–374 CrossRef CAS PubMed.
- T. Penning, G. Zhu, V. Gandhi, J. Gong, X. Liu, Y. Shi, V. Klinghofer, E. Johnson, C. Donawho and D. Frost, J. Med. Chem., 2009, 52, 514–523 CrossRef CAS PubMed.
- X. Li, J. Delzer, R. Voorman, S. M. de Morais and Y. Lao, Drug Metab. Dispos., 2011, 39, 1161–1169 CrossRef CAS PubMed.
- J. P. Palma, Y. C. Wang, L. E. Rodriguez, D. Montgomery, P. A. Ellis, G. Bukofzer, A. Niquette, X. Liu, Y. Shi and L. Lasko, Clin. Cancer Res., 2009, 15, 7277–7290 CrossRef CAS PubMed.
- D. Sarkar, P. Das, S. Basak and N. Chattopadhyay, J. Phys. Chem. B, 2008, 112, 9243–9249 CrossRef CAS PubMed.
- D. Sahoo, P. Bhattacharya and S. Chakravorti, J. Phys. Chem. B, 2010, 114, 2044–2050 CrossRef CAS PubMed.
- P. Ghosh, G. P. Devi, R. Priya, A. Amrita, A. Sivaramakrishna, S. Babu and R. Siva, Appl. Biochem. Biotechnol., 2013, 170, 1127–1137 CrossRef CAS PubMed.
- D. K. Jangir, S. Kundu and R. Mehrotra, PLoS One, 2013, 8, 69933 Search PubMed.
- S. U. Rehman, T. Sarwar, H. M. Ishqi, M. A. Husain, Z. Hasan and M. Tabish, Arch. Biochem. Biophys., 2015, 566, 7–14 CrossRef CAS PubMed.
- I. Ahmad, A. Ahmad and M. Ahmad, Phys. Chem. Chem. Phys., 2016, 18, 6476–6485 RSC.
- J. Liu, Y. Yue, J. Wang, X. Yan, R. Liu, Y. Sun and X. Li, Spectrochim. Acta, Part A, 2015, 145, 473–481 CrossRef CAS PubMed.
- D. Wu, J. Yan, J. Wang, Q. Wang and H. Li, Food Chem., 2015, 170, 423–429 CrossRef CAS PubMed.
- D. Pastré, O. Piétrement, A. Zozime and E. L. Cam, Biopolymers, 2005, 77, 53–62 CrossRef PubMed.
- Y. Yue, Y. Sun, X. Yan, J. Liu, S. Zhao and J. Zhang, Chemosphere, 2016, 161, 475–481 CrossRef CAS PubMed.
- Y. Yue, J. Liu, R. Liu, Y. Sun, X. Li and J. Fan, Food Chem. Toxicol., 2014, 71, 244–253 CrossRef CAS PubMed.
- S. Yousuf, D. Radhika, I. V. M. V. Enoch and M. Easwaran, Spectrochim. Acta, Part A, 2012, 98, 405–412 CrossRef CAS PubMed.
- Y. Sameena and I. V. Enoch, J. Lumin., 2013, 138, 105–116 CrossRef CAS.
- S. Yousuf, R. Alex, P. M. Selvakumar, I. V. Enoch, P. S. Subramanian and Y. Sun, ChemistryOpen, 2015, 4, 497–508 CrossRef CAS PubMed.
- L. Han, Y. Zhou, X. Huang, M. Xiao, L. Zhou, J. Zhou, A. Wang and J. Shen, Spectrochim. Acta, Part A, 2014, 123, 497–502 CrossRef CAS PubMed.
- L. Wang, G. Zhang, J. Pan, C. Xiong and D. Gong, J. Photochem. Photobiol., B, 2014, 141, 253–261 CrossRef CAS PubMed.
- S. U. Rehman, T. Sarwar, M. A. Husain, H. M. Ishqi and M. Tabish, Arch. Biochem. Biophys., 2015, 576, 49–60 CrossRef PubMed.
- Y. Zhang, G. Zhang, F. Peng, Y. Ma and J. Zhou, Spectrochim. Acta, Part A, 2012, 96, 1012–1019 CrossRef CAS PubMed.
- A. Anantharaman, R. R. Priya, H. Hemachandran, A. Sivaramakrishna, S. Babu and R. Siva, Spectrochim. Acta, Part A, 2015, 144, 163–169 CrossRef CAS PubMed.
- W. Zhong, J. S. Yu, Y. Liang, K. Fan and L. Lai, Spectrochim. Acta, Part A, 2004, 60, 2985–2992 CrossRef PubMed.
- H. Guo, C. Cai, H. Gong and X. Chen, Spectrochim. Acta, Part A, 2011, 79, 92–96 CrossRef CAS PubMed.
- X. Li and S. Wang, New J. Chem., 2015, 39, 386–395 RSC.
- Y. Yue, Y. Sun, Q. Dong, R. Liu, X. Yan, Y. Zhang and J. Liu, Luminescence, 2016, 31, 671–681 CrossRef CAS PubMed.
- P. Mandal, M. Bardhan and T. Ganguly, J. Photochem. Photobiol., B, 2010, 99, 78–86 CrossRef CAS PubMed.
- S. Ghosh, P. Kundu and N. Chattopadhyay, J. Photochem. Photobiol., B, 2016, 154, 118–125 CrossRef CAS PubMed.
- Y. Yue, Q. Dong, Y. Zhang, X. Li, X. Yan, Y. Sun and J. Liu, Spectrochim. Acta, Part A, 2016, 153, 688–703 CrossRef CAS PubMed.
- Y. Yue, J. Liu, R. Liu, Q. Dong and J. Fan, Spectrochim. Acta, Part A, 2014, 124, 46–51 CrossRef CAS PubMed.
- Y. Cao and X.-W. He, Spectrochim. Acta, Part A, 1998, 54, 883–892 CrossRef.
- R. Vijayabharathi, P. Sathyadevi, P. Krishnamoorthy, D. Senthilraja, P. Brunthadevi, S. Sathyabama and V. B. Priyadarisini, Spectrochim. Acta, Part A, 2012, 89, 294–300 CrossRef CAS PubMed.
- P. D. Ross and S. Subramanian, Biochemistry, 1981, 20, 3096–3102 CrossRef CAS PubMed.
- Y. Song, J. Kang, J. Zhou, Z. Wang, X. Lu, L. Wang and J. Gao, Spectrochim. Acta, Part A, 2000, 56, 2491–2497 CrossRef.
- M. B. Lyles and I. L. Cameron, Biophys. Chem., 2002, 96, 53–76 CrossRef CAS PubMed.
- M. M. Ramana, R. Betkar, A. Nimkar, P. Ranade, B. Mundhe and S. Pardeshi, Spectrochim. Acta, Part A, 2016, 152, 165–171 CrossRef CAS PubMed.
- S. U. Rehman, T. Sarwar, M. A. Husain, H. M. Ishqi and M. Tabish, Arch. Biochem. Biophys., 2015, 576, 49–60 CrossRef PubMed.
- M. Tao, G. Zhang, J. Pan and C. Xiong, Spectrochim. Acta, Part A, 2016, 155, 28–37 CrossRef CAS PubMed.
- J. Kang, X. Wang and S. Dong, Toxicol. Mech. Methods, 2006, 16, 515–523 CrossRef CAS PubMed.
- S. H. Brewer, S. J. Anthireya, S. E. lappi, D. L. Drapcho and S. Franzen, Langmuir, 2002, 18, 4460–4464 CrossRef CAS.
- C. Le-Tien, R. Lafortune, F. Shareck and M. Lacroix, Talanta, 2007, 71, 1969–1975 CrossRef CAS PubMed.
- B. Zhousun, J. Liquier, E. Taillandier, J. Sun, T. Garestier, C. Hélène and S. M. Gryaznov, Nucleic Acids Res., 1997, 25, 1782–1787 CrossRef CAS.
- A. Bykowska, R. Starosta, J. Jezierska and M. Jeżowskabojczuk, RSC Adv., 2015, 5, 80804–80815 RSC.
| This journal is © The Royal Society of Chemistry 2017 |

