 Open Access Article
Creative Commons Attribution 3.0 Unported Licence
Preparation of nano-sized titanium carbide particles via a vacuum carbothermal reduction approach coupled with purification under hydrogen/argon mixed gas
Zhen Xie†
a,
Yi Deng† a,
Yuanyi Yangc,
Hua Sub,
Dali Zhoua,
Can Liua and
Weizhong Yang*a
aSchool of Materials Science and Engineering, School of Chemical Engineering, Sichuan University, Chengdu, 610065, China. E-mail: scuywz@139.com
bKTL Carbide Co., Ltd., Chengdu, 610037, China
cDepartment of Materials Engineering, Sichuan College of Architectural Technology, Deyang 618000, China
First published on 30th January 2017
Abstract
In the present work, nano-sized titanium carbide (TiC) particles were successfully synthesized through a process of producing carbon coated titanium precursors, heating these precursors under vacuum conditions at 1450 °C for 2 h, and treating the products in hydrogen/argon (1![[thin space (1/6-em)]](https://www.rsc.org/images/entities/char_2009.gif) :
:![[thin space (1/6-em)]](https://www.rsc.org/images/entities/char_2009.gif) 1) mixed gas or hydrogen gas. The effects of carbon content, pressure and temperature of removing excess carbon on the TiC products were examined by using XRD, SEM, TEM and DTA-TG analysis. Experimental results demonstrated that TiC powders with a single phase were obtained when the molar ratio of Ti to C ranged from 1
1) mixed gas or hydrogen gas. The effects of carbon content, pressure and temperature of removing excess carbon on the TiC products were examined by using XRD, SEM, TEM and DTA-TG analysis. Experimental results demonstrated that TiC powders with a single phase were obtained when the molar ratio of Ti to C ranged from 1![[thin space (1/6-em)]](https://www.rsc.org/images/entities/char_2009.gif) :
:![[thin space (1/6-em)]](https://www.rsc.org/images/entities/char_2009.gif) 2 to 1
2 to 1![[thin space (1/6-em)]](https://www.rsc.org/images/entities/char_2009.gif) :
:![[thin space (1/6-em)]](https://www.rsc.org/images/entities/char_2009.gif) 4. With changing the molar ratio of Ti/C in the precursors, the particle size of the synthetized TiC powders varied from 30 to 200 nm. After treatment in the hydrogen/argon mixed gas at 830 °C for 3 h, the TiC product accounted for a high TiC purity of 99.36% and possessed a small grain size of about 20 nm. The vacuum calcination method coupled with the hydrogen/argon mixed gas process applied in this work would be an efficient way to obtain nano-sized and purified TiC particles, which hold great promising for industrial purposes.
4. With changing the molar ratio of Ti/C in the precursors, the particle size of the synthetized TiC powders varied from 30 to 200 nm. After treatment in the hydrogen/argon mixed gas at 830 °C for 3 h, the TiC product accounted for a high TiC purity of 99.36% and possessed a small grain size of about 20 nm. The vacuum calcination method coupled with the hydrogen/argon mixed gas process applied in this work would be an efficient way to obtain nano-sized and purified TiC particles, which hold great promising for industrial purposes.
1. Introduction
As one of the promising transition metal carbides, titanium carbide (TiC) has a particular importance in key high technologies from mechanical to chemical and microelectronic fields, due to its high melting temperature (3067 °C), high Vickers hardness (29–34 GPa), good electrical conductivity (3 × 10⁷ Ω cm−1), relatively low density (4.91 g cm−3), good thermal conductivity and high thermal shock resistance, as well as high abrasion resistance.1–6 Titanium carbide powders are often used for manufacturing cutting tools, aerospace materials, grinding wheels, abrasive-resistant materials, polishing paste, and magnetic recording heads, as well as crucibles for smelting metals.7–10 In cermets, titanium carbide can substitute for another transition metal carbide, tungsten carbide (WC), because of their similar properties such as high hardness and high resistance to corrosion. The most important benefit can be attributed to the fact that titanium carbide needs a cheaper binder nickel (Ni) in comparison with cobalt (Co), which is required in WC based cemented carbide.11 Recent years, titanium carbide begins to work as a catalyst support, which could promote catalytic activity through synergistic effects, and it also plays a catalytic role in electroanalytical processes, which displays fast electron transfer in particular quinine system.12–14 For example, Leerang Yang15 reported that a monolayer of platinum (Pt) on titanium carbide thin film exhibited similar hydrogen evolution reaction (HER) activity as bulk Pt, which was attributed to similar hydrogen binding energies between Pt/TiC and Pt from density functional theory (DFT) calculations. Qizhi Dong et al.16 generated a PDDA functionalized TiC as a catalyst support for Pd catalyzed electrochemical reaction. Their results indicated that Pd/TiC(P) catalyst owned the better resistance to carbon monoxide (CO) poisoning, catalytic activity and stability towards formic acid electrooxidation compared with Pt/TiC and Pd/C. For all those applications, developing a more efficient and inexpensive process for generation of titanium carbide with a narrow distribution of particle size and ultrafine particles as well as loose agglomeration to expend application of this advanced material is of great importance.Titanium carbide is commercially produced from the reduction of titania by carbon in a temperature range between 1700 °C and 2100 °C.17–20 Besides, a wide variety of preparation approaches were reported to synthesize titanium carbide powders. For instance, pure TiC could be prepared at 1200 °C through microwave carbothermal reduction methods.21 Kun Zhao et al. produced nano-sized TiC from molten NaCl–KCl.22 In addition, Zhypargul Abdullaeva and his co-workers23 fabricated TiC@C core–shell nanoparticles through pulsed plasma in liquid, and powder immersion reaction assisted by coating method was employed by Xiaowei Yin.24
Among those synthesis methods, carbothermal reduction method may be the most commonly used process to produce TiC.25,26 However, after this procedure some undesirable phases may be included in the final products. Conventionally free carbon is the most frequent phenomena, and it would make difficulty to apply the obtained TiC in engineering and industrial areas. In the field of titanium carbide cermet, free carbon significantly influences the microstructure and mechanical properties (transverse rupture strength, fracture toughness and hardness) of the TiC cemented carbide.27 Therefore, researchers devoted to cleaning free carbon via various strategies, such as oxidation,28,29 melting process with calcium,30 and hydrogen treatment.31,32 Nevertheless, the effect of cleaning was not as good as expected. The TiC products could be oxidized as well, and some new impurities were introduced into the system, so the after-treated TiC could not be used directly.
Hence, in the current work, we first employed sol–gel method to obtain precursors which included metal alkoxide and polymeric carbon for the formation of TiC nanoparticles with high homogeneity at a molecular scale.33 In addition, the vacuum heat-treatment procedure was carried out to form TiC using a lower carbon content at a relatively low temperature. After treated in the vacuum furnace, a post-processing in hydrogen/argon (1![[thin space (1/6-em)]](https://www.rsc.org/images/entities/char_2009.gif) :
:![[thin space (1/6-em)]](https://www.rsc.org/images/entities/char_2009.gif) 1) mixture and hydrogen gas atmosphere was followed to achieve considerably high TiC amount. Furthermore, the effects of carbon content, pressure and temperature for removing of excess carbon on the TiC nanoparticles were studied. Our work provides a facile and rapid approach for purification of titanium carbide as well as other transition metal carbides (TMCs), which would be used for industrial and technological applications.
1) mixture and hydrogen gas atmosphere was followed to achieve considerably high TiC amount. Furthermore, the effects of carbon content, pressure and temperature for removing of excess carbon on the TiC nanoparticles were studied. Our work provides a facile and rapid approach for purification of titanium carbide as well as other transition metal carbides (TMCs), which would be used for industrial and technological applications.
2. Experimental
2.1. Materials
Tetrabutyl titanate (C16H36O4Ti, ≥98.5%), ethanol (CH3CH2OH, ≥99.7%), acetic acid (CH3COOH, ≥99.5%), nitric acid (HNO3, 65–68%) were purchased from Chengdu Kelong Reagent Co., Ltd. (China). The phenol-formaldehyde resin was of industrial grade and its carbon yield was about 58% identified from TG result. All the other chemicals were of analytical reagent grade and were used as received without further purification. All aqueous solutions were prepared with de-ionized water (D.I. water).2.2. Preparation of titanium carbide
Carbon coated precursors were firstly synthesized through a sol–gel method. The titanium dioxide (TiO2) sol was prepared using tetrabutyl titanate, ethanol, acetic acid and D.I. water with the assumed molar ratios of C16H36O4Ti![[thin space (1/6-em)]](https://www.rsc.org/images/entities/char_2009.gif) :
:![[thin space (1/6-em)]](https://www.rsc.org/images/entities/char_2009.gif) C2H5OH
C2H5OH![[thin space (1/6-em)]](https://www.rsc.org/images/entities/char_2009.gif) :CH3COOH
:CH3COOH![[thin space (1/6-em)]](https://www.rsc.org/images/entities/char_2009.gif) :
:![[thin space (1/6-em)]](https://www.rsc.org/images/entities/char_2009.gif) H2O = 1
H2O = 1![[thin space (1/6-em)]](https://www.rsc.org/images/entities/char_2009.gif) :
:![[thin space (1/6-em)]](https://www.rsc.org/images/entities/char_2009.gif) 20
20![[thin space (1/6-em)]](https://www.rsc.org/images/entities/char_2009.gif) :
:![[thin space (1/6-em)]](https://www.rsc.org/images/entities/char_2009.gif) 4
4![[thin space (1/6-em)]](https://www.rsc.org/images/entities/char_2009.gif) :
:![[thin space (1/6-em)]](https://www.rsc.org/images/entities/char_2009.gif) 6. Briefly, tetrabutyl titanate was dissolved in ethanol, and acetic acid was added into the solution dropwise with continuous stirring. Then a mixture of D.I. water and ethanol with the pH value of about 3 was dropped into the alkoxide solution. The pH value of the system was maintained in the range of 3–3.5 through adding nitric acid solution.
6. Briefly, tetrabutyl titanate was dissolved in ethanol, and acetic acid was added into the solution dropwise with continuous stirring. Then a mixture of D.I. water and ethanol with the pH value of about 3 was dropped into the alkoxide solution. The pH value of the system was maintained in the range of 3–3.5 through adding nitric acid solution.
Defined amount of phenol-formaldehyde resin as carbon source was dissolved in ethanol, and then introduced to the system according to the Ti/C molar ratio varying from 1![[thin space (1/6-em)]](https://www.rsc.org/images/entities/char_2009.gif) :
:![[thin space (1/6-em)]](https://www.rsc.org/images/entities/char_2009.gif) 1 to 1
1 to 1![[thin space (1/6-em)]](https://www.rsc.org/images/entities/char_2009.gif) :
:![[thin space (1/6-em)]](https://www.rsc.org/images/entities/char_2009.gif) 4. Eventually, the carbon-coated TiO2 sol solution formed. The gel precursors were obtained after aging at room temperature, followed by drying at 120 °C to a constant weight and grinding into powders.
4. Eventually, the carbon-coated TiO2 sol solution formed. The gel precursors were obtained after aging at room temperature, followed by drying at 120 °C to a constant weight and grinding into powders.
A vacuum condition was involved to calcinate the precursors. Approximately 3.0 g precursors powders were pressed into wafers (8 mm in length, 20 mm in diameter) under a uniaxial pressure of 15 MPa. Afterwards, the wafers were placed in graphite crucibles at the center of the graphite vacuum furnace. Keep these precursors reacted at 1450 °C for 2 h with a heating rate of 5 °C min−1. The pressure of the vacuum heating process was maintained at about 10 Pa. The specific condition of each sample was listed in Table 1.
| Sample name | Ti (mol) | C (mol) | Temperature (°C) | Holding time (h) |
|---|---|---|---|---|
| TiC-1 | 1 | 1 | 1450 | 2 |
| TiC-2 | 1 | 2 | 1450 | 2 |
| TiC-3 | 1 | 3 | 1450 | 2 |
| TiC-4 | 1 | 4 | 1450 | 2 |
2.3. Hydrogen treatment
Both pure hydrogen and hydrogen/argon (1![[thin space (1/6-em)]](https://www.rsc.org/images/entities/char_2009.gif) :
:![[thin space (1/6-em)]](https://www.rsc.org/images/entities/char_2009.gif) 1) process were employed to remove the excess carbon covered on the particle surfaces. The prepared powders were treated in flowing gas at various conditions for 3 h with heating rate of 5 °C min−1. After reaction, the samples were naturally cooled down to ambient temperature. The step-by-step procedures from carbon-coated precursors to purified TiC nanoparticles were displayed in Fig. 1.
1) process were employed to remove the excess carbon covered on the particle surfaces. The prepared powders were treated in flowing gas at various conditions for 3 h with heating rate of 5 °C min−1. After reaction, the samples were naturally cooled down to ambient temperature. The step-by-step procedures from carbon-coated precursors to purified TiC nanoparticles were displayed in Fig. 1.
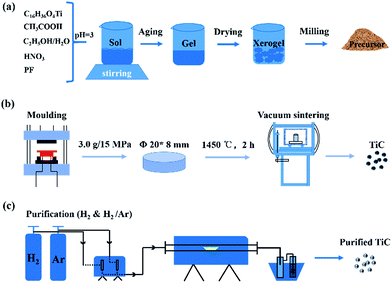 | ||
| Fig. 1 Schematic illustration for preparation and hydrogen treatment of TiC nanoparticles: (a) formation of carbon coated precursors (b) sintering and (c) purification of prepared TiC products. | ||
2.4. Characterization
Thermo gravimetric analysis (TGA, 209F1, NETZSCH, Germany) was used to examine the carbon yield of phenolic resin and the thermolysis process of the prepared TiC powders. Approximately 5 mg of the produced powders and phenolic resin were heated under air and argon, respectively, from 25 °C to 1000 °C with a heating rate of 10 °C min−1 with an empty Al2O3 crucible as a reference.X-ray diffraction (XRD, DX-1000X, Dandong Fangyuan, China) using a Cu target as radiation source (λ = 1.540598 Å) operated at 40 kV was carried out to analyze the phase composition of the produced powders. The diffraction angles (2θ) were set between 20° and 80° with a step size of 0.03° s−1.
The morphology of the samples was directly observed by field emission scanning electron microscopy (FE-SEM, S-4800, Hitachi, Japan). Samples for SEM imaging were fixed on the sample platform through the conductive tape.
Transmission electron microscopy (TEM, Tecnai G2 F20 S-Twin, FEI, USA) was used to observe morphology of the prepared particles and identify crystal plane by HR-TEM and selected area electron diffraction (SEAD) images. TEM images were prepared through placing a drop of the suspensions of TiC powders in ethanol onto the carbon-coated copper grids. SAED was also recorded using the same equipment.
3. Results and discussion
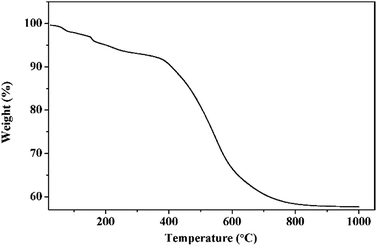
TG curve of phenolic resin was shown in Fig. 2. It was clear from the TG curve that there was a slight weight decrease from 200 °C to 400 °C, and then a dramatic drop followed between 400 °C and 700 °C. Above 700 °C, the weight gradually fell to a constant. The slight decrease of weight happened in low temperature could be ascribed to volatilization of small molecules including crystal water, carbon monoxide and carbon dioxide. While the sharp drop from 400 °C to 700 °C indicated that most phenolic resin decomposed into gaseous substance including oxy-carbides and hydrocarbons, and then they were taken away by the flowing argon. The constant of the TG curve meant that after pyrolyzation, the residual phenolic resin was a kind of solid carbon which could be used as the carbon source in present work. The carbon yield of phenolic resin was about 57.64%, a relative high carbon content.Then, TiC-3 precursor was selected as representation to illustrate its microstructure and composition through SEM, EDS and XRD analysis as shown in Fig. 3. The XRD patterns confirmed that the precursor contained amorphous carbon and titanium dioxide. Noncrystalline carbon had no characteristic peak in XRD patterns due to its amorphous state. The major intensive diffraction peaks observed at 2θ values of 25.28°, 37.80°, 48.05° and 62.69° were assigned to (101), (004), (200) and (204) planes of anatase TiO2 (JCPDS 21-1272), respectively. The peak at the 2θ value of 54.32° was ascribed to (211) facet of rutile TiO2 (JCPDS 21-1276). SEM image (Fig. 3b) of the precursor revealed the presence of uniform particles with diameter of several hundred of nanometers. The inserted EDS spectra indicated that the precursor was constituted of C, O and Ti elements. Another two peaks appeared at 2.12 keV and 9.71 keV corresponded to metal Au, which was distributed on the surface of precursor before SEM test. Therefore, the results of the crystal structure, morphology, and elemental composition analyses demonstrated that the precursor was composed of amorphous carbon and titanium dioxide.
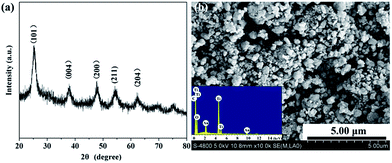 | ||
| Fig. 3 XRD patterns (a) and SEM image (b) of the precursor. The insert of (b) showed the EDS result. | ||
3.1. Phase characterization of titanium carbide powders
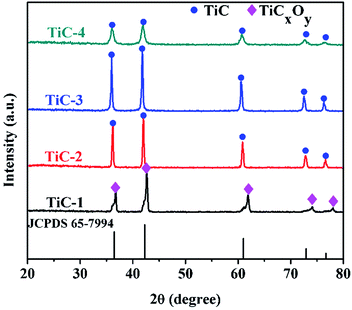
Fig. 4 displayed the XRD patterns of samples with various carbon contents heated at 1450 °C for 2 h in vacuum atmosphere. It was pronounced that pure titanium carbide formed when the molar ratio of Ti/C ranged from 1![[thin space (1/6-em)]](https://www.rsc.org/images/entities/char_2009.gif) :
:![[thin space (1/6-em)]](https://www.rsc.org/images/entities/char_2009.gif) 2 to 1
2 to 1![[thin space (1/6-em)]](https://www.rsc.org/images/entities/char_2009.gif) :
:![[thin space (1/6-em)]](https://www.rsc.org/images/entities/char_2009.gif) 4. When in the 1
4. When in the 1![[thin space (1/6-em)]](https://www.rsc.org/images/entities/char_2009.gif) :
:![[thin space (1/6-em)]](https://www.rsc.org/images/entities/char_2009.gif) 1 molar ratio case, the phase of final products was identified to be titanium oxycarbide (TiOxCy), which showed a slightly right shift compared with pure TiC. The preparation of titanium carbide based on the chemical reaction between C and TiO2, as shown by eqn (1).34 From the equation, it was clear that the 1
1 molar ratio case, the phase of final products was identified to be titanium oxycarbide (TiOxCy), which showed a slightly right shift compared with pure TiC. The preparation of titanium carbide based on the chemical reaction between C and TiO2, as shown by eqn (1).34 From the equation, it was clear that the 1![[thin space (1/6-em)]](https://www.rsc.org/images/entities/char_2009.gif) :
:![[thin space (1/6-em)]](https://www.rsc.org/images/entities/char_2009.gif) 3 molar ratio of Ti/C was needed to form one mole stoichiometric TiC. Therefore, the precursor with 1
3 molar ratio of Ti/C was needed to form one mole stoichiometric TiC. Therefore, the precursor with 1![[thin space (1/6-em)]](https://www.rsc.org/images/entities/char_2009.gif) :
:![[thin space (1/6-em)]](https://www.rsc.org/images/entities/char_2009.gif) 1 Ti/C without enough content of carbon made difficulties to obtain pure single-phase titanium carbide.
1 Ti/C without enough content of carbon made difficulties to obtain pure single-phase titanium carbide.| TiO2 + 3C = TiC + 2CO | (1) |
With the increase of carbon content, the reduction process proceeded and the C atoms substituted for O atoms gradually. When the Ti/C ratio dropped to 1![[thin space (1/6-em)]](https://www.rsc.org/images/entities/char_2009.gif) :
:![[thin space (1/6-em)]](https://www.rsc.org/images/entities/char_2009.gif) 2, pure titanium carbide appeared. As the content of carbon increased, the higher degree of crystallization of TiC emerged. In our work, the lower carbon content for the appearance of pure titanium carbide might be attributed to the compression moulding procedure. The produced reductive gas CO within the compressed precursor could not be taken away immediately, which played an important role as carbon source during the reduction process. Thus, vacuum calcination used here could reduce the use of carbon source compared with those carried out at an atmospheric pressure.19
2, pure titanium carbide appeared. As the content of carbon increased, the higher degree of crystallization of TiC emerged. In our work, the lower carbon content for the appearance of pure titanium carbide might be attributed to the compression moulding procedure. The produced reductive gas CO within the compressed precursor could not be taken away immediately, which played an important role as carbon source during the reduction process. Thus, vacuum calcination used here could reduce the use of carbon source compared with those carried out at an atmospheric pressure.19
The intensity of diffraction peaks for TiC-3 sample was higher compared with that of TiC-2 sample. It could be seen from the patterns that diffraction peaks of TiC-4 matched with the standard spectra of TiC (JCPDS 65-7994), indicating TiC is the predominant composition in TiC-4 sample. However, TiC-4 displays lower and broader diffraction peaks compared with the reference of standard spectra of TiC and other TiC groups (TiC-2 and TiC-3), suggesting some TiCxOy regions between the TiC crystallites. Besides, according to Scherrer formula,29 TiC-4 samples had the smallest particle size among these TiC powders, which implied that excess carbon could impede the growth of crystallites.25 This difference in particle size was also demonstrated by the SEM images. The average grain size of products for 1![[thin space (1/6-em)]](https://www.rsc.org/images/entities/char_2009.gif) :
:![[thin space (1/6-em)]](https://www.rsc.org/images/entities/char_2009.gif) 2–1
2–1![[thin space (1/6-em)]](https://www.rsc.org/images/entities/char_2009.gif) :
:![[thin space (1/6-em)]](https://www.rsc.org/images/entities/char_2009.gif) 4 Ti/C molar ratio was calculated by Scherrer formula and was listed in Table 2.
4 Ti/C molar ratio was calculated by Scherrer formula and was listed in Table 2.
![[thin space (1/6-em)]](https://www.rsc.org/images/entities/char_2009.gif) :
:![[thin space (1/6-em)]](https://www.rsc.org/images/entities/char_2009.gif) 2–1
2–1![[thin space (1/6-em)]](https://www.rsc.org/images/entities/char_2009.gif) :
:![[thin space (1/6-em)]](https://www.rsc.org/images/entities/char_2009.gif) 4 Ti/C molar ratios
4 Ti/C molar ratios
| Sample name | TiC-2 | TiC-3 | TiC-4 |
|---|---|---|---|
| Grain size (nm) | 33.8 | 20.5 | 17.1 |
3.2. SEM observation of titanium carbide powders
Micrographs of products with different carbon contents at 1450 °C for 2 h were depicted in Fig. 5. It was interesting that the shape and size of particles altered with the increase of carbon content, especially when the Ti/C molar ratio varied from 1![[thin space (1/6-em)]](https://www.rsc.org/images/entities/char_2009.gif) :
:![[thin space (1/6-em)]](https://www.rsc.org/images/entities/char_2009.gif) 2 to 1
2 to 1![[thin space (1/6-em)]](https://www.rsc.org/images/entities/char_2009.gif) :
:![[thin space (1/6-em)]](https://www.rsc.org/images/entities/char_2009.gif) 3. Fig. 5a showed that in the 1
3. Fig. 5a showed that in the 1![[thin space (1/6-em)]](https://www.rsc.org/images/entities/char_2009.gif) :
:![[thin space (1/6-em)]](https://www.rsc.org/images/entities/char_2009.gif) 2 Ti/C molar ratio case the size of polyhedral product varied from 150 nm to 250 nm. As for the 1
2 Ti/C molar ratio case the size of polyhedral product varied from 150 nm to 250 nm. As for the 1![[thin space (1/6-em)]](https://www.rsc.org/images/entities/char_2009.gif) :
:![[thin space (1/6-em)]](https://www.rsc.org/images/entities/char_2009.gif) 3 Ti/C molar ratio, the product was made up of spherical particles with its diameter ranging from 30 nm to 40 nm, which illustrated by Fig. 5b. We also could observe that these small spheres were separated from each other, which were much more different from TiC-2 sample. The diameter of sample TiC-4 was about 30 nm and loosely arranged as shown in Fig. 5c.
3 Ti/C molar ratio, the product was made up of spherical particles with its diameter ranging from 30 nm to 40 nm, which illustrated by Fig. 5b. We also could observe that these small spheres were separated from each other, which were much more different from TiC-2 sample. The diameter of sample TiC-4 was about 30 nm and loosely arranged as shown in Fig. 5c.
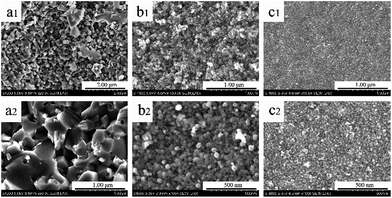 | ||
| Fig. 5 SEM images of the as-prepared titanium carbide powders with different dosages of carbon: (a1 and a2) TiC-2, (b1 and b2) TiC-3 and (c1 and c2) TiC-4. | ||
From Fig. 5a to c, it was clear that with the increase of carbon dosages, particle size and level of agglomeration decreased. When the content of carbon increased, the shape of products changed from polyhedrons to spheres, and the size decreased from about 200 nm to 30 nm. Moreover, these differences between the products of TiC-2 and TiC-3 were much larger than those of TiC-3 and TiC-4, which suggested that the 1![[thin space (1/6-em)]](https://www.rsc.org/images/entities/char_2009.gif) :
:![[thin space (1/6-em)]](https://www.rsc.org/images/entities/char_2009.gif) 3 Ti/C molar ratio was the optimum for formation of nano-titanium carbide. Actually, the reports in term of the relationship between carbon content and the size of particles were still rare. During the carbothermic reduction process, pyrolytic carbon homogeneously distributed and covered on the surface of TiO2 precursors. After complete reaction, excessive carbon separated and hindered the growth of TiC particles, therefore the agglomeration and growth of particles were eliminated.
3 Ti/C molar ratio was the optimum for formation of nano-titanium carbide. Actually, the reports in term of the relationship between carbon content and the size of particles were still rare. During the carbothermic reduction process, pyrolytic carbon homogeneously distributed and covered on the surface of TiO2 precursors. After complete reaction, excessive carbon separated and hindered the growth of TiC particles, therefore the agglomeration and growth of particles were eliminated.
3.3. Removing excess carbon
Excess carbon enables to hinder particles growth and alleviate the agglomeration of produced powders, and it may also cover on the surface of TiC particles and cause an augment of the TiC average size, thus resulting in reducing its application possibility, especially in the field of cemented carbide. Loads of surface cleaning processes have been developed and investigated in previous literature.28,29,35 Among them, the removal of excess carbon by hydrogen is the most extensively used due to the simple procedure and controllable reaction.31,32 Unfortunately, high temperature which is required to the removal of amorphous carbon from surface layer would lead to the decarbonization of TiC, thus affects the performance of TiC powders. In the present work, we have studied the influence of treatments at different temperatures under both hydrogen/argon (1![[thin space (1/6-em)]](https://www.rsc.org/images/entities/char_2009.gif) :
:![[thin space (1/6-em)]](https://www.rsc.org/images/entities/char_2009.gif) 1) mixture gas and pure hydrogen gas on the prepared TiC-2 and TiC-3 products.
1) mixture gas and pure hydrogen gas on the prepared TiC-2 and TiC-3 products.
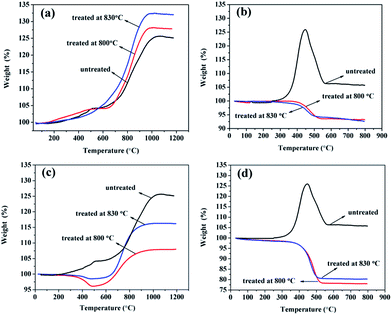
Fig. 6 showed the TGA results of samples before and after cleaning excess carbon under air atmosphere. We could see that the oxidation behaviours of TiC-2 and TiC-3 samples were quite different. From Fig. 6a, the increase of weight with temperature was seen for all samples. At the temperature of 500 °C untreated sample and treated sample at 800 °C had a small leap in weight, and then the weight rose gradually. While the weight of the sample treated at 830 °C increased steady when temperature rose up. From 700 °C to 1000 °C the weight showed up a sharp enhancement for all of those samples, and after 1000 °C they reached their constant at 125.12%, 128.17% and 132.48%, respectively. Eqn (2) displayed the oxidation reaction of TiC, and the theoretical weight increase for pure TiC was calculated to be 33.33% after the oxidation process. The sample composition was calculated from the final mass change, assuming the presence of titanium carbide and amorphous carbon in the product. When TGA was carried out in air atmosphere, TiC and carbon were reacted with oxygen to form TiO2 and CO2 according to eqn (2) and (3). Thus, TiO2 was the only solid product after as-prepared powders suffered from TGA test.
| TiC + 2O2 = TiO2 + CO2 | (2) |
| C + O2 = CO2 | (3) |
The weight fraction of TiC and free carbon present in the final synthesized powders were determinate as follows:
 | (4) |
 | (5) |
| TiC-2 | TiC-3 | ||||
|---|---|---|---|---|---|
| TiC wt% | C wt% | TiC wt% | C wt% | ||
| H2/Ar treatment | Before | 93.84 | 6.16 | 79.78 | 20.22 |
| 800 °C | 96.13 | 3.87 | >69.75 | <30.25 | |
| 830 °C | 99.36 | 0.64 | >68.23 | <31.77 | |
| H2 treatment | 800 °C | >81.04 | <18.96 | >58.52 | <41.48 |
| 830 °C | >87.11 | <12.89 | >60.75 | <39.25 | |
Besides, curves of TiC-3 in Fig. 6b had several disparities in comparison with TiC-2 in Fig. 6a. The initial oxidation temperature, the temperature of maximum weight percentage and the temperature at reaching a constant of TiC-3 were much lower than those of TiC-2. At the temperature of 300 °C, the weight of pristine TiC-3 started increasing and speedily peaked at 125.93% around 450 °C. Then the weight fell dramatically from 450 °C, which could be ascribed to the continuous release of CO2, and ended at 550 °C with a constant weight proportion of 106.37%. For the sample treated at 800 °C, the weight declined at the temperature of 400 °C and ended at 500 °C, afterwards the TG curve reached a constant even if temperature increased. In the oxidation process, TiC and amorphous carbon was reacted with oxygen which led to the increase and decrease of weight respectively. In terms of sample treated at 800 °C, the decrease of weight indicated that amorphous carbon did not be removed completely after the treatment. It was noticeable that the constant was much lower than that of pristine sample which meant that after treated via the mixture gas process, TiC-3 sample had a lower TiC content. It was clear from Fig. 5b that the particles for TiC-3 product were about 30 nm which was much smaller than that of TiC-2 sample. The smaller the particle size was, the greater the reaction activity has. Unfortunately, at the temperature of 800 °C amorphous carbon could not be removed completely, but might induce the reaction between nano-TiC particles and H2, resulting in generation of TixHy complex and being carried off by flowing gas. In order to compare with TiC-2 sample, TiC-3 product was also treated at 830 °C. However, the TGA result suggested that higher temperature had no positive effect on achieving a higher titanium carbide content for TiC-3.
Fig. 6c and d showcased TGA curves of the prepared TiC-2 and TiC-3 products, which were treated under pure hydrogen gas. The most impressive distinction of samples treated in the two atmospheres was the much lower TiC weight percent after treated under pure hydrogen gas. As could be seen in Fig. 6c, samples treated at 800 °C and 830 °C had the same variation of decrease and increase in weight percent, finally reaching a constant. The weight increase of the obtained samples treated at high temperature in hydrogen was much lower than that of the untreated sample, which might ascribe to the formation and drain of TixHy. After treated at 830 °C under pure hydrogen, sample had a less weight loss happened at 400 °C and it displayed a larger resultant weight percent of 116% compared with that of sample treated at 800 °C. The larger resultant weight percent indicated that higher temperature could lead to a strong reaction between amorphous carbon and hydrogen, and thus generating a larger content of titanium carbide. In Fig. 6d, TGA curves of the after-treated samples in pure hydrogen had the identical tendency with those in Fig. 6b, but had a much lower weight percent than the samples treated in H2/Ar mixture gas. When temperature reached 800 °C, pure hydrogen treatment could result in more loss of titanium than under the hydrogen/argon mixture gas treatment, suggesting that hydrogen/argon mixture gas process had a higher efficiency in removing excess carbon and attaining a high TiC content without decarburizing carbidic carbon.
In our study, we found that volume of hydrogen, temperature and holding time were all played crucial role in purifying obtained products. Among them, volume of hydrogen was the most significant factor influencing products. Under the pure H2 condition, the volume of hydrogen was much high, hydrogen would not only react with amorphous carbon but also with carbidic carbon promptly, which led to the formation of hydrocarbon and titanium hydride. These gaseous resultants would be carried out by flowing gas, resulting in the drain of titanium source. Thus, in the pure H2 atmosphere, it was hard to get rid of amorphous carbon and completely leave carbidic carbon behind in the products. While in the H2/Ar (1![[thin space (1/6-em)]](https://www.rsc.org/images/entities/char_2009.gif) :
:![[thin space (1/6-em)]](https://www.rsc.org/images/entities/char_2009.gif) 1) mixture gas condition, a relatively low concentration of hydrogen, the purification process was more controllable than that in the pure hydrogen atmosphere. Hydrogen as a reducing agent could slowly reacted with amorphous carbon covered on the TiC through regulating processing temperature. Hence, the purified TiC could be obtained without decarbonizing carbidic carbon under the H2/Ar (1
1) mixture gas condition, a relatively low concentration of hydrogen, the purification process was more controllable than that in the pure hydrogen atmosphere. Hydrogen as a reducing agent could slowly reacted with amorphous carbon covered on the TiC through regulating processing temperature. Hence, the purified TiC could be obtained without decarbonizing carbidic carbon under the H2/Ar (1![[thin space (1/6-em)]](https://www.rsc.org/images/entities/char_2009.gif) :
:![[thin space (1/6-em)]](https://www.rsc.org/images/entities/char_2009.gif) 1) mixture gas atmosphere. This was the main reason why pure H2 was difficulty to obtain pure TiC without completely cleaning of carbidic carbon compared with H2/Ar atmosphere. Hence, it was necessary to control the volume of hydrogen at an appropriate temperature. TGA result indicated that the hydrogen/argon (1
1) mixture gas atmosphere. This was the main reason why pure H2 was difficulty to obtain pure TiC without completely cleaning of carbidic carbon compared with H2/Ar atmosphere. Hence, it was necessary to control the volume of hydrogen at an appropriate temperature. TGA result indicated that the hydrogen/argon (1![[thin space (1/6-em)]](https://www.rsc.org/images/entities/char_2009.gif) :
:![[thin space (1/6-em)]](https://www.rsc.org/images/entities/char_2009.gif) 1) mixture gas process combined with a proper temperature was an efficient way to remove excess carbon covered on the surface of TiC products. As for TiC-2 product, holding the temperature at 830 °C for 3 h was the optimum condition which resulted in 99.36% TiC product purity. However, we could not obtain a high TiC content in TiC-3 group as same as that of TiC-2 because of its nano-sized particle.
1) mixture gas process combined with a proper temperature was an efficient way to remove excess carbon covered on the surface of TiC products. As for TiC-2 product, holding the temperature at 830 °C for 3 h was the optimum condition which resulted in 99.36% TiC product purity. However, we could not obtain a high TiC content in TiC-3 group as same as that of TiC-2 because of its nano-sized particle.
3.4. TEM morphology of titanium carbide powders
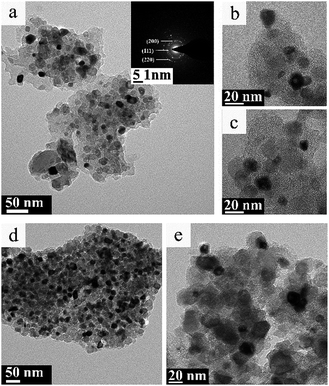
Fig. 7 and 8 displayed the TEM images of TiC-2 and TiC-3 products before and after hydrogen/argon mixture gas treatment. It could be seen from Fig. 7a–c that the grain of obtained titanium carbide varied from 10 nm to 30 nm surrounded by amorphous carbon which had no identified size (from several to several tens of nanometers). As shown in Fig. 7d and e, TiC-3 powders possessed more carbon content than TiC-2 samples, which in turn increased the amorphous carbon covered on the TiC particles.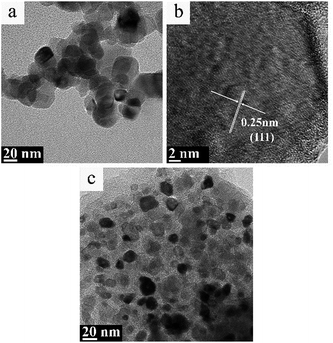 | ||
| Fig. 8 TEM image (a) and high resolution TEM image (b) of TiC-2, and TEM image (c) of TiC-3 treated under hydrogen/argon mixture gas at 830 °C for 3 h. | ||
Fig. 8 showed the TEM images of TiC-2 and TiC-3 products treated under hydrogen/argon mixture gas at 830 °C for 3 h. Purified TiC-2 grains without amorphous carbon could be seen from Fig. 8a, and the average grain size was 20–30 nm. HR-TEM image in Fig. 8b showed that the crystalline interplanar spacing of as-prepared TiC-2 was 0.25 nm which indexed to the (111) plane of titanium carbide. After the hydrogen/argon mixture gas process, TiC-3 sample still had a little free carbon covered on the surface of titanium carbide particles, which also could be demonstrated by the weight decrease in Fig. 6b. The conclusion could be drawn was that 830 °C for 3 h was an optimum condition to purify the product TiC-2 and obtain a high TiC content, which was also confirmed by Fig. 6a. As mentioned above, titanium carbide is commonly produced from the solid reduction reaction of titania by carbon in a temperature range between 1700 °C and 2100 °C.17–20 High temperature process consumes a large amount of energy and enhances the cost of TiC products. Our research presented a facile method to prepare pure TiC nanoparticles without amorphous carbon. Compared with previous literatures,36,37 our products without any crystal impurities could be obtained at a relative lower temperature. Therefore, through these studies, it was clear that the mixture gas process can efficiently remove amorphous carbon and provide a higher TiC content with smaller particle size, which could be used as an additive to improve the mechanical strength of TiC-based cemented carbide.
4. Conclusions
In conclusion, we prepared nano-structured titanium carbide through vacuum calcination and successfully removed the excess carbon via hydrogen/argon (1![[thin space (1/6-em)]](https://www.rsc.org/images/entities/char_2009.gif) :
:![[thin space (1/6-em)]](https://www.rsc.org/images/entities/char_2009.gif) 1) mixture gas for the first time. At the vacuum condition, nano-TiC could be obtained readily at lower temperature of 1450 °C with the Ti/C ratio ranging from 1
1) mixture gas for the first time. At the vacuum condition, nano-TiC could be obtained readily at lower temperature of 1450 °C with the Ti/C ratio ranging from 1![[thin space (1/6-em)]](https://www.rsc.org/images/entities/char_2009.gif) :
:![[thin space (1/6-em)]](https://www.rsc.org/images/entities/char_2009.gif) 2 to 1
2 to 1![[thin space (1/6-em)]](https://www.rsc.org/images/entities/char_2009.gif) :
:![[thin space (1/6-em)]](https://www.rsc.org/images/entities/char_2009.gif) 4. It was noticeable that the average particle size of products decreased and level of agglomeration declined as the increase of carbon content. Besides, we found that the hydrogen volume in cleaning gas played a fatal role in formation and the purity of TiC product. After treated in hydrogen/argon (1
4. It was noticeable that the average particle size of products decreased and level of agglomeration declined as the increase of carbon content. Besides, we found that the hydrogen volume in cleaning gas played a fatal role in formation and the purity of TiC product. After treated in hydrogen/argon (1![[thin space (1/6-em)]](https://www.rsc.org/images/entities/char_2009.gif) :
:![[thin space (1/6-em)]](https://www.rsc.org/images/entities/char_2009.gif) 1) mixture gas, TiC-2 had a high purity of TiC (wt% = 99.36%), and the corresponding TEM images showed that purified particles without any amorphous carbon covered on it. By contrast, pure hydrogen would make difficulty to obtain pure TiC without completely cleaning of carbidic carbon. In summary, the after-treated TiC particles with a high purity and small particle size could be applied in the fields of titanium carbide cermet and electrocatalyst in our further research. More importantly, the facile production process we provided is expected to achieve the industrialization of TiC powders because of the low cost, good operability and simplification.
1) mixture gas, TiC-2 had a high purity of TiC (wt% = 99.36%), and the corresponding TEM images showed that purified particles without any amorphous carbon covered on it. By contrast, pure hydrogen would make difficulty to obtain pure TiC without completely cleaning of carbidic carbon. In summary, the after-treated TiC particles with a high purity and small particle size could be applied in the fields of titanium carbide cermet and electrocatalyst in our further research. More importantly, the facile production process we provided is expected to achieve the industrialization of TiC powders because of the low cost, good operability and simplification.
Acknowledgements
The present work was financially supported by the Science and Technology Cooperation Project of Deyang City and Sichuan University (No. HZYF201412).References
- Y. Chen, H. Zhang, D. Ma, J. Ma, H. Ye, G. Qian and Y. Ye, Mater. Res. Bull., 2011, 46, 1800–1803 CrossRef CAS.
- E. Coronel, U. Wiklund and E. Olsson, Thin Solid Films, 2009, 518, 71–76 CrossRef CAS.
- M. A. R. Dewan, G. Zhang and O. Ostrovski, Metall. Mater. Trans. B, 2008, 40, 62–69 CrossRef.
- H. H. Hwu and J. G. Chen, Chem. Rev., 2005, 105, 185–212 CrossRef CAS PubMed.
- V. Kiran, K. L. Nagashree and S. Sampath, RSC Adv., 2014, 4, 12057–12064 RSC.
- R. Koc, C. Meng and G. A. Swift, J. Mater. Sci., 2000, 35, 3131–3141 CrossRef CAS.
- R. Koc and J. S. Folmer, J. Mater. Sci., 1996, 32, 3101–3111 CrossRef.
- H. P. Gou, G. H. Zhang and K. C. Chou, J. Mater. Sci., 2016, 51, 7008–7015 CrossRef CAS.
- R. Khoshhal, M. Soltanieh and M. A. Boutorabi, Int. J. Refract. Met. Hard Mater., 2014, 45, 53–57 CrossRef CAS.
- M. H. El-Sadek, M. B. Morsi, K. El-Barawy and H. A. El-Didamony, Int. J. Miner. Process., 2013, 120, 39–42 CrossRef CAS.
- R. Koc, J. Mater. Sci., 1998, 33, 1049–1055 CrossRef CAS.
- Y. Ou, X. Cui, X. Zhang and Z. Jiang, J. Power Sources, 2010, 195, 1365–1369 CrossRef CAS.
- Y. Zhao, Y. Wang, X. Cheng, L. Dong, Y. Zhang and J. Zang, Carbon, 2014, 67, 409–416 CrossRef CAS.
- Y. C. Kimmel, X. Xu, W. Yu, X. Yang and J. G. Chen, ACS Catal., 2014, 4, 1558–1562 CrossRef CAS.
- L. Yang, Y. C. Kimmel, Q. Lu and J. G. Chen, J. Power Sources, 2015, 287, 196–202 CrossRef CAS.
- Q. Dong, M. Huang, C. Guo, G. Yu and M. Wu, Int. J. Hydrogen Energy, 2016 DOI:10.1016/j.ijhydene.2016.09.217.
- L. M. Berger, W. Gruner, E. Langholf and S. Stolle, Int. J. Refract. Met. Hard Mater., 1999, 17, 235–243 CrossRef CAS.
- N. Chandra, M. Sharma, D. K. Singh and S. S. Amritphale, Mater. Lett., 2009, 63, 1051–1053 CrossRef CAS.
- D. W. Flaherty, R. A. May, S. P. Berglund, K. J. Stevenson and C. B. Mullins, Chem. Mater., 2010, 22, 319–329 CrossRef CAS.
- N. A. Hassine, J. G. P. Binner and T. E. Cross, Int. J. Refract. Met. Hard Mater., 1995, 13, 353–358 CrossRef CAS.
- H. Zhang, F. Li, Q. Jia and G. Ye, J. Sol-Gel Sci. Technol., 2008, 46, 217–222 CrossRef CAS.
- K. Zhao, Y. Wang, J. Peng, Y. Di, K. Liu and N. Feng, RSC Adv., 2016, 6, 8644–8650 RSC.
- Z. Abdullaeva, E. Omurzak, C. Iwamoto, H. Okudera, M. Koinuma, S. Takebe, S. Sulaimankulova and T. Mashimo, RSC Adv., 2013, 3, 513–519 RSC.
- X. Yin, I. Gotman, L. Klinger and E. Y. Gutmanas, Mater. Sci. Eng., A, 2005, 396, 107–114 CrossRef.
- R. Koc, J. Eur. Ceram. Soc., 1997, 17, 1309–1315 CrossRef CAS.
- H. Preiss, L. M. Berger and D. Schultze, J. Eur. Ceram. Soc., 1999, 30, 195–206 CrossRef.
- Y. C. Kimmel, D. V. Esposito, R. W. Birkmire and J. G. Chen, Int. J. Hydrogen Energy, 2012, 37, 3019–3024 CrossRef CAS.
- G. Leclercq, M. Kamal, J. F. Lamonier, L. Feigenbaum, P. Malfoy and L. Leclercq, Appl. Catal., A, 1995, 121, 169–190 CrossRef CAS.
- L. Tong and R. Reddy, Scr. Mater., 2005, 52, 1253–1258 CrossRef CAS.
- S. Dyjak, M. Norek, M. Polański, S. Cudziło and J. Bystrzycki, Int. J. Refract. Met. Hard Mater., 2013, 38, 87–91 CrossRef CAS.
- L. Leclercq, M. Provost, H. Pastor, J. Grimblot, A. M. Hardy, L. Gengembre and G. Leclercq, J. Catal., 1989, 117, 384–395 CrossRef CAS.
- J. S. Lee, S. T. Oyama and M. Boudart, J. Catal., 1987, 106, 125–133 CrossRef CAS.
- H. Preiss, L. M. Berger and M. Braun, Carbon, 1995, 33, 1739–1746 CrossRef CAS.
- W. Sen, B. Q. Xu, B. Yang, H. Y. Sun, J. X. Song, H. L. Wan and Y. N. Dai, Trans. Nonferrous Met. Soc. China, 2011, 21, 185–190 CrossRef.
- M. J. Ledoux, C. Pham-Huu, J. Guille, H. Dunlop, S. Hantzer, S. Marin and M. Weibel, Catal. Today, 1992, 15, 263–284 CrossRef CAS.
- Y. C. Woo, H. J. Kang and D. J. Kim, J. Eur. Ceram. Soc., 2007, 27, 719–722 CrossRef CAS.
- M. A. R. Dewan, G. G. Zhang and O. Ostrovski, Metall. Mater. Trans. B, 2009, 40, 62–69 CrossRef.
Footnote |
| † These authors contributed equally to this work. |
| This journal is © The Royal Society of Chemistry 2017 |

