 Open Access Article
Photoluminescence of self-assembled Ag(I) and Au(I) N-heterocyclic carbene complexes. Interplay the aurophilic, hydrogen bonding and hydrophobic interactions†
Herbert J. H. Syu*,
Josh Y. Z. Chiou,
Ju-Chun Wang and
Ivan J. B. Lin
Department of Chemistry, Soochow University, Taipei 111, Taiwan. E-mail: d9812001@gms.ndhu.edu.tw; Fax: +886-3-863-3570
First published on 6th March 2017
Abstract
N-Hexadecanyl-N′-(2-hydroxyhexadecanyl)imidazol-2-ylidene (denoted as C16,C16(2-OH)-imy), in which one of the alkyl chains was anchored with a hydroxyl group at 2-position, was used to synthesize silver and gold N-heterocyclic carbene (NHC) complexes. The silver complex [(Ag(C16,C16(2-OH)-imy)2)2][Ag2Cl4] (1) shows liquid crystalline behavior and gold complexes [Au(C16,C16(2-OH)-imy)Cl] (2), [Au(C16,C16(2-OH)-imy)2][BF4] (3) and [Au(C16,C16(2-OH)-imy)2][PF6] (4) are soft materials. Compounds 1 and 2 are emissive, arising from metal–metal interactions. Compound 2 shows different emission colors depending on whether the sample is prepared as a crystal, soft material, or thin film. The relative strengths of aurophilic, hydrogen bonding and chain–chain hydrophobic interactions in the different states are investigated by powder X-ray diffraction, and Raman and IR spectroscopies. Results show that the one with a stronger Au–Au interaction displays a longer emission wavelength and has weaker O–H hydrogen bonding and hydrophobic interactions.
Introduction
In the past few decades, research on supramolecular chemistry has grown exponentially, with the aim at understanding the chemistry beyond covalent bonds. Supramolecular chemistry concerns the chemical systems formed by the self-assembly of chemical species via intermolecular interactions.1,2 While various interactions are possible, they are either competitive or cooperative in the controlling of the structure building. For example, the competition between N–H⋯O hydrogen bonding and π–π interactions in amide functionalized 2,6-diethynylanthracene derivatives could lead to different supramolecular structures resulting in a change of emission color.3 On the other hand, the C–H⋯O and N–H⋯N hydrogen bondings in 1-acetamido-3-(2-pyrazinyl)imidazolium hexafluorophosphate salt could be cooperatively interplayed to build up triple helical supramolecules.4Liquid crystals (LCs), a type of soft matter, are partially ordered fluids, formed from self-assembled supramolecules. The structure of LCs can be easily deformed or changed by external stimuli, such as thermal, mechanical or electric stresses. These stimulations could tune the predominating supramolecular interactions and result in a change of their physical properties, such as molecular alignment or emission color.5,6 Interest in emissive soft matter has increased rapidly because of their potentials as organic light-emitting diodes (OLEDs).7 We have been interested in the preparation of LCs of Ag(I)– and Au(I)–NHC complexes, as they are relatively stable, and may exhibit photoluminescence induced by aurophilic or argentophilic interactions, arisen from the attractive interactions between closed-shell d10 metal centers. Up to the present, reports of liquid crystalline Ag(I)– and Au(I)–NHC complexes are limited.8–10 Previously, we reported [Au(NHC)(im-R)] (im-R = monosubstitution imidazole with alkyl or 2-hydroxy-substituted alkyl) compounds, which exhibit sematic A mesophase and are good precursors for the fabrication of Au NPs.8 We also reported that Ag(I)– and Au(I)–NHCs having N-acetamido group show SmA liquid crystals. The latter compounds could self-assemble to form xerogel through coulombic, hydrophobic and hydrogen bonding interactions.9 In a later publication, Ag(I) complexes with cyanobiphenyl or cholesteryl functionalized gemini NHC ligands has been shown to exhibit enantiotropic SmA phase.10 However, with simple N-long alkyl chains, complexes of type [M(NHC)2][anion] are known to form ordered soft materials, but failed to display liquid crystal properties.11
In this work we incorporate a hydroxyl groups at the 2-position of the N-alkyl chain in Ag(I)– and Au(I)–NHC complexes hoping to induce hydrogen bonding interactions to promote the formation of mesophase, and further to interplay the hydrogen bonding, metallophilic and hydrophobic interactions in these compounds to influence or tune their photoluminescence. Results show that the neutral Au(NHC)Cl compound displays aggregation dependent emissive behavior. Previously, we reported that N,N′-dimethyl substituted Au(NHC)Cl complex exhibited a strong emission at λmax of 620 nm arisen from extended Au–Au interaction via aggregation, but was silent at the absence of this interaction.12 Similar aggregation induced luminescence has also been established in systems such as Pt(II) cyclometalated complexes.13–15 Unlike those known examples, however, the present work shows that extended aggregation only tunes the emission of Au(I)–NHC to a longer wavelength. Furthermore the interplay of the relative strength of aurophilic, hydrogen bonding and hydrophobic interactions has not been reported.
Result and discussion
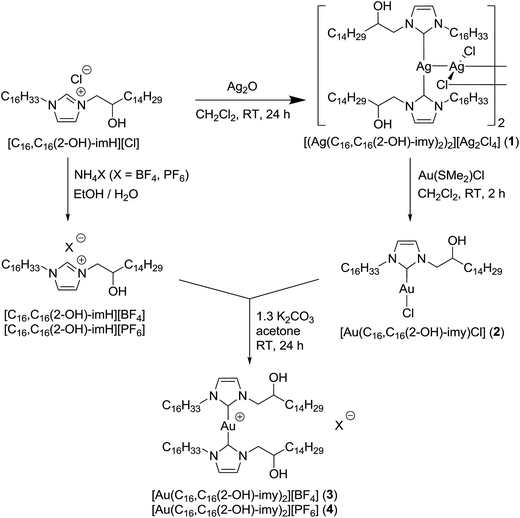
[(Ag(C16,C16(2-OH)-imy)2)2][Ag2Cl4] (1), where (C16,C16(2-OH)-imy) is an NHC of N-hexadecanyl-N′-(2-hydroxyhexadecanyl)imidazol-2-ylidene, is prepared via reaction of Ag2O with [C16,C16(2-OH)-imyH)]·[Cl].16 The neutral Au(I)–NHC compound, [Au(C16,C16(2-OH)-imy)Cl] (2), is synthesized through transmetallation from the corresponding Ag(I)–NHC compound. The ionic bis-carbene complexes of [Au(C16,C16(2-OH)-imy)2][BF4] (3) and [Au(C16,C16(2-OH)-imy)2][PF6] (4) are prepared by the reaction of [Au(C16,C16(2-OH)-imy)Cl] with imidazolium salts of BF4− and PF6−, respectively, in the presence of K2CO3 (Scheme 1).17 Attempts to prepare bis-carbene cations directly from reaction of 1 and Au(SMe2)Cl in a 1 to 2 molar ratio (NHC/Au = 2) always give mixtures of neutral mono and ionic bis-NHC products, which are difficult to purify. One of the reasons for the sluggish transfer of the second NHC from 1 to the neutral compound could be rationalized by the steric hindrance of the long N-alkyl chain.Single crystals of 1 and 2 are obtained from concentrated DMSO/CH2Cl2 and CH2Cl2/ethanol solution, respectively. Due to the poor crystal quality of complex 1 we have been unable to locate the details of the long chain atoms. However, that the core structure of the tetranuclear Ag(I)–NHC comprises two cations of [Ag(NHC)2]+ intercalated by an anion of [Ag2Cl4]2− and that the alkyl chains are non-interdigitated could be deduced. The core structure and the chain stacking are similar to our reported tetrasilver(I)–NHC complexes with simple alkyl chains.11 Results are provided in Fig. S1.†
The ORTEP drawing of 2 is given in Fig. 1a. This compound adopts a linear NHC–Au–Cl geometry around the Au(I) center with Cl(1)–Au(1)–C(1) angle of 178.0(2)°. The two alkyl chains tilt ca. 34° from the imidazole ring plane and are stretched at opposite directions. The molecular structure of 2 looks like a rod of NHC with a pendant AuCl moiety at the center. The Au(1)–C(1) and Au(1)–Cl(1) bond distances of 1.965(7) Å and 2.286(2) Å, respectively, are normal compared to the known compounds.18 Considering molecular packing, two neighboring molecules as a pair are associated through aurophilic Au⋯Au (3.4493(9) Å) and hydrogen bonding O–H⋯Cl (2.534 Å) interactions in a head to tail fashion (Fig. 1b). Extended Au–Cl⋯H–C(ring) hydrogen bonding interactions (2.887 Å) further link these pairs to give a polymeric assembly of lamellar structures with interdigitated hydrocarbon chains. This assembly yields a layer distance of ca. 24 Å (Fig. 1c).
Compound 1 is a LC, whereas 2–4 are ordered soft materials. Thermal behavior and mesomorphic properties of these compounds have been examined by differential scanning calorimetry (DSC), powder X-ray diffraction (PXRD) and polarized optical microscopy (POM). The phase transition temperatures and enthalpy changes of these compounds are summarized in Table 1.
| Compound | Phase transition |
|---|---|
| a Cr, Cr′: crystal phase; S: soft crystal phase; SmA: smectic A phase; I: isotropic liquid; aglass phase transition. bTotal enthalpy value for unresolved peaks. | |
| [(Ag(C16,C16(2-OH)-imy)2)2][Ag2Cl4] (1) |  |
| [Au(C16,C16(2-OH)-imy)Cl] (2) |  |
| [Au(C16,C16(2-OH)-imy)2][BF4] (3) |  |
| [Au(C16,C16(2-OH)-imy)2][PF6] (4) |  |
DSC thermogram of 1 is shown in Fig. 2a. On the heating cycle, there is a small endothermic process at 54.0 °C (ΔH = 2.6 kJ mol−1) followed by a large endothermic process at 92.6 °C (ΔH = 45.9 kJ mol−1), then a small peak at 97.6 °C (ΔH = 3.2 kJ mol−1). The first small thermal process is presumably a crystal-to-crystal phase transition as evidenced by the following observations. Before and after the first phase transition, textures could be observed under POM with or without polarizer, a phenomenon typically found for crystals. Furthermore, diffractogram taken after this phase transition shows a lamellar structure but no halo at 2θ value of ca. 18° signaling a fluid-like chain motion could be found. The second and third thermal processes presumably correspond to mesophase and isotropic liquid formations, respectively. This mesophase has a narrow temperature range of 5 °C between 92.6 and 97.6 °C. The presence of mesophase is supported by the observation of fan shape textures and homeotropic domains under POM, typical for SmA phase (Fig. 2b). Diffractogram at mesophase shows a lamellar structure with three equal spacing peaks at small angle region and a fluid-like halo at the middle angle range (Fig. 2b). The assignment of SmA mesophase is further supported by a decrease in the d-spacing upon increasing the temperature in the mesophase range. This observation is often observed when the molecular rods are lying perpendicular to the substrate such that thermal motion would shorten the layer distance (Table 2). Upon cooling from isotropic liquid, there is a small exothermic process at 95.6 °C (ΔH = 3.7 kJ mol−1), corresponding to the formation of mesophase; this phase persists until 45.9 °C, at which a small exothermic peak of ΔH = 9.2 kJ mol−1 is observed. No further thermal process occurs from 45.9 °C down to 0 °C. Therefore, the mesophase range is widened ten times from the process of heating to cooling. We also notice that there is a substantial decrease in the sum of enthalpy changes from the processes of heating to cooling, suggesting supercooling phenomenon occurs, and the phase below 45.9 °C is metastable. Results of DSC, POM and PXRD all suggest that 1 is a metallomesogen exhibiting SmA mesophase. Since simple long N,N′-dialkyl NHC Ag(I) complexes of similar structure do not exhibit LC behavior,19 we ratio that the pendent hydroxyl group could enhance hydrogen bonding interaction to induce the LC behavior of 1. Hydrogen bonding interaction induced LC phase has also been observed for N-amido functionalized NHC complexes of Ag(I).11
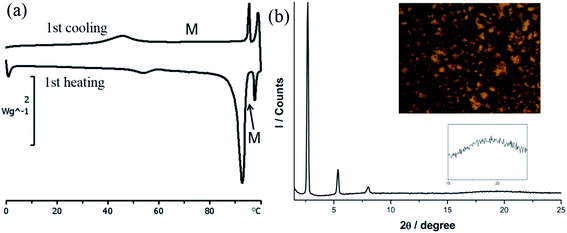 | ||
| Fig. 2 (a) DSC thermograms of 1. (b) PXRD pattern and POM image of 1 at 80 °C under cooling process (at the rate of 10 °C min−1). | ||
| Compound | d-Spacing (Å) [temperature (°C)] | Phase |
|---|---|---|
| a Cooling process. | ||
| [(Ag(C16,C16(2-OH)-imy)2)2][Ag2Cl4] (1) | 32.4 [30] | Cr |
| 38.2 [60] | Cr′ | |
| 32.7 [80]a/36.0 [60]a | SmA | |
| [Au(C16,C16(2-OH)-imy)Cl] (2) | 24.3 [30] | Cr |
| 35.1 [30]a | Soft crystal | |
| [Au(C16,C16(2-OH)-imy)2][BF4] (3) | 33.2 [30] | Cr |
| 36.1 [140] | Soft crystal | |
| [Au(C16,C16(2-OH)-imy)2][PF6] (4) | 32.1 [30] | Cr |
| 35.0 [140] | Soft crystal | |
DSC thermogram of 2 is given in Fig. 3. Upon heating, there is only one large endothermic process (ΔH = 80.9 kJ mol−1) due to a phase transition from crystal to isotropic phase, supported by the POM observation. Upon cooling from isotropic liquid down to 0 °C, an exothermic process occurs at 64.7 °C with ΔH value (41.4 kJ mol−1) only half of that from heating. Thus a metastable phase occurs upon cooling from isotropic liquid. Under POM this phase gives a circular shaped texture under POM (Fig. 3b). However, without cross-polarizer, this texture disappears, suggesting that this is a soft matter but not a crystalline solid (Fig. S2†). This metastable phase remains on the second heating cycle until melting at 87.3 °C (ΔH = 41.4 kJ mol−1). This metastable species, which persists at room temperature for days, is mechanically soft and could be deformed through gentle pressing. Diffractogram of the crystalline 2 shows a lamellar structure with a layer distance of 24.3 Å, consistent with the single crystal X-ray result. The soft materials display a set of three equal spacing reflections in the small angle region with a layer distance of 35.1 Å, yet no halo could be observed (Fig. 3b). Results indicate that the soft materials adopt an ordered lamellar structure with no fluid-like behavior. Since results of single crystal X-ray diffraction shows that the molecular rod is almost perpendicular to the layer plane at solid state, the substantial increase in d-spacing from crystal to soft materials, is most likely due to a change of chain packing from interdigitation to non-interdigitation. The pendent AuCl at the middle of the molecular rod of 2 presumably prevents the ordered motion of the molecule, therefore 2 doesn't exhibit LC phase.
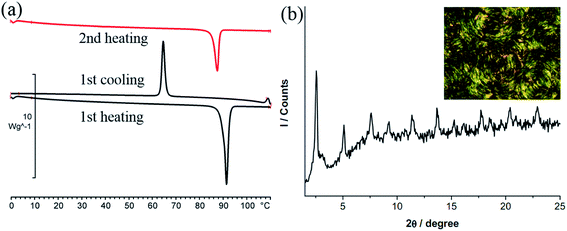 | ||
| Fig. 3 (a) DSC thermogram of 2. (b) PXRD pattern and POM image of 2 recorded at room temperature upon slow cooling from 110 °C (at the rate of 10 °C min−1). | ||
Both the two ionic Au(I)–bis-NHC complexes, 3 and 4, are also non-mesogenic. Complex 3 shows three endothermic processes of unresolved peaks at 35.0, 44.3 and 53.5 °C with a total enthalpy value of 47.3 kJ mol−1, then a single sharp band at 159.1 °C corresponding to a clearing process with an enthalpy value of 51.3 kJ mol−1. Diffractogram taken at 140 °C on the cooling process shows a series of equal spacing reflections corresponding to an ordered layer structure with a layer distance of 36.1 Å. Since no halo is found near the 2θ value of 20° and a large enthalpy change occurs at the clearing process, compound 3 at the temperature range between 53.5 and 159.1 °C is likely an ordered soft matter but not a LC (Fig. S3†). Similar results were also found for the analogous compound 4 (Fig. S4†).
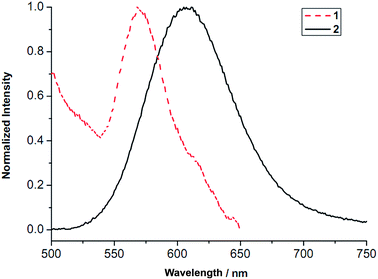
Compounds 1 and 2 show yellow and orange emissions respectively, under the irradiation of a hand hold UV lamp. Photoluminescence spectra of the solid samples of 1 and 2 (Fig. 4) exhibit a featureless band with maxima at 569 and 607 nm, respectively. The position and line shape of these emissions are often observed in those M–M bonded Ag(I) and Au(I) compounds and have been attributed to metal-metal-to-ligand charge transfer (MMLCT), in which, metallophilic interaction is responsible for this observed emission.20–22 Compounds 3 and 4 are non-emissive, presumably due to the lack of Au–Au interactions.
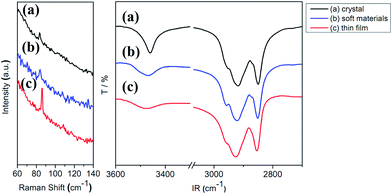
Interestingly, compound 2 displays different emission maxima under different sample preparations. While the virgin sample of 2 shows a band at λmax of 607 nm (16![[thin space (1/6-em)]](https://www.rsc.org/images/entities/char_2009.gif) 474 cm−1) (Fig. 5a), 2 at the state of soft materials obtained via heating to isotropic liquid then cooling, shifts the band slightly to 618 nm (16
474 cm−1) (Fig. 5a), 2 at the state of soft materials obtained via heating to isotropic liquid then cooling, shifts the band slightly to 618 nm (16![[thin space (1/6-em)]](https://www.rsc.org/images/entities/char_2009.gif) 181 cm−1) (Fig. 5b). Furthermore, thin film of 2 prepared via casting its CH2Cl2 solution on a substrate exhibits a structured broad emission band at λmax of 651 nm (15
181 cm−1) (Fig. 5b). Furthermore, thin film of 2 prepared via casting its CH2Cl2 solution on a substrate exhibits a structured broad emission band at λmax of 651 nm (15![[thin space (1/6-em)]](https://www.rsc.org/images/entities/char_2009.gif) 360 cm−1) (Fig. 5c). Since the emissive nature of 2 involves Au–Au interactions, the difference in the observed λmax values is likely due to the variation in the Au–Au distance. The relationship between photoluminescent energy and Au–Au distance has been investigated. In many cases, a shorter Au–Au distance gives a lower energy emission.23,24 This has been explained that a shorter Au–Au distance, hence a stronger Au–Au interaction provides a smaller HOMO–LUMO gap, thus a lower energy for electronic transition.25–27 This correlation may not hold true when two compounds have different ligands. Even more an inverse correlation has also been observed. For example, in the ionic compounds of [cation][Au(SCN)2] with different cations, a shorter anionic Au–Au distance displays a higher energy of emission.28,29 Emission lifetimes of different samples of 2 are measured. They all show bi-exponential emission decay: crystalline sample τ1 0.64 μs and τ2 5.74 μs, soft materials τ1 0.65 μs and τ2 6.00 μs and thin film τ1 1.36 μs and τ2 6.41 μs. The thin film, has the longest lifetime τ1 and τ2 among the three. Bi-exponential emission decay has often been observed in Au(I) compounds,23,30,31 however, the exact nature of how Au–Au interaction influences the emission lifetime is not yet clear.
360 cm−1) (Fig. 5c). Since the emissive nature of 2 involves Au–Au interactions, the difference in the observed λmax values is likely due to the variation in the Au–Au distance. The relationship between photoluminescent energy and Au–Au distance has been investigated. In many cases, a shorter Au–Au distance gives a lower energy emission.23,24 This has been explained that a shorter Au–Au distance, hence a stronger Au–Au interaction provides a smaller HOMO–LUMO gap, thus a lower energy for electronic transition.25–27 This correlation may not hold true when two compounds have different ligands. Even more an inverse correlation has also been observed. For example, in the ionic compounds of [cation][Au(SCN)2] with different cations, a shorter anionic Au–Au distance displays a higher energy of emission.28,29 Emission lifetimes of different samples of 2 are measured. They all show bi-exponential emission decay: crystalline sample τ1 0.64 μs and τ2 5.74 μs, soft materials τ1 0.65 μs and τ2 6.00 μs and thin film τ1 1.36 μs and τ2 6.41 μs. The thin film, has the longest lifetime τ1 and τ2 among the three. Bi-exponential emission decay has often been observed in Au(I) compounds,23,30,31 however, the exact nature of how Au–Au interaction influences the emission lifetime is not yet clear.
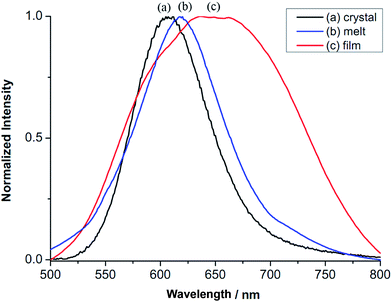 | ||
| Fig. 5 Photoluminescence of compound 2. (a) Crystalline solid, (b) soft materials from heating and cooling and (c) thin-film via drop coating with CH2Cl2 solution (λex = 306 nm). | ||
Vibrational spectroscopies and PXRD are further utilized to better understanding the influence of intermolecular interactions on their emissive behavior. Results of Raman spectroscopic study will be discussed first. At the low energy region of <100 cm−1, the crystalline sample shows a band at 83 cm−1, the soft materials at 84 cm−1 and the thin film at 86 cm−1 (Fig. 6, left). These stretching frequencies fall in the range of those νAu–Au values previously assigned to Au–Au stretchings.29,32,33 Since a larger νAu–Au value implies a greater Au–Au interaction, the results of Raman study suggest that there is an increase in the Au–Au interaction from crystal to soft materials then to thin film. A plot of νAu–Au vs. emission energy shows a linear relationship (Fig. S6†); the greater the νAu–Au the lower the emission energy. As well, IR spectra of 2 at the high wave number region corresponding to O–H and C–H vibrations are also examined (Fig. 6, right). Crystalline sample of 2 shows a relatively large νOH band at 3461 cm−1 (Fig. 6). This band blue shifts to 3468 cm−1 for the soft materials, and to 3475 cm−1 for the thin film. This shift accompanies with a broadening of the band shape. A higher energy of νOH indicates a stronger O–H bond but a weaker hydrogen bonding interaction with its partners. On the other hand, a broader νOH band could be interpreted as a more random or less directional hydrogen bonding interactions for the O–H group. Therefore the hydrogen bonding interactions between the O–H group and its neighboring partners become weaker and less directional from crystalline solid to soft natter then to thin film. The known C–H stretching vibration mode normally appears between 2950 and 2850 cm−1. While the crystalline sample of 2 displays two major bands at 2918 and 2850 cm−1, those for the soft materials appear at 2921 and 2851 cm−1 and the thin film at 2926 and 2854 cm−1. These values are compared to those of 2920 and 2850 cm−1 for n-alkanes in the solid state and 2928 and 2856 cm−1 observed for liquid n-alkanes.34 A higher wave number of νC–H observed for n-alkane indicates an increase of C–H bond strength but a decrease of hydrophobic chain–chain interaction. The trend found in 2 is similar to those of n-alkane at different states suggesting that there is a gradual decrease of hydrophobic interactions from crystal to thin film.
Results of PXRD will be elaborated further. Diffractograms of 2 at different states are provided in Fig. 7, and the tentative structural drawings corresponding to those states are shown in Fig. 8. The small angle region was discussed earlier; both the crystalline sample and soft states adopt a lamellar structure (Fig. 7a and b), however, the former has an interdigitate chain interaction but not the latter (Fig. 8a and b). On the other hand, the thin film is amorphous (Fig. 7c) with random chain packing (Fig. 8c). A structural change from chain interdigitation to non-interdigitation is a common phenomenon observed during phase transition from crystal to mesophase.35–37 Diffractogram at the wide angle region of 2θ values between 25 and 30° has been utilized to evaluate the Au–Au separation in Au(I) compounds. For example, compounds of [Au(alkanethiolate)] at mesophase show a weak reflection corresponding to ca. 3.5 Å, which has been attributed to an extended Au–Au interactions in these compounds.38 Observation of extended Pt–Pt separations in wide angle region have also been reported.39,40 Crystalline 2 has a pairwise Au–Au separation, which could not be allocated in the diffractogram (Fig. 7a), but a value of ca. 3.45 Å could be deduced from single crystal X-ray study. 2 at the state of soft materials shows a relatively weak band corresponding to 3.38 Å (Fig. 7b). The thin film of amorphous 2 has a relatively strong sharp reflection at 3.14 Å (Fig. 7c). Therefore results of X-ray diffraction studies show that the trend of Au–Au distances of 3.45, 3.38 and 3.14 Å at crystal, soft materials and thin film, respectively, is consistent with that of the νAu–Au stretchings of 83, 84 and 86 cm−1 found from Raman spectroscopic studies; that is a longer Au–Au distance has a smaller energy of stretching. The trend of Au–Au distance and emission energy also shows a linear relationship as provided in Fig. S6;† the longer Au–Au distance (weaker Au–Au interaction) has a correspondingly higher emission energy. Results of Raman, IR and PXRD studies suggest that among the three states of 2, those with a stronger Au–Au interaction has a smaller emission energy, and a weaker hydrogen bonding and hydrophobic interactions. Although examples of tuning intermolecular interactions to alter emission color have been illustrated,3,23 our system demonstrates the first example of interplay the relative strength of Au–Au, hydrogen bonding and hydrophobic interactions. Since argentophilic interactions are also known, one might question why 1 doesn't show aggregation dependent emissive behavior? A simple explanation is that while aggregation via intermolecular Au–Au interaction in neutral Au(NHC)X is well established,12,41 no intermolecular Ag–Ag interaction induced aggregation has been observed in tetranuclear Ag(I)NHC complexes with structures similar to 1.
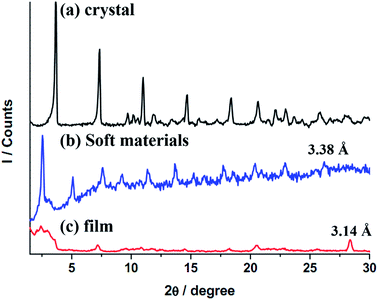 | ||
| Fig. 7 XRD patterns of Au(I)–NHC complex at 30 °C, (a) virgin crystalline solid from solution, (b) soft materials from melt and (c) thin-film on a Cu substrate via coating with CH2Cl2 solution. | ||
 | ||
| Fig. 8 Tentative molecular structures of 2 as (a) crystalline solid, (b) soft materials and (c) thin film. | ||
In summary, incorporation of a 2-hydroxyl group at the long alkyl chain of NHC increases the hydrogen bonding interactions and thus induces the liquid crystal phase formation for the tetranuclear Ag(I)–NHC complex 1, but not the mono nuclear Au(I)–NHC complexes of 2, 3 and 4. Compound 2 at different states provides some interesting emission behavior. From crystalline state to soft materials then thin film, there is a close correlation between the Au–Au interactions and photoluminescent wavelength. The one with a stronger Au–Au interaction has a longer emission wavelength. Furthermore, the different samples of 2 illustrate a beautiful balance among the Au–Au, hydrogen bonding and the hydrophobic interactions. A stronger Au–Au interaction accompanies with a weaker O–H hydrogen bonding and hydrophobic interactions, and vice versa. The interplay of these interactions has never been reported.
Acknowledgements
This work is supported by the National Science Council of Taiwan (MOST 104-2113-M-259-010-).References
- J.-M. Lehn, Angew. Chem., Int. Ed., 1988, 27, 89–112 CrossRef.
- L. C. Gilday, S. W. Robinson, T. A. Barendt, M. J. Langton, B. R. Mullaney and P. D. Beer, Chem. Rev., 2015, 115, 7118–7195 CrossRef CAS PubMed.
- Y. Sagara and T. Kato, Angew. Chem., Int. Ed., 2008, 47, 5175–5178 CrossRef CAS PubMed.
- K.-M. Lee, J. C. C. Chen, H.-Y. Chen and I. J. B. Lin, Chem. Commun., 2012, 48, 1242–1244 RSC.
- Y. Sagara and T. Kato, Nat. Chem., 2009, 1, 605–610 CrossRef CAS PubMed.
- V. N. Kozhevnikov, B. Donnio and D. W. Bruce, Angew. Chem., Int. Ed., 2008, 47, 6286–6289 CrossRef CAS PubMed.
- S. Laschat, A. Baro, N. Steinke, F. Giesselmann, C. Hagele, G. Scalia, R. Judele, E. Kapatsina, S. Sauer, A. Schreivogel and M. Tosoni, Angew. Chem., Int. Ed., 2007, 46, 4832–4887 CrossRef CAS PubMed.
- R. T. W. Huang, W. C. Wang, R. Y. Yang, J. T. Lu and I. J. B. Lin, Dalton Trans., 2009, 7121–7131 RSC.
- T. H. T. Hsu, J. J. Naidu, B.-J. Yang, M.-Y. Jang and I. J. B. Lin, Inorg. Chem., 2012, 51, 98–108 CrossRef CAS PubMed.
- A. Pana, M. Ilis, M. Micutz, F. Dumitrascu, I. Pasuk and V. Circu, RSC Adv., 2014, 4, 59491–59497 RSC.
- C. K. Lee, C. S. Vasam, T. W. Huang, H. M. J. Wang, R. Y. Yang, C. S. Lee and I. J. B. Lin, Organometallics, 2006, 25, 3768–3775 CrossRef CAS.
- H. M. J. Wang, C. S. Vasam, T. Y. R. Tsai, S.-H. Chen, A. H. H. Chang and I. J. B. Lin, Organometallics, 2005, 24, 486–493 CrossRef CAS.
- V. V. Sivchik, E. V. Grachova, A. S. Melnikov, S. N. Smirnov, A. Y. Ivanov, P. Hirva, S. P. Tunik and I. O. Koshevoy, Inorg. Chem., 2016, 55, 3351–3363 CrossRef CAS PubMed.
- A. Amar, H. Meghezzi, J. Boixel, H. Le Bozec, V. Guerchais, D. Jacquemin and A. Boucekkine, J. Phys. Chem. A, 2014, 118, 6278–6286 CrossRef CAS PubMed.
- S. S. Pasha, P. Alam, S. Dash, G. Kaur, D. Banerjee, R. Chowdhury, N. Rath, A. Roy Choudhury and I. R. Laskar, RSC Adv., 2014, 4, 50549–50553 RSC.
- H. M. J. Wang and I. J. B. Lin, Organometallics, 1998, 17, 972–975 CrossRef CAS.
- R. Jothibasu, H. V. Huynh and L. L. Koh, J. Organomet. Chem., 2008, 693, 374–380 CrossRef CAS.
- J. C. Y. Lin, R. T. W. Huang, C. S. Lee, A. Bhattacharyya, W. S. Hwang and I. J. B. Lin, Chem. Rev., 2009, 109, 3561–3598 CrossRef CAS PubMed.
- C. K. Lee, K. M. Lee and I. J. B. Lin, Organometallics, 2002, 21, 10–12 CrossRef CAS.
- Q.-J. Pan and H.-X. Zhang, Eur. J. Inorg. Chem., 2003, 2003, 4202–4210 CrossRef.
- L. Ray, M. M. Shaikh and P. Ghosh, Inorg. Chem., 2007, 47, 230–240 CrossRef PubMed.
- H. Schmidbaur and A. Schier, Angew. Chem., Int. Ed., 2015, 54, 746–784 CrossRef CAS PubMed.
- H. Ito, M. Muromoto, S. Kurenuma, S. Ishizaka, N. Kitamura, H. Sato and T. Seki, Nat. Commun., 2013, 4, 2009 Search PubMed.
- W. E. van Zyl, J. M. López-de-Luzuriaga, A. A. Mohamed, R. J. Staples and J. P. Fackler, Inorg. Chem., 2002, 41, 4579–4589 CrossRef CAS PubMed.
- H. Xiang, J. Cheng, X. Ma, X. Zhou and J. J. Chruma, Chem. Soc. Rev., 2013, 42, 6128–6185 RSC.
- L. H. Doerrer, Dalton Trans., 2010, 39, 3543–3553 RSC.
- Z. Assefa, B. G. McBurnett, R. J. Staples, J. P. Fackler, B. Assmann, K. Angermaier and H. Schmidbaur, Inorg. Chem., 1995, 34, 75–83 CrossRef CAS.
- N. L. Coker, J. A. Krause Bauer and R. C. Elder, J. Am. Chem. Soc., 2004, 126, 12–13 CrossRef CAS PubMed.
- R. K. Arvapally, P. Sinha, S. R. Hettiarachchi, N. L. Coker, C. E. Bedel, H. H. Patterson, R. C. Elder, A. K. Wilson and M. A. Omary, J. Phys. Chem. C, 2007, 111, 10689–10699 CAS.
- K. Fujisawa, S. Yamada, Y. Yanagi, Y. Yoshioka, A. Kiyohara and O. Tsutsumi, Sci. Rep., 2015, 5, 7934 CrossRef CAS PubMed.
- T. Seki, K. Sakurada, M. Muromoto and H. Ito, Chem. Sci., 2015, 6, 1491–1497 RSC.
- D. Perreault, M. Drouin, A. Michel, V. M. Miskowski, W. P. Schaefer and P. D. Harvey, Inorg. Chem., 1992, 31, 695–702 CrossRef CAS.
- K. H. Leung, D. L. Phillips, M. C. Tse, C. M. Che and V. M. Miskowski, J. Am. Chem. Soc., 1999, 121, 4799–4803 CrossRef CAS.
- R. G. Snyder, H. L. Strauss and C. A. Elliger, J. Phys. Chem., 1982, 86, 5145–5150 CrossRef CAS.
- C. K. Lee, M. J. Ling and I. J. B. Lin, Dalton Trans., 2003, 4731–4737 RSC.
- D. J. Abdallah, L. Lu, T. M. Cocker, R. E. Bachman and R. G. Weiss, Liq. Cryst., 2000, 27, 831–837 CrossRef CAS.
- S. J. Hsu, K. M. Hsu, M. K. Leong and I. J. B. Lin, Dalton Trans., 2008, 1924–1931 RSC.
- S.-H. Cha, J.-U. Kim, K.-H. Kim and J.-C. Lee, Chem. Mater., 2007, 19, 6297–6303 CrossRef CAS.
- V. N. Kozhevnikov, B. Donnio and D. W. Bruce, Angew. Chem., Int. Ed., 2008, 47, 6286–6289 CrossRef CAS PubMed.
- M. Krikorian, S. Liu and T. M. Swager, J. Am. Chem. Soc., 2014, 136, 2952–2955 CrossRef CAS PubMed.
- H. Schmidbaur and A. Schier, Chem. Soc. Rev., 2012, 41, 370–412 RSC.
Footnote |
| † Electronic supplementary information (ESI) available. CCDC 1523061 and 1523062. For ESI and crystallographic data in CIF or other electronic format see DOI: 10.1039/c6ra28294f |
| This journal is © The Royal Society of Chemistry 2017 |

