 Open Access Article
Creative Commons Attribution 3.0 Unported Licence
Optimizing the SERS enhancement of a facile gold nanostar immobilized paper-based SERS substrate†
Shuai He‡
a,
Jefri Chua‡a,
Eddie Khay Ming Tanb and
James Chen Yong Kah *ac
*ac
aDepartment of Biomedical Engineering, National University of Singapore, Singapore. E-mail: biekahj@nus.edu.sg
bTechnoSpex Pte. Ltd., Singapore
cNUS Graduate School for Integrative Sciences and Engineering, National University of Singapore, Singapore
First published on 14th March 2017
Abstract
While surface-enhanced Raman scattering (SERS) is a useful technique for the rapid and sensitive detection of biochemical compounds, conventional SERS chips suffer from high cost, complicated fabrication, inefficient sample collection processes and being not biocompatible. Here, we developed a facile, low-cost and highly sensitive gold nanostar (AuNS) immobilized paper-based SERS substrate that can be easily prepared in any laboratory. We performed studies on the paper materials, immobilization strategies, and SERS acquisition conditions to optimize the SERS enhancement and demonstrated that an optimized SERS signal was obtained from a dry substrate and wet analyte configuration suitable for rapid point-of-care detection. Using crystal violet (CV) as the Raman probe molecule, the optimized SERS substrate was prepared by having multiple drops of ∼100 pM of sodium citrate-treated colloidal AuNS on common laboratory filter paper before acquiring SERS spectra of CV freshly dripped onto the pre-dried AuNS-filter paper substrate. The optimized AuNS-filter paper substrate exhibited a SERS enhancement factor higher than that of two commercial Au/Ag-based SERS chips, with a detection limit of 1 nM CV and a SERS enhancement factor of up to 1.2 × 10⁷. Such an optimized dry substrate and wet analyte configuration meant that the paper-based SERS substrate could be stored before use and Raman acquisition could be performed immediately without the need for the sample to dry. This makes the AuNS-filter paper substrate a simple and low-cost tool for trace level detection of biochemical species in a rapid, sensitive and non-destructive manner.
Introduction
Surface-enhanced Raman scattering (SERS) is a useful analytical technique for detecting trace levels of biochemical analytes.1–3 Due to the strong plasmonic enhancement by noble metal nanostructures, single molecule identification has been demonstrated with SERS.4,5Since the morphology of these nanostructures determines their local electric field distribution and thereby the SERS efficiency, various morphologies have been studied both theoretically and empirically for optimization of SERS signals. Amongst various morphologies, gold nanostars (AuNS) with multiple branches and sharp tips that serve as SERS “hotspots” have exhibited higher SERS enhancement factors (EF) compared to nanospheres and nanorods,6–9 and are thus favored colloidal SERS substrates.
Numerous solid phase SERS substrates have also been fabricated from top-down and bottom-up approaches such as e-beam lithography, colloidal lithography, chemical vapour deposition and self-assembly,10–14 with SERS EF ranging from 104 to 1010. 3D SERS substrates such as photonic crystal fibers and nanoparticle-decorated porous alumina membranes that provide additional surface area within the source laser footprint11,15,16 and efficient light–matter interaction have also been developed.
While these solid phase SERS substrates exhibit excellent enhancement, their fabrication is sophisticated and costly. In addition, conventional SERS substrates based on silicon, glass, and porous alumina do not allow for easy and efficient sample collection process such as physical swabbing due to their non-conformal, rigid, and brittle nature.1
Solid phase SERS substrates based on paper with immobilized plasmonic nanostructures have been recently developed as a flexible, cost-effective, biodegradable, robust and disposable alternative with high sample collection efficiency and easy fabrication methodology.17,18 The porous surface of paper allows a higher adsorption of nanostructures compared to conventional 2D silicon and glass substrate.
Most studies use either laboratory filter paper17,19,20 or inkjet printing paper18,21 as the substrate material for various paper-based SERS applications, including a Pen-on-Paper scheme where plasmonic nanostructures are drawn and immobilized on the paper.22 Both types of paper comprised largely cellulose with small differences in composition and surface chemistry between them. Filter paper is generally more porous and less hydrophobic than printing paper. While a porous substrate provides a large surface area for immobilization of plasmonic nanoparticles (NPs) for SERS, a hydrophobic surface contains the plasmonic NPs in a localized spot to increase the concentration of immobilized NPs. No conclusion was made on which was a better choice as a substrate material since no study comparing the two paper materials18 for SERS optimization was made to date.
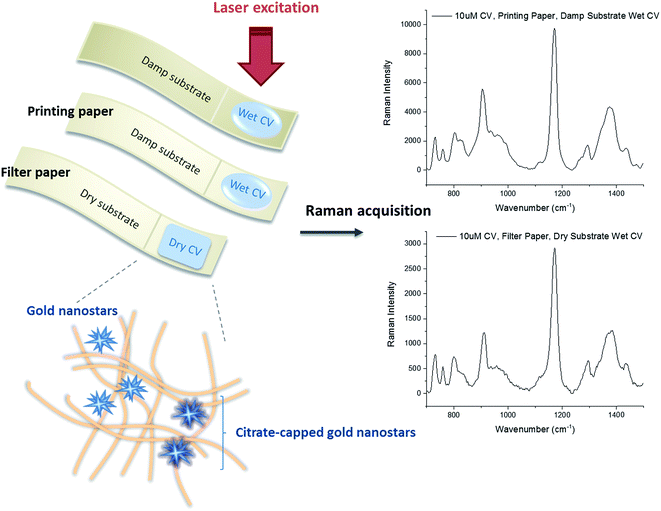
Despite the promise of paper-SERS substrates to replace commercial 2D SERS chips, no study on the immobilization approaches of plasmonic nanostructures and their SERS acquisition conditions for optimizing the SERS enhancement from paper-SERS substrates was also reported to date. These configurations could affect the translational value of paper-SERS substrate for rapid point-of-care detection. To elucidate these, we immobilized AuNS on both filter and printing paper either by varying the concentration of the AuNS colloidal solution dripped or the number of drips on paper. We used Crystal Violet (CV) as the Raman probe molecule, and acquired its SERS spectra on either the damp or dried AuNS-paper substrate (Scheme 1).
We found that filter paper substrates with AuNS immobilized from multiple drips on paper resulted in a SERS EF higher than that of printing paper, as well as two commercial Au/Ag-based SERS chips. SERS enhancement was also the highest when AuNS-filter paper substrate was dried and CV was wet during Raman acquisition, demonstrating commercial viability where the dried substrates could be stored and rapid SERS measurement could be acquired immediately without the need to dry the analyte. This makes the AuNS-paper substrate a promising platform for easy-to-prepare and cost-effective Raman analytics.
Materials and methods
All reagents were purchased from Sigma Aldrich unless specified otherwise. Milli-Q water with a resistivity of 18.2 MΩ cm was used for all experiments. Laboratory filter discs (FT-3-205-240, Sartorius AG, Germany) and A4 printing paper (Double A, Singapore) were used as the substrate material for immobilization of AuNS. Each paper substrate has a dimension of 0.8 cm × 1.5 cm. Two commercial Au/Ag-based SERS chips (silver substrate “RANDA”, ATO ID, Lithuania; paper-based gold nanoparticle substrate “RAM-SERS-Au”, Ocean Optics, USA) were purchased for benchmarking purpose.Synthesis and characterization of AuNS
AuNS were synthesized using an SERS-optimized one-pot seedless protocol by reducing gold(III) chloride (HAuCl4) with L-ascorbic acid (C6H8O6) in the presence of silver nitrate (AgNO3).9 Briefly, 36 μL of 10 mM HAuCl4 and 2 μL of 10 mM AgNO3 (Au3+/Ag+ = 18) were added into 1 mL of Milli-Q water. The solution was mixed under vortex for 10 s before 6 μL of 100 mM aqueous C6H8O6 was added rapidly to the mixture and vortexed for another 20 s. The solution turned from colorless to greenish blue as the AuNS were formed by reduction of HAuCl4 with C6H8O6.The optical properties of AuNS were characterized by UV-Vis spectroscopy (MultiSkan GO, Thermo Fisher Scientific Inc., USA). Their zeta potential (ζ) and hydrodynamic diameter (DH) were measured at 25 °C using a Zetasizer (Nano ZS, Malvern, UK). The morphology of AuNS was characterized using transmission electron microscopy (TEM) (JEM-1220, JEOL Ltd., Japan). The concentration of AuNS in the solution was estimated by mass calculation to be ≈10 pM. Briefly, Au3+ ions were assumed to be completely reduced to AuNS, hence the approximate concentration was determined by dividing the total mass of available Au by mass of one AuNS, whose size was obtained from the DH and density was known to be 19.3 g cm−3.
The AuNS were washed and concentrated in 100 μL of water by centrifugation at 1500 rpm for 20 min. The concentration of final AuNS solution before immobilization onto paper substrates was ∼100 pM.
Sodium citrate capping of synthesized AuNS
Trisodium citrate (Na3C6H5O7) was added to the synthesized AuNS following a reported protocol20 with slight modifications before immobilizing the AuNS onto the paper substrates to improve their adsorption on paper. Briefly, 100 μL of 34 mM Na3C6H5O7 was added into 1 mL of synthesized AuNS solution and kept for 30 min. AuNS was then centrifuged at 1500 rpm for 20 min. The supernatant was removed and the AuNS were resuspended in 100 μL of 68 mM Na3C6H5O7 for subsequent immobilization on paper.Immobilization of AuNS on paper substrate
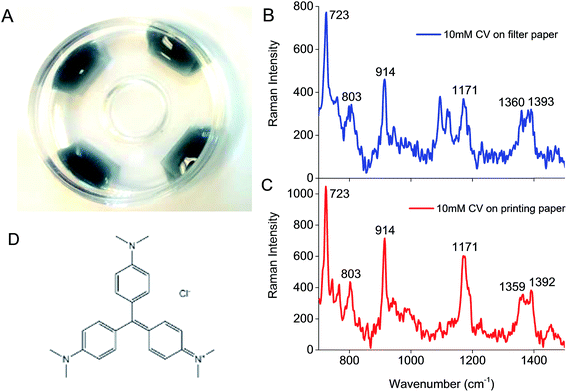
100 μL of 100 pM AuNS solution, with or without Na3C6H5O7, was dripped onto each paper substrate (both filter and printing paper) kept in a Petri dish, which could completely cover a 0.8 cm × 1.5 cm paper substrate (Fig. 1A). The Petri dish was then covered and left overnight at room temperature before the Raman spectra of crystal violet (CV) as our model Raman probe analyte was acquired.CV is a common Raman reporter with a molecular structure shown in Fig. 1D. It possessed a strong Raman signature after laser excitation at the visible-near infrared (Vis-NIR) region. Two groups of modes were observed in the Raman spectra of 10 mM CV on both types of paper, including modes associated with (1) nitrogen atoms (N-phenyl stretching, 1350–1400 cm−1), and (2) phenyl rings (skeletal ring vibrations and ring C–H deformations at 700–1300 cm−1, and ring C–C stretching modes above 1400 cm−1)6,23 (Fig. 1B and C).
The characteristic CV peak at 1171 cm−1 (ring C–H deformations) was used as the reference to calculate the SERS EF. Raman spectrum of CV on filter paper also presented two strong peaks at 1095 and 1122 cm−1 (Fig. 1B, unlabeled) corresponding to ring and C–O stretching modes in the structure of cellulose.24,25 To ensure observable CV peak at 1171 cm−1 for all experiments, 10 μM CV was used for SERS measurements.
While a number of paper-based SERS studies have been reported, the Raman acquisition conditions were not studied. The effect of wet or dry acquisition conditions on the SERS enhancement remained unknown and we therefore examined the SERS EF of AuNS-paper substrate in two (damp or dried) configurations. In the first configuration, the damp AuNS-paper substrate was used for SERS. Briefly, 5 μL of 10 μM CV solution was dripped in the center of the substrate, prepared from either laboratory filter discs or printing paper, while the substrate was still damp after overnight soaking of paper in AuNS colloid. In the second configuration, the AuNS-paper substrate was dried completely in a vacuum pump for 1 h before 5 μL of 10 μM CV solution was dripped on the substrate.
In both configurations, the Raman spectra of CV were acquired either immediately while the CV was still wet on the AuNS-paper substrate or after CV was dried on the AuNS-paper substrate in a vacuum pump for 1 h. In summary, there were a total of four conditions for SERS acquisition: dry substrate-dry CV, dry substrate-wet CV, damp substrate-dry CV and damp substrate-wet CV.
Varying amount of AuNS immobilized on paper substrate
We also compared two approaches to increase the immobilization of AuNS on the paper substrate for further SERS enhancement. First, we double-immobilized AuNS on paper by dripping another 100 μL of 100 pM AuNS solution on a previously dripped AuNS-paper substrate, and allowing another overnight immobilization of AuNS on the AuNS-paper substrate, followed by a repeated drying process. Second, we repeated the single AuNS drip immobilization process with a doubled AuNS concentration of ∼200 pM instead of 100 pM. This allowed us to compare if multiple drips of a lower AuNS concentration is more effective than single drip of a higher AuNS concentration in enhancing the Raman signal of CV.Acquisition of Raman spectra and SERS enhancement factor
All the Raman spectra in this study were acquired using a Raman spectroscopy system (uRaman-785 -Ci, TechnoSpex Pte. Ltd., Singapore) (Fig. S1†). Frequency stabilized laser at wavelength of 785 nm with linewidth approximately 100 MHz was used to excite the sample. This laser wavelength, which is far from the fluorescence excitation wavelength of paper, could minimize the generation of unwanted autofluorescence.17 The system was equipped with a TEC-cooled 2048 pixel CCD detector. The spectral resolution of the system was measured to be ∼8.6 cm−1 and the spectra range span between 150 cm−1 and 2400 cm−1. The laser optical power at the sample was ∼13 mW using the Plan Apo Lambda 20× objective with a numerical aperture of 0.75.In acquiring the Raman spectra, the AuNS-paper substrate with CV was fixed on a quartz glass slide (SLID-Q-0762-0254-0100, Singapore Optics Shop, Singapore) and the laser beam was focused at the CV spot with an integration time of 10 s. The acquisition process was repeated multiple times (N = 8) at different regions of the analyte spot to determine the average Raman spectrum under each condition so as to account for small variations in the concentration of immobilized AuNS on paper. The bulk Raman spectra of CV on the paper substrate without immobilized AuNS were acquired in the same manner. The raw Raman spectra were processed using MATLAB to remove the autofluorescence by third order polynomial fitting. The SERS EF was then determined as shown below:6,20,26
This simplified formula was also applied to calculate the SERS EF of CV obtained from two commercial Au/Ag-based SERS chips (silver substrate “RANDA”, ATO ID, Lithuania; paper-based gold nanoparticle substrate “RAM-SERS-Au”, Ocean Optics, USA) for comparison. Here, the SERS spectra of 10 μM CV on commercial SERS chips were acquired and the Raman intensity of CV at 1171 cm−1 after autofluorescence removal was used for calculation of SERS EF.
Results and discussion
Synthesis and characterization of AuNS
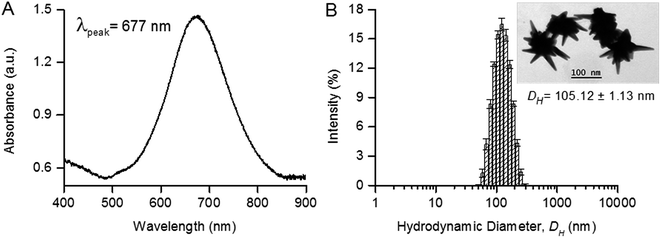
AuNS were synthesized by a SERS-optimized one-pot protocol using ascorbic acid as the reducing agent and silver nitrate as the shaping agent.9 The synthesized AuNS showed a surface plasmon resonance (SPR) peak at 677 nm, with a DH of 105.12 ± 1.13 nm, and surface charge of −29.30 ± 1.17 mV (Fig. 2A). The SPR of AuNS was determined by a series of parameters including their size, shape and dielectric property of surrounding medium.13,28 In most applications, the SPR peak was typically near to the laser excitation wavelength for strong plasmon excitation and high local field enhancements.29 While perfect matching would induce strong resonance effect, the SERS enhancement would suffer from signal loss due to the background absorption and presence of unwanted fluorescence. On the other hand, AuNS with a SPR slightly blue-shifted from the optical excitation of 785 nm has been reported to generate the strongest SERS enhancement.8 The negative surface charge provided charge stabilization on colloidal AuNS, although this might hinder their immobilization on paper substrate subsequently.Multiple sharp spikes of synthesized AuNS were observed under TEM (Fig. 2B). As SERS from plasmonic nanostructures originates predominantly from electromagnetic enhancement and to a lesser extent from chemical enhancement,30 the sharp spikes on AuNS were morphological features with a strong localized electromagnetic field and thus served as SERS “hot spots”.6 Studies have shown that AuNS exhibited a higher SERS enhancement both in colloid and after immobilization on paper substrate compared to gold nanospheres or gold nanorods.6,20 Therefore, we chose the AuNS which we optimized previously9 as the plasmonic nanoparticles to immobilize for paper-SERS substrate in this study.
SERS on AuNS-paper substrate
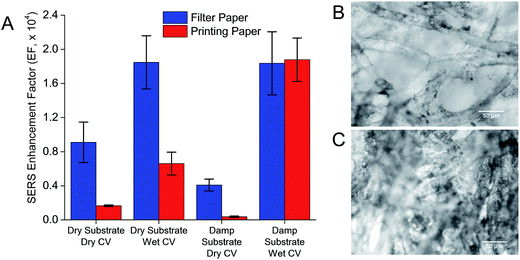
The use of paper as a low-cost, biocompatible, and biodegradable diagnostic platform suitable for resource-scarce regions and point-of-care detection has gained much interest.31,32 Filter paper and printing paper are two commonly used materials for preparing paper-SERS substrate. We measured the SERS enhancement of AuNS-paper substrate made from these two materials for all four configurations. Except for the damp substrate-wet CV configuration where SERS enhancement was comparable, filter paper substrates, in general, generated significantly higher SERS enhancement than printing paper (p < 0.005, student's t-test) (Fig. 3A). While both types of paper consisted of interwoven fibrous strands, there were differences in the micro-scale morphology between filter and printing paper,18 where filter paper showed a larger pore size and lower microfiber density (Fig. 3B) compared to printing paper (Fig. 3C). Filter paper with high porosity increased the absorbency of AuNS colloid, while printing paper with lower porosity increased AuNS holdout in the paper, ensuring that the colloid seep less easily into the paper. The higher porosity in filter paper favored not just the penetration of AuNS into the paper fiber for immobilization, but also the penetration of light into the fiber to optically excite the AuNS immobilized deeper in the microfibers, thus generating higher SERS EF.In point-of-care detection, it is often important that a reading can be acquired as soon as the sample is applied to minimize waiting time. In this case, the acquisition of SERS while CV was still wet on paper resulted in significantly higher SERS enhancement compared to CV that was dried in vacuum pump (p < 0.05, student's t-test). This was true for both filter and printing paper, and could be attributed to a decrease in the dielectric constant, εr around AuNS upon dehydration of the CV (εwater = 1.77; εair = 1.00), which resulted in a blue-shifted SPR33 of AuNS away from the laser excitation wavelength and thus a lower SERS EF. The dehydration of CV could have also decreased the specific heat capacity of the substrate, which led to overheating of the paper substrate due to the photothermal effect of AuNS, and consequently reduction in the SERS enhancement.34 This meant that rapid acquisition of the Raman spectrum could be achieved without having to wait for the samples to dry on the AuNS-paper substrate.
In acquiring the SERS of wet CV on filter paper, we also found that the EF was not affected by the hydration of AuNS-paper substrate (EF for both cases ≈ 1.84 × 10⁴). This showed that the AuNS-filter paper substrate could be prepared and stored in dry form for point-of-care use without compromising its EF. The independence of EF from the hydration of AuNS-paper substrate could be due largely to the porosity and hydrophilicity of the filter paper where the CV solution could penetrate the fibers and interact with the AuNS even if the AuNS-paper substrate was previously dried. In contrast, the SERS EF of wet CV on printing paper was higher on a damp AuNS-paper substrate (EF = 1.88 × 10⁴) compared to the dried one (EF = 0.66 × 10⁴). This could be due to the denser microfibers and hydrophobic surface of dried printing paper that slowed the penetration of CV solution and subsequent interactions with the immobilized AuNS. The presence of moisture in the damp AuNS-paper substrate presented a continuous medium that facilitated the penetration of CV solution.
Effect of sodium citrate capping on AuNS
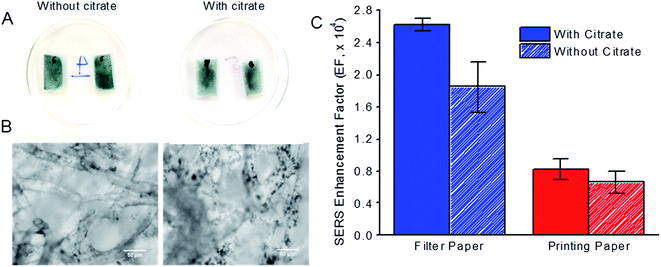
Using a dry substrate-wet CV configuration in Raman acquisition, we examined the effect of sodium citrate on the SERS enhancement of CV by AuNS. In the synthesis of small spherical gold nanoparticles (AuNPs), sodium citrate was often used both as a reducing and capping agent on AuNPs due to the negatively charge cloud of citrate ions that conferred charge stabilization. The presence of citrate as a capping agent on AuNS has been shown previously to improve the adsorption of AuNS on paper and increase their SERS enhancement.20On addition of sodium citrate to AuNS, we observed that the citrate-treated AuNS immobilized on filter paper substrate was paler and less uniformly distributed on the papers compared to non-citrate treated AuNS immobilized on the same paper substrates (Fig. 4A). We observed larger and more AuNS clusters (indicated by the black spots) on the microfibers of filter paper under the microscope when sodium citrate was incorporated (Fig. 4B, right). Similar observations were made for AuNS-paper SERS substrates prepared from printing paper (data not shown).
With a dry substrate-wet CV configuration in Raman acquisition, we found that the presence of sodium citrate as a capping agent on AuNS increased their SERS enhancement of CV on both filter and printing paper (Fig. 4C). For filter paper, the EF increased from 1.85 × 10⁴ without sodium citrate to 2.63 × 10⁴ in the presence of sodium citrate. Such an increase in the EF could be attributed to more large AuNS clusters immobilized on paper microfibers after citrate treatment as observed under the microscope (Fig. 4B). Furthermore, aggregation of nanoparticles was also known to produce SERS “hotspots” with strong SERS enhancement,4,35,36 where the nanogaps formed in the AuNS clusters from aggregation induced by sodium citrate created regions of intense SERS hotspots. Similar increase in EF from 0.66 × 10⁴ to 0.83 × 10⁴ was also observed for printing paper, although the increase in EF was less significant due to more compact microstructure and smaller pore size of printing paper, which hindered the immobilization of aggregated AuNS clusters on deeper microfibers.
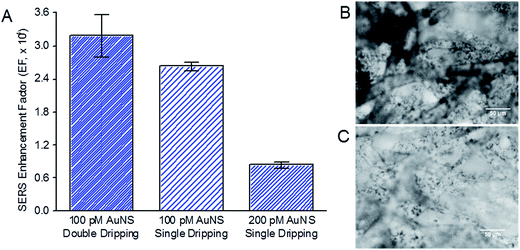
Increased immobilization of AuNS
We next examined two approaches to further increase the amount of AuNS immobilized on filter paper substrate and thereby further enhancing SERS. First, we double-dripped 100 pM of citrate-capped AuNS on filter paper with vacuum drying of the AuNS-paper substrate after each drip. Despite a longer substrate preparation time of more than a day to allow drying of the previous drip, the SERS EF increased from 2.63 × 10⁴ for single drip to 3.18 × 10⁴ for double drip (Fig. 5A). This was due to the noticeably higher density of AuNS immobilized on the microstructures of the filter paper from double dripping (Fig. 5B) compared to a single drip (Fig. 5C).In the second approach, we doubled the AuNS concentration in a single drip to 200 pM. In this case, we observed an unexpected decrease in SERS EF from 2.63 × 10⁴ for 100 pM to 0.84 × 10⁴ for 10 μM of CV (Fig. 5A). This drop in SERS EF was likely due to the AuNS aggregating out of solution at a higher concentration in the presence of sodium citrate before they were immobilized on the paper substrate. Aggregation has been shown to increase with higher nanoparticle concentration due to increased collision frequency between nanoparticles.37 The large AuNS precipitates were unable to penetrate through the pores between paper microfibers and immobilize efficiently on paper microfibers, resulting in a much lower effective concentration of AuNS loaded on the paper microfibers, and a consequently weaker SERS enhancement than expected.
Comparison to commercial SERS substrates
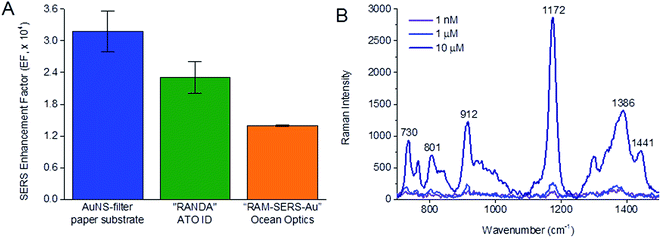
The SERS EF of 10 μM CV obtained from AuNS-filter paper substrate prepared using double drip of 100 pM citrate-capped AuNS was compared to that of two commercially available Au/Ag-based SERS chips, to demonstrate the performance of our AuNS-paper SERS substrate over commercial SERS substrates. In contrast to the facile preparation of our AuNS-filter paper substrate, the preparation of commercial SERS substrates was more complex. The active SERS area of silver substrate “RANDA” from ATO ID was fabricated using an ultra-short pulse laser ablation directly on a silver-coated soda-lime glass substrate to produce stochastic nanopattern. The active SERS area of gold substrate “RAM-SERS-Au” from Ocean Optics was fabricated using industrial deposition techniques to deposit gold nanoparticles onto paper followed by immobilization on borosilicate glass substrate.Both commercial SERS chips had a lower SERS EF of 2.31 × 10⁴ for “RANDA” from ATO ID and 1.39 × 10⁴ for “RAM-SERS-Au” from Ocean Optics compared to the AuNS-filter paper SERS substrate prepared from double dripping of 100 pM AuNS (EF = 3.18 × 10⁴) (Fig. 6A). The high SERS EF of AuNS-filter paper substrate came from a good combination of citrate-capped AuNS as the plasmonic nanoparticles and filter paper as the substrate material that allowed good immobilization of the AuNS in a 3D paper matrix as opposed to a 2D glass substrate in the commercial SERS chip. Here, the spiky morphology of AuNS compared to roughened Ag surface and spherical AuNPs generated stronger localized electromagnetic field for SERS enhancement. Furthermore, the numerous cellulose microfibers of filter paper could extend the surface area for AuNS immobilization and the 3D microstructure could enable more efficient interaction between light and AuNS, as well as AuNS and CV molecules for SERS enhancement.
Based on our optimized SERS acquisition configuration of dry substrate-wet CV with incorporation of sodium citrate on AuNS-filter paper substrate, we further decreased the CV concentration in SERS measurements to determine the detection limit of our AuNS-filter substrate. We found that the characteristic Raman peak of CV at 1171 cm−1 was still detectable at a CV concentration of 1 nM (Fig. 6B). Based on this reduced concentration of 1 nM instead of 10 μM, we achieved an EF of 1.2 × 10⁷. This level of enhancement made the AuNS-filter paper substrate an attractive SERS substrate that can be easily prepared in any laboratory for sensitive detection of trace analytes. We showed also that strong SERS enhancement was achieved with another analyte probe, doxorubicin, a small molecule anti-cancer drug, where all the Raman peaks known to be present in the molecule were strongly enhanced38–40 (Fig. S2 and Table S1†). By mixing doxorubicin with CV, we were still able to analyze the characteristic Raman peaks of both analytes (Fig. S2†). This demonstrated that the facile AuNS immobilized paper-based SERS substrate was not only applicable to other molecular analytes apart from CV, but was also feasible in analyzing a panel of analytes in multiplex.
Conclusion
We have demonstrated that a low-cost AuNS-paper SERS substrate prepared by immobilizing AuNS on common laboratory filter paper was able to achieve a SERS EF that was higher than two commercial SERS substrates. This was achieved by dripping 100 pM of citrate-capped AuNS twice on the filter paper and allowing the substrate to be dried completely before dripping the analyte on the substrate and acquiring the SERS immediately. With this setup, we were able to achieve an EF of up to 1.2 × 10⁷ using CV as our test analyte. While many paper-based SERS studies dried the analytes before Raman acquisition, we found that the SERS enhancement was stronger when the analyte was still wet. The low cost and ease of preparation make this AuNS-paper substrate a convenient and attractive alternative substrate which every common laboratory can prepare for rapid and sensitive trace level detection of chemical analytes or biological diagnostic applications in a non-destructive manner using SERS.Author contributions
The manuscript was written through contributions of all authors. All authors have given approval to the final version of the manuscript.Acknowledgements
Funding was from the MOE AcRF Tier 1 Grant R-397-000-179-112. S He would like to acknowledge the scholarship support from National University of Singapore Department of Biomedical Engineering. We also acknowledge the graphical abstract by Justyna Karolczak.References
- C. H. Lee, L. Tian and S. Singamaneni, ACS Appl. Mater. Interfaces, 2010, 2, 3429–3435 CAS.
- S. Shanmukh, L. Jones, J. Driskell, Y. Zhao, R. Dluhy and R. A. Tripp, Nano Lett., 2006, 6, 2630–2636 CrossRef CAS PubMed.
- K. W. Kho, J. C. Y. Kah, C. G. L. Lee, C. J. R. Sheppard, Z. X. Shen, K. C. Soo and M. C. Olivo, J. Mech. Med. Biol., 2007, 07, 19–35 CrossRef.
- K. Kneipp, Y. Wang, H. Kneipp, L. T. Perelman, I. Itzkan, R. R. Dasari and M. S. Feld, Phys. Rev. Lett., 1997, 78, 1667 CrossRef CAS.
- S. Nie and S. R. Emory, Science, 1997, 275, 1102–1106 CrossRef CAS PubMed.
- E. Nalbant Esenturk and A. Hight Walker, J. Raman Spectrosc., 2009, 40, 86–91 CrossRef.
- S. Abalde-Cela, P. Aldeanueva-Potel, C. Mateo-Mateo, L. Rodríguez-Lorenzo, R. A. Alvarez-Puebla and L. M. Liz-Marzán, J. R. Soc., Interface, 2010, 7, S435–S450 CrossRef CAS PubMed.
- H. Yuan, A. M. Fales and T. Vo-Dinh, J. Am. Chem. Soc., 2012, 134, 11358–11361 CrossRef CAS PubMed.
- S. He, M. W. C. Kang, F. J. Khan, E. K. M. Tan, M. A. Reyes and J. C. Y. Kah, J. Opt., 2015, 17, 114013 CrossRef.
- M. E. Stewart, C. R. Anderton, L. B. Thompson, J. Maria, S. K. Gray, J. A. Rogers and R. G. Nuzzo, Chem. Rev., 2008, 108, 494–521 CrossRef CAS PubMed.
- H. Ko, S. Chang and V. V. Tsukruk, ACS Nano, 2008, 3, 181–188 CrossRef PubMed.
- J. P. Camden, J. A. Dieringer, J. Zhao and R. P. Van Duyne, Acc. Chem. Res., 2008, 41, 1653–1661 CrossRef CAS PubMed.
- J. N. Anker, W. P. Hall, O. Lyandres, N. C. Shah, J. Zhao and R. P. Van Duyne, Nat. Mater., 2008, 7, 442–453 CrossRef CAS PubMed.
- M. J. Banholzer, J. E. Millstone, L. Qin and C. A. Mirkin, Chem. Soc. Rev., 2008, 37, 885–897 RSC.
- A. G. Brolo, E. Arctander, R. Gordon, B. Leathem and K. L. Kavanagh, Nano Lett., 2004, 4, 2015–2018 CrossRef CAS.
- S. Chang, H. Ko, S. Singamaneni, R. Gunawidjaja and V. V. Tsukruk, Anal. Chem., 2009, 81, 5740–5748 CrossRef CAS PubMed.
- C. H. Lee, M. E. Hankus, L. Tian, P. M. Pellegrino and S. Singamaneni, Anal. Chem., 2011, 83, 8953–8958 CrossRef CAS PubMed.
- R. Zhang, B.-B. Xu, X.-Q. Liu, Y.-L. Zhang, Y. Xu, Q.-D. Chen and H.-B. Sun, Chem. Commun., 2012, 48, 5913–5915 RSC.
- C. H. Lee, M. E. Hankus, L. Tian, P. M. Pellegrino and S. Singamaneni, SPIE Defense, Security, and Sensing, 2012 Search PubMed.
- D. Mehn, C. Morasso, R. Vanna, M. Bedoni, D. Prosperi and F. Gramatica, Vib. Spectrosc., 2013, 68, 45–50 CrossRef CAS.
- W.-J. Liao, P. K. Roy and S. Chattopadhyay, RSC Adv., 2014, 4, 40487–40493 RSC.
- L. Polavarapu, A. L. Porta, S. M. Novikov, M. Coronado-Puchau and L. M. Liz-Marzán, Small, 2014, 10, 3065–3071 CrossRef CAS PubMed.
- E. J. Liang, X. L. Ye and W. Kiefer, J. Phys. Chem. A, 1997, 101, 7330–7335 CrossRef CAS.
- S. Eichhorn, M. Hughes, R. Snell and L. Mott, J. Mater. Sci. Lett., 2000, 19, 721–723 CrossRef CAS.
- N. Gierlinger, S. Luss, C. König, J. Konnerth, M. Eder and P. Fratzl, J. Exp. Bot., 2010, 61, 587–595 CrossRef CAS PubMed.
- Q. Su, X. Ma, J. Dong, C. Jiang and W. Qian, ACS Appl. Mater. Interfaces, 2011, 3, 1873–1879 CAS.
- Y. Dong, S. V. Pappu and Z. Xu, Anal. Chem., 1998, 70, 4730–4735 CrossRef CAS.
- P. N. Njoki, I.-I. S. Lim, D. Mott, H.-Y. Park, B. Khan, S. Mishra, R. Sujakumar, J. Luo and C.-J. Zhong, J. Phys. Chem. C, 2007, 111, 14664–14669 CAS.
- Y. H. Kwon, R. Ossig, F. Hubenthal and H. D. Kronfeldt, J. Raman Spectrosc., 2012, 43, 1385–1391 CrossRef CAS.
- C. G. Khoury and T. Vo-Dinh, J. Phys. Chem. C, 2008, 112, 18849–18859 CAS.
- A. W. Martinez, S. T. Phillips, E. Carrilho, S. W. Thomas III, H. Sindi and G. M. Whitesides, Anal. Chem., 2008, 80, 3699–3707 CrossRef CAS PubMed.
- A. K. Ellerbee, S. T. Phillips, A. C. Siegel, K. A. Mirica, A. W. Martinez, P. Striehl, N. Jain, M. Prentiss and G. M. Whitesides, Anal. Chem., 2009, 81, 8447–8452 CrossRef CAS PubMed.
- K. L. Kelly, E. Coronado, L. L. Zhao and G. C. Schatz, J. Phys. Chem. B, 2003, 107, 668–677 CrossRef CAS.
- A. Berthod, J. Laserna and J. Winefordner, J. Pharm. Biomed. Anal., 1988, 6, 599–608 CrossRef CAS PubMed.
- H. Xu, E. J. Bjerneld, M. Käll and L. Börjesson, Phys. Rev. Lett., 1999, 83, 4357 CrossRef CAS.
- K. Kneipp, H. Kneipp, V. B. Kartha, R. Manoharan, G. Deinum, I. Itzkan, R. R. Dasari and M. S. Feld, Phys. Rev. E: Stat. Phys., Plasmas, Fluids, Relat. Interdiscip. Top., 1998, 57, R6281 CrossRef CAS.
- Y. T. He, J. Wan and T. Tokunaga, J. Nanopart. Res., 2008, 10, 321–332 CrossRef CAS.
- M. Y. S. Alam, Development of an Electrochemical Aptasensor for Indirect Detection of Target Protein, Doctoral dissertation, Saint Mary's University, 2015.
- C. Eliasson, A. Lorén, K. Murty, M. Josefson, M. Käll, J. Abrahamsson and K. Abrahamsson, Spectrochim. Acta, Part A, 2001, 57, 1907–1915 CrossRef CAS.
- B. Kang, M. M. Afifi, L. A. Austin and M. A. El-Sayed, ACS Nano, 2013, 7, 7420–7427 CrossRef CAS PubMed.
Footnotes |
| † Electronic supplementary information (ESI) available. See DOI: 10.1039/c6ra28450g |
| ‡ These authors contributed equally. |
| This journal is © The Royal Society of Chemistry 2017 |

