 Open Access Article
Creative Commons Attribution 3.0 Unported Licence
Choline chloride–zinc chloride ionic liquid as a green template for the sol–gel synthesis of mesoporous titania
T. Preethi ,
M. P. Padmapriya,
B. Abarna and
G. R. Rajarajeswari*
Department of Chemistry, College of Engineering, Anna University, Guindy, Chennai-600025, India. E-mail: rajiaravind@gmail.com; Tel: +91 2235 8657
First published on 6th February 2017
Abstract
Utilization of organic templates for the synthesis of structure- and morphology-controlled solids is being researched extensively. Use of green templates provides advantages in the form of easy processability and less toxicity compared to conventional chemical templates, in addition to customizable mesoporous network structures in solids. In this regard, the present work aimed at assessing the influence of choline chloride–zinc chloride ionic liquid (IL) in controlling the crystallite characteristics and improving the surface properties of sol–gel derived nanotitania. Thermal, surface area, porosity, crystallinity, chemical composition, textural and morphological characterizations of the IL templated titania are described in the present work. XRD results showed that all IL templated titania samples possessed anatase structure. The sample prepared using 2 mL of IL with 9 mL of titanium tetraisopropoxide (ILT-2) possessed uniformly dispersed, spherical particles with an average particle size of 13.2 nm and a surface area of 75.1 m2 g−1. A moderate red shift of the absorption profile of titania was also observed. Among the synthesized samples, ILT-2 exhibited the highest photocatalytic activity for the degradation of 4-chlorophenol under UV irradiation. The ability of the choline chloride–zinc chloride IL to offer very good control over the growth of titania particles together with its easy removal make it a potential green template for the sol–gel synthesis of mesoporous solids.
1. Introduction
Semiconductor-mediated photocatalysis has been extensively studied and widely accepted as an effective treatment option for air and water pollution abatement. Titanium dioxide is the most preferred photocatalyst for the degradation of organic pollutants into harmless compounds, due to its advantages like non-toxicity, chemical stability, reusability and easy availability.1–4 The perceived limitations of titania, such as low surface area, low porosity and very low visible light absorption capacity, are being constantly addressed by adopting suitable solid state synthetic techniques. The predominant procedures to improve the surface and optical properties of titania include, but are not limited to, template-assisted synthesis,5 metal and non-metal doping,6 dye sensitisation and coupling with other semiconductor oxide/sulphide systems.7 In general, imparting mesoporosity and large surface area has been found to enhance the photocatalytic degradation efficiency of titania.8 Template-directed synthesis of titania often leads to mesoporous networks with a wide range of pore sizes, well-defined morphologies with controlled crystallite size and high surface area. Template-mediated sol–gel synthesis of metal oxides has many advantages, such as mild chemical conditions, yield of highly pure products, room temperature preparation, and cost effectiveness in the production of materials with desirable surface and optical characteristics. While organic surfactants, dendrimers and polymers are used as soft templates, voids of pre-formed mesoporous solids are used as hard templates, to synthesize mesoporous titania. Use of templates with low environmental impact provides advantages in the form of easy processability and less toxicity, in addition to customizable mesoporous network structures in solids. A number of materials, such as gelatin, gum, starch, rice straw, rubber latex, pollen grain, egg shell membrane, bamboo, yeast and chitosan, have been explored as greener alternatives to chemical templates.9Recently, ionic liquids (ILs) have garnered considerable attention as catalytic and template materials.10 Their low melting point, high boiling point, low vapor pressure, and good thermal and chemical stabilities can promote the preparation of a new generation of chemical nanostructures possessing high porosity and crystallinity, through mild reaction pathways.11 Chen et al.12 prepared mesoporous anatase titania particles with high photocatalytic activity using [Bmim]Br (1-methyl-3-butylimidazolium bromide) IL–starch combination as a structure-directing agent. Mesoporous anatase titania with good surface area has been synthesized using imidazolium-based ILs such as [Bmim]PF6, [Bmim]BF4, [C4mim]BF4, [C6mim]Br and 1-(3-hydroxypropyl)-3-methylimidazolium-bis(trifluoromethylsulfonyl)amide at low temperature without calcinations.13–16 However, most of the imidazolium-based ILs are highly toxic, expensive to prepare and highly sensitive to water.17,18 Replacement of the imidazolium-based ILs by an eco-friendly alternative will be of great significance, as it will offer a greener synthetic route. From this viewpoint, choline chloride-based ILs, possessing desirable characteristics such as non-toxicity, water solubility, air and moisture stability and reusability, offer a great potential to be explored for the green synthesis of organic chemicals and inorganic solids.19 Cooper Emily et al.20 have used choline chloride/urea as a template to synthesize new porous zeo-type framework. Ge et al.21 synthesized flower-like hierarchical BiOCl structures in the presence of a eutectic mixture of choline chloride and urea through a solvothermal process. Navneet kaur et al.22 used choline chloride ionic salt as a structure-directing agent and source of nitrogen to prepare visibly active titania. Choline chloride being hygroscopic, changes into liquid state upon holding moisture at room temperature. By transforming choline chloride into IL form its physical state does not change. This makes the IL superior for handling as a template. Many templates will lose their identity upon calcination but IL offers the advantage of easy recoverability and reuse. Liana et al.23 reported choline chloride-based IL-assisted titania synthesis using an electrochemical process. The reported study used choline chloride–ethylene glycol and choline chloride–urea as synthesis medium and achieved anodically prepared titania with 8–18 nm crystallite size and 70 to 90 m2 g−1 surface area.
In the present study, we have explored the efficiency of choline chloride–zinc chloride (ChCl·xZnCl2) IL as a green template to synthesize highly crystalline mesoporous anatase nanotitania. Influence of the IL template on the surface, optical and photocatalytic characteristics of titania has been investigated.
2. Experimental
2.1 Materials
Titanium tetraisopropoxide (TTIP) (99%) and 4-chlorophenol (4-CP) (98%) were obtained from Spectrochem. Acetic acid and isopropyl alcohol (99%) were purchased from Scientific Research Laboratories (SRL). Choline chloride (98%) was obtained from Alfa Aesar and zinc chloride was obtained from Merck. These chemicals were used as received without further purification. Double distilled water was used in all the experiments.2.2 Preparation of IL ([ChCl][ZnCl2]2)
Choline chloride–zinc chloride ionic liquid was synthesized by the preparation method reported by Duan et al.17 Choline chloride was mixed with zinc chloride in a molar ratio of 1![[thin space (1/6-em)]](https://www.rsc.org/images/entities/char_2009.gif) :
:![[thin space (1/6-em)]](https://www.rsc.org/images/entities/char_2009.gif) 1. The mixture was then heated to about 100 °C with constant stirring to get a colourless liquid.
1. The mixture was then heated to about 100 °C with constant stirring to get a colourless liquid.
2.3 Preparation of titania catalysts
TTIP (9 mL) was added to isopropanol (60 mL) under vigorous stirring and the solution was stirred for 1 hour. In a separate beaker, various amounts of IL (1 to 3 mL) were mixed with 2% acetic acid (30 mL) under stirring for 30 min followed by the addition of distilled water to the solution. Hydrolysis and condensation reactions took place when the latter solution was added drop-by-drop to the former solution with continuous stirring for 2 hours to obtain a homogeneous colloidal sol. The resulting sol was kept for 12 hours of ageing to obtain a gel. The gel was then washed with ethyl acetate and water to remove ionic liquid template and the product was filtered and dried in an air oven at 100 °C for two hours. The powder obtained was calcined at 500 °C for two hours under air.The product formed before washing with ethyl acetate and water was designated as ILT-A. The as-synthesized product obtained after washing with ethyl acetate and water and drying was designated as ILT-B. The calcined IL templated titania photocatalysts obtained by adding 1, 2 and 3 mL of IL as mentioned above were designated as ILT-1, ILT-2 and ILT-3, respectively.
2.4 Characterization of synthesized catalysts
Powder X-ray diffraction analysis of the synthesized catalysts was conducted with an X-ray diffractometer (PANalytical X'pert Pro) using Cu Kα (λ = 0.154 nm) radiation to study the crystalline structure of the synthesized catalysts and their crystallite size. The diffractograms were recorded in 2θ range between 10 and 80°. FT-IR measurements for synthesized samples were performed using a PerkinElmer spectrophotometer using the KBr pellet technique. The pellet was subjected to scanning in the range of 4000–400 cm−1. The morphology and chemical composition of the synthesized catalysts were observed by a scanning electron microscope (SEM) equipped with energy dispersive X-ray microanalysis (EDX) (Quanta 200 ESEM). UV diffuse reflectance spectroscopy (Shimadzu UV 2450) was used to study absorption maximum of the synthesized samples, with BaSO4 as a reference. Thermal stability and degradation temperature of the as-synthesized samples were analyzed using an SDT Q 600 US analyzer (ASTM E1131) at a heating rate of 20 °C min−1 under nitrogen atmosphere. The thermal analysis was performed in the temperature range from room temperature to 1000 °C using alumina as the reference material on platinum pans and calcium sulphate as a standard. A Quadrasorb station 2 instrument was used to determine the surface area, pore size and pore volume of the prepared titania samples. The study was carried out in nitrogen atmosphere at a bath temperature of 77.3 K. TEM measurement was carried out for the calcined catalysts using an FEI Tecnai G2 S-twin instrument with a UHR pole piece. TEM samples were prepared by the drop-casting method, in which catalyst samples in ethanol solution were dispersed on carbon-coated copper grids.2.5 Photocatalytic reactions
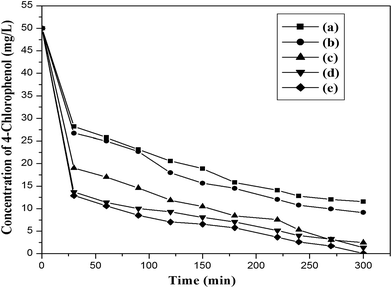
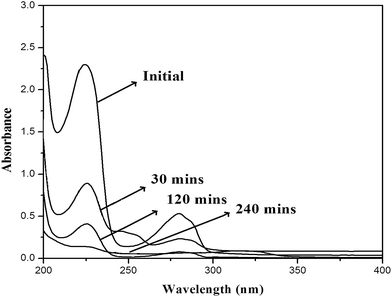
The photocatalytic activities of prepared titania photocatalysts were examined through the degradation of 4-CP under UV light irradiation. The multi lamp Haber photo reactor used in the present study was fitted with eight low pressure mercury lamps emitting at 365 nm with polished anodized aluminium reflectors and black cover to prevent UV leakage. The intensity of incident light was measured using chemical ferrioxalate actinometry.24 This technique allows the evaluation of the photon flux and its value is 3.987 μmol m−2 s−1. The photonic efficiency was calculated as the ratio of the photocatalytic degradation rate and the intensity of the incident light.25 In a typical reaction, 100 mL of known concentration of 4-CP was taken in a clear quartz tube and a weighed quantity of the titania sample was added to it. Aeration was effected using an air circulatory pump and the solution was kept in the dark for 30 minutes to establish adsorption–desorption equilibrium. The solution was then exposed to UV light and aliquots of samples were withdrawn at regular intervals and centrifuged. A UV-visible spectrophotometer (Lambda 35, PerkinElmer) was used to measure the change in concentration of 4-CP by measuring the absorbance of the samples spectrophotometrically at the λmax of 225 nm. The effects of reaction parameters such as catalyst dosage, initial concentration of 4-CP, pH and calcination temperature were optimized under UV light irradiation.3. Results and discussion
3.1 Thermogravimetric analysis
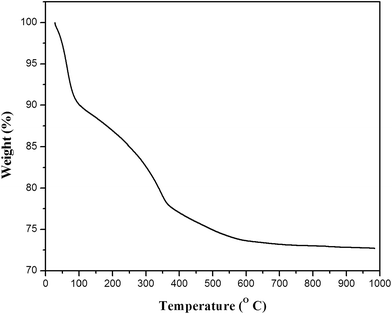
Thermogravimetric analysis (TGA) of the as-synthesized ILT-B sample is shown in Fig. 1. The weight loss of about 11.56% from 50 to 200 °C was due to loss of volatile species like water, isopropanol and acetic acid. The 10.65% weight loss from 200 to 450 °C was due to partial dehydroxylation of titanium hydroxide, amorphous carbon or carboxylate species.26 The weight loss was negligible above 480 °C. Degradation of template was not noticed in this study as it was removed in the washing process. Based on this TGA result, it can be concluded that IL was completely removed from titania by washing with ethyl acetate and water.3.2 Fourier transform infrared (FT-IR) analysis
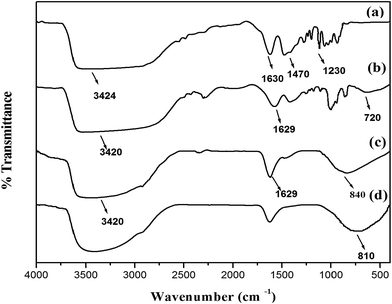
The FT-IR spectra of IL, ILT-A, ILT-B and ILT-2 are shown in Fig. 2. The broad band around 500 to 900 cm−1 in the spectra of ILT-A, ILT-B and ILT-2 due to Ti–O stretching peak confirmed the formation of titania from the precursor.27 In the FT-IR spectrum of IL, the peaks at 3424, 1630, 1470 and 1230 cm−1 were assigned to –OH stretch, chloride component stretch, –CH2 bending and C–N stretching vibrations respectively. These peaks were also observed in the FT-IR spectrum of ILT-A (before washing with ethyl acetate and water) in addition to the peak at 720 cm−1. For ILT-A, the peak due to OH stretching vibration (3424 cm−1) was shifted to lower wavenumber (3420 cm−1) with a widening of the peak, compared to that of IL. This might have been due to the formation of a hydrogen bond between hydroxyl hydrogen of choline cation with the oxygen of titania.28 In the FT-IR spectrum of ILT-B (after washing with ethyl acetate and water and drying at 100 °C), the peaks of CH2 bending, C–N stretching, and chloride component stretching were absent, indicating the removal of IL from titania. This observation, in addition to the thermal behavior of ILT-B, further reiterated the fact that IL could be simply removed by washing with water and ethyl acetate.18 The peaks at 3420 and 1629 cm−1 in the spectra of ILT-B and ILT-2 (calcined at 500 °C) were due to the –OH stretching and bending vibrations of surface-adsorbed water, respectively. The interaction between IL template and titania might have been due to: (i) intermolecular hydrogen bond formation between hydroxyl hydrogen of choline cation and titania and (ii) a probable Lewis acid type interaction of Zn present in the anionic part of IL with oxygen in titania. A coordinate bonding type interaction could have been the reason for the observed decrease in the Ti–O stretching frequency in ILT-A sample that contained the IL in the framework (720 cm−1), compared to that of the template-free ILT-B (840 cm−1) and ILT-2 (810 cm−1). The cumulative effect of these interactions is believed to offer controlled growth of titania.3.3 X-ray diffraction (XRD) analysis
Fig. 3A shows the XRD pattern of non-templated titania and Fig. 3B the XRD patterns of ILT-1, ILT-2, ILT-3 and as-prepared ILT-B samples. All the synthesized titania samples showed characteristic anatase phase, which was proved by comparison with standard pattern of anatase titania (JCPDS 21-1272). The peaks were identified to originate from the (101), (004), (200), (105), (211), (204), (301) planes of anatase TiO2. Rutile and brookite phases were not detected. The average crystallite sizes of synthesized samples were calculated using the Debye–Scherrer equation:29
D = Kλ/β![[thin space (1/6-em)]](https://www.rsc.org/images/entities/char_2009.gif) cos cos![[thin space (1/6-em)]](https://www.rsc.org/images/entities/char_2009.gif) θ θ
| (1) |
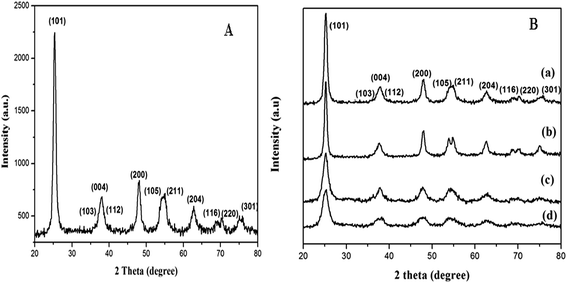 | ||
| Fig. 3 XRD patterns of (A) non-templated titania and (B) IL templated titania: (a) ILT-1, (b) ILT-2, (c) ILT-3 and (d) as-prepared ILT-B. | ||
| Material | Crystallite sizea (nm) | BET surface areab (m2 g−1) | Average pore sizec (nm) | Pore volumed (cm3 g−1) |
|---|---|---|---|---|
| a Average crystallite size was determined by XRD using the Scherrer equation.b BET surface area was determined from the linear part of the BET plot.c Calculated from the desorption branches of isotherms.d Estimated by the BJH method. | ||||
| Degussa P25 | 30 | 50 | — | — |
| Non-templated titania | 19.1 | 54.0 | 4.7 | 0.13 |
| ILT-1 | 13.6 | 74.2 | 8.32 | 0.28 |
| ILT-2 | 13.2 | 75.1 | 7.36 | 0.29 |
| ILT-3 | 12.0 | 71.4 | 8.35 | 0.26 |
3.4 Surface properties of the synthesized catalysts
Surface area, pore size and pore volume values of the synthesized samples are listed in Table 1. Non-templated titania possessed a surface area of about 54 m2 g−1. ILT-1 showed 74.2 m2 g−1 surface area. While the surface area increased for ILT-2, it decreased to 71.4 m2 g−1 upon more addition of IL in ILT-3, due to the particle aggregation of titania on adding more template. Among all the synthesized samples, ILT-2 exhibited the largest surface area of 75.1 m2 g−1, with a more than 28% increase in surface area compared to non-templated titania which was due to controlled aggregation of titania. Analysis of variance (ANOVA) F-statistics was used to establish the statistical differences in surface area among IL templated titania materials. There is a significant difference between the surface area values of IL-templated titania at 1% level of significance.The nitrogen adsorption–desorption isotherms of ILT-1, ILT-2 and ILT-3 samples are shown in Fig. 4. The isotherm patterns for all the prepared catalysts using IL exhibited type-IV nitrogen isotherms with hysteresis loops intermediate between types H1 and H2. This pattern is indicative of characteristic mesoporosity of solids, based on the IUPAC classification.30 Broadening of desorption isotherm of the samples indicated the enhancement in the porosity31 and all the templated samples possessed significantly greater porosity, compared to the non-templated titania.
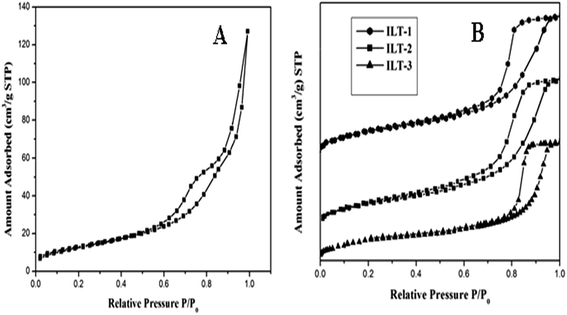 | ||
| Fig. 4 Nitrogen adsorption–desorption isotherms of (A) non-templated titania and (B) IL templated titania: ILT-1, ILT-2 and ILT-3. | ||
BJH pore size distribution curves of non-templated titania and IL templated titania are shown in Fig. 5A and B, respectively. Presence of uniform pores in ILT-2 and ILT-3 samples was confirmed by the narrow pore size distribution curves. Wide pore size distribution curves for ILT-1 and non-templated titania samples show the presence of non-uniform pores in them. Mesoporosity of all the IL templated titania samples was evident from their pore sizes which were in the range of 7–9 nm. Based on this study, it can be concluded that IL can be used as a template to achieve high-quality mesoporous nanotitania.
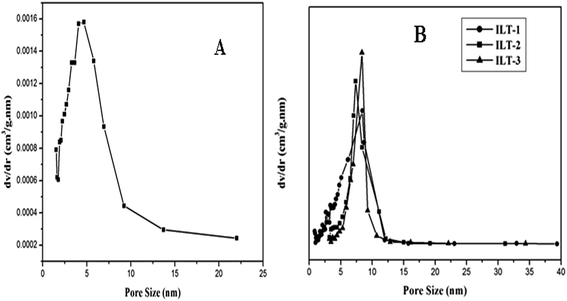 | ||
| Fig. 5 Pore size distribution curves of (A) non-templated titania and (B) IL templated titania: ILT-1, ILT-2 and ILT-3. | ||
3.5 Scanning electron microscope and energy dispersive X-ray microanalysis (SEM-EDAX)
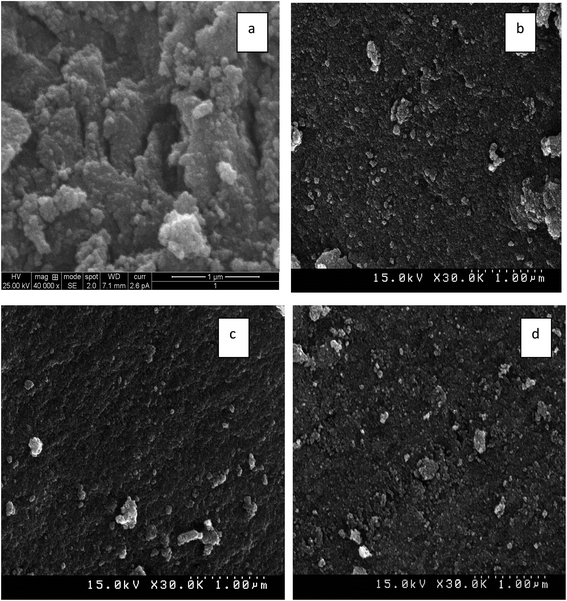
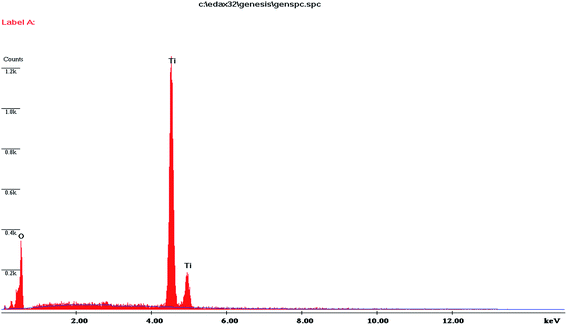
SEM images of non-templated and IL templated titania are shown in Fig. 6(a)–(d). Non-templated titania sample showed agglomeration of nanoparticles with irregular morphology. ILT-1 and ILT-3 showed spherical and slightly agglomerated nanoparticles. ILT-2 exhibited dispersed nanoparticles with controlled agglomeration. This result proved that addition of IL template inhibited the aggregation of nanoparticles. Chemical composition analysis of ILT-2 using EDX (Fig. 7) showed characteristic peaks of Ti element and oxygen. The intense peak at 4.5 keV was due to bulk titania and the less intense one at 4.9 keV was due to the surface titania. This analysis evidently showed only Ti and O elements to be present in the final product. This observation was also consistent with the FT-IR and TGA results.3.6 Transmission electron microscope (TEM) analysis
Fig. 8(a) and (c) show TEM images of non-templated titania and ILT-2 sample respectively. Non-templated titania exhibited agglomerated particles whereas ILT-2 showed slightly agglomerated particles with disordered mesostructure. The particle size distribution of non-templated titania sample was in the range of 19–23 nm and that for ILT-2 was between 11 and 14 nm. This was in good agreement with the results of XRD and SEM analyses. This result evidenced that the presence of IL as template in titania preparation effectively controls the crystallite growth of the nanoparticles. Fig. 8(b) and (d) presents the SAED patterns of non-templated titania and ILT-2 with well-resolved lattice fringes establishing the crystalline nature of the samples.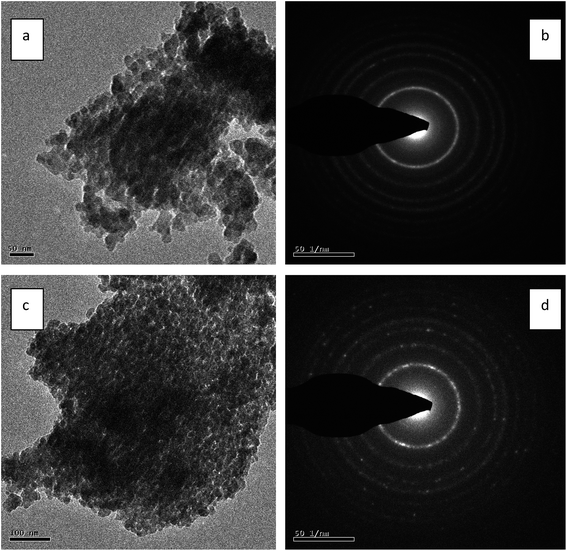 | ||
| Fig. 8 (a) TEM image and (b) SAED pattern of non-templated titania. (c) TEM image and (d) SAED pattern of ILT-2. | ||
3.7 Diffuse reflectance UV-visible spectroscopy (DRS UV-Vis)
Fig. 9A shows DRS UV-Vis spectra of non-templated titania (a) and ILT-2 (b). Red shift of ILT-2, in spite of its smaller particle size compared to non-templated titania (19.1 nm), evidently proved the delocalisation of molecular orbitals in the conduction band edge causing a deep trap in electronic energy.32 The optical bandgap energies of synthesized catalysts were calculated from the constructed Tauc plots [(F(R) × hν)1/2 vs. hν] and are shown in Fig. 9B. The optical band gap energy of ILT-2 was 3.18 eV corresponding to its absorption edge at 389 nm, whereas for non-templated titania, the band gap energy was 3.32 eV.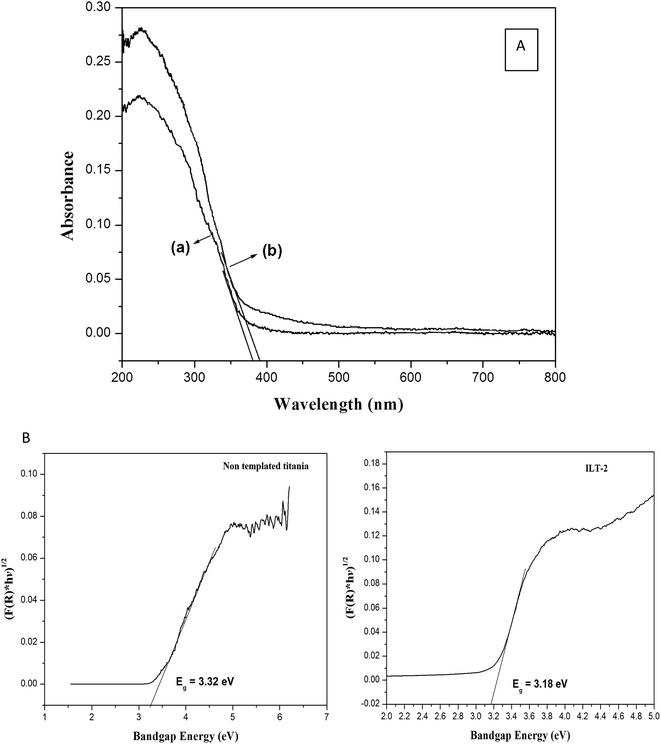 | ||
| Fig. 9 (A) DRS UV-Vis spectra of (a) titania without template and (b) ILT-2. (B) Tauc plots of non-templated titania and ILT-2. | ||
3.8 Photocatalytic activity
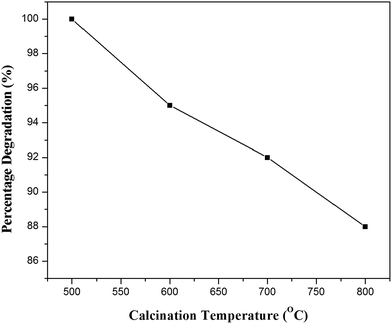
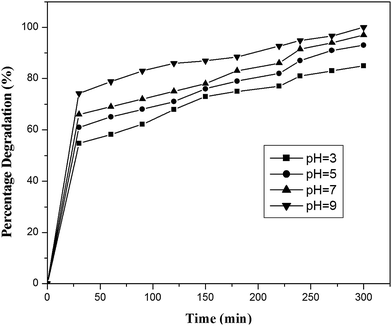
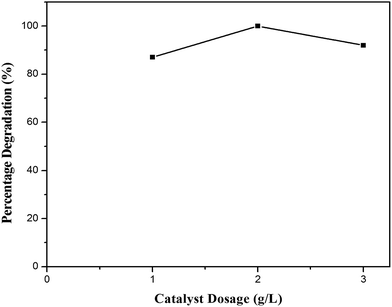
4-Chlorophenol has been selected as a model compound to evaluate the photocatalytic degradation efficiency of the synthesized photocatalysts under UV light irradiation. Various reaction parameters such as pH, catalyst dosage, reactant concentration and calcination temperature were optimized.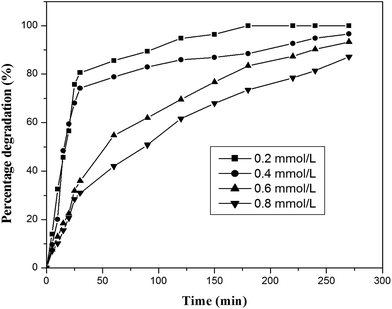 | ||
| Fig. 13 Effect of initial concentration of 4-chlorophenol (catalyst, ILT-2; catalyst dosage, 2 g L−1; volume, 100 mL). | ||
The dependence of the rate of degradation of 4-CP on the concentration is described well by the Langmuir–Hinshelwood kinetic model (eqn (2)):
 | (2) |
Neglecting KC as compared to 1 in the denominator, the above equation can be simplified to a pseudo first-order equation:
 | (3) |
 versus time for different initial concentrations of 4-CP were found to be linear (Fig. 14), confirming that the photocatalytic degradation of 4-CP obeyed pseudo first-order kinetics. The rate constant values obtained from the slope of the plots decreased with increasing initial concentration of the substrate, suggesting that substrate concentration had a significant effect on the photocatalytic degradation ability.
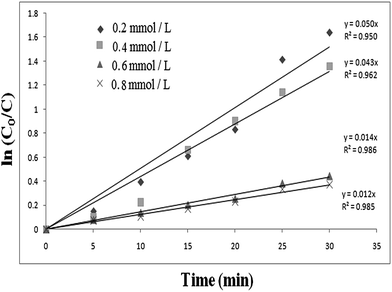 | ||
| Fig. 14 Kinetic curves for the photocatalytic degradation of 4-chlorophenol (catalyst, ILT-2; catalyst dosage, 2 g L−1; volume, 100 mL). | ||
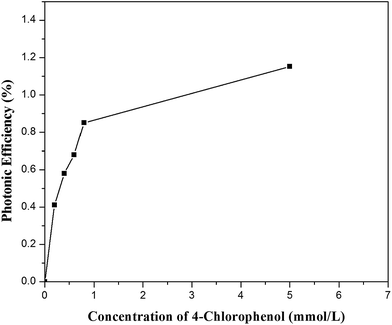
The dependence of the photonic efficiency of 4-CP degradation on its initial concentration is shown in Fig. 15. The photonic efficiency increased as the initial concentration of 4-CP increased up to 5 mmol L−1. Theurich et al.25 also reported a similar trend in the relationship between photonic efficiency and initial concentration of 4-CP.
4. Conclusion
The present study reported a green sol–gel synthesis route of mesoporous titania photocatalysts possessing an average particle size of 12–14 nm using choline chloride–zinc chloride IL as a template. XRD analysis proved the presence of pure anatase phase in all the synthesized catalysts and porosity measurements indicated the formation of mesoporous titania possessing pore size in the range 7–9 nm. Intermolecular hydrogen bonding and Lewis acid–base type interactions between the IL and titania could have facilitated the control of crystallite size during the growth of TiO2 particles. The IL template was simply removed by washing with ethyl acetate and water, as evidenced from FT-IR and TGA studies. Among all the synthesized samples, ILT-2 exhibited the largest surface area of 75.1 m2 g−1, with a more than 28% increase in surface area compared to non-templated titania. As expected from its surface characteristics, ILT-2 exhibited markedly higher photocatalytic activity for the UV-light-mediated degradation of 4-chlorophenol, compared to the other IL templated titania, non-templated titania and Degussa P25 systems. Excellent templating ability and ease of removal without heating make the choline chloride–zinc chloride ionic system a viable green alternative for the synthesis of highly crystalline mesoporous titania.Acknowledgements
The authors thank the Department of Science and Technology and University Grants Commission, Government of India for DST-FIST and UGC-SAP sponsored analytical instrumentation facilities at the Department of Chemistry, Anna University, Chennai. T. Preethi and B. Abarna are grateful to UGC, New Delhi, for providing financial assistance in the form of a Senior Research Fellowship. M. P. Padmapriya is grateful to Anna University, Chennai, for providing financial assistance through Anna Centenary Research Fellowship.References
- U. I. Gaya and A. H. Abdullah, J. Photochem. Photobiol., C, 2008, 9, 1–12 CrossRef CAS.
- H. Oveisi, S. Rahighi, X. Jiang, Y. Nemoto, A. Beitollahi, S. Wakatsuki and Y. Yamauchi, Chem.–Asian. J, 2010, 5, 1978–1983 CrossRef CAS PubMed.
- Y. Li, B. P. Bastakoti, M. Imura, S. M. Hwang, Z. Sun, J. H. Kim, S. X. Dou and Y. Yamauchi, Chem.–Eur. J., 2014, 20, 6027–6032 CrossRef CAS PubMed.
- Y. Li, B. P. Bastakoti, V. Malgras, C. Li, J. Tang, J. H. Kim and Y. Yamauchi, Angew. Chem., Int. Ed., 2015, 54, 4222–4225 CrossRef PubMed.
- L. Mahoney and R. T. Koodali, Materials, 2014, 7, 2697–2746 CrossRef , (Invited Review).
- Y. N. Tan, C. LengWong and A. R. Mohamed, ISRN Mater. Sci., 2011, 2011, 32–40 Search PubMed.
- M. Pelaez, N. T. Nolan, S. C. Pillai, M. K. Seery, P. Falaras, K. G. Kontos, P. S. M. Dunlop, J. W. J. Hamilton, J. A. Byrne, K. Oshea, M. H. Entezari and D. D. Dionysiou, Appl. Catal., B, 2012, 125, 331–349 CrossRef CAS.
- S. Bagheri, Z. A. M. Hir, A. T. Yousefi and S. B. A. Hamid, Microporous Mesoporous Mater., 2015, 218, 206–222 CrossRef CAS.
- S. L. Suib, New and Future Developments in Catalysis: Solar Photocatalysis, Elsevier, Newnes, 2013 Search PubMed.
- W. Zheng, D. Li and W. Guo, in Ionic Liquids – Current State of the Art, ed. S. Handy, Intech, USA, 2015, ch. 4, pp. 93–117 Search PubMed.
- W. Zheng, X. Liu, Z. Yan and L. Zhu, ACS Nano, 2009, 3, 115–122 CrossRef CAS PubMed.
- C. Chen, J. Ran and Q. Ye, Rare Met., 2009, 28, 434 CrossRef CAS.
- K. S. Yoo, Z. Choi and D. D. Dionysiou, Catal. Commun., 2005, 6, 259–262 CrossRef CAS.
- H. Liu, M. Wang, Y. Wang, Y. Liang, W. Cao and Y. Su, J. Photochem. Photobiol., A, 2011, 223, 157–164 CrossRef CAS.
- T. Alammar, A. Birkner, O. Shekhah and A. V. Mudring, Mater. Chem. Phys., 2010, 120, 109–113 CrossRef CAS.
- D. Sun, C. Yu, G. Shao, H. Dai, X. Dong and Y. Ma, Dig. J. Nanomater. Biostruct., 2014, 9, 1451–1459 Search PubMed.
- Z. Duan, Y. Gu and Y. Deng, Catal. Commun., 2006, 7, 651–656 CrossRef CAS.
- R. Hekmatshoar, F. Mousavizadeh and A. Rahnamafar, J. Chem. Sci., 2013, 125, 1009–1013 CrossRef CAS.
- A. P. Abbott, D. Boothby and G. Capper, J. Am. Chem. Soc., 2004, 126, 9142–9147 CrossRef CAS PubMed.
- R. Cooper Emily, D. Andrews Christopher, S. Wheatley Paul, B. Webb Paul, P. Wormald and E. Morris Russell, Nature, 2004, 430, 1012–1016 CrossRef CAS PubMed.
- J. Ge, X. Guo, X. Xu, P. Zhang, J. Zhua and J. Wang, RSC Adv., 2015, 5, 49598–49605 RSC.
- N. Kaur, S. Kaur Shahi and V. Singh, Photochem. Photobiol., 2016, 92, 69–75 CrossRef CAS PubMed.
- L. Anicai, A. Petica, D. Patroi, V. Marinescu, P. Prioteasa and S. Costovici, Mater. Sci. Eng., B, 2015, 199, 87–95 CrossRef CAS.
- C. G. Hatchard and C. A. Parker, Proc. R. Soc. London, Ser. A, 1956, 235, 1518–1536 CrossRef.
- J. Theurich, M. Lindner and D. W. Bahnemann, Langmuir, 1996, 12, 6368–6376 CrossRef CAS.
- S. Sivakumar, P. Krishna Pillai, P. Mukundan and K. G. K. Warrier, Mater. Lett., 2002, 51, 330–335 CrossRef.
- M. J. Alam and D. C. Cameron, J. Sol–Gel Sci. Technol., 2002, 25, 137–145 CrossRef CAS.
- W. Zhang, A. A. Dehghani-Sanij and R. S. Blackburn, Prog. Nat. Sci., 2008, 18, 801–805 CrossRef CAS.
- B. Cullity, Elements of X-ray diffraction, Addison–Wesley, Reading, Massachusetts, 1987, pp. 294–296 Search PubMed.
- K. S. W. Sing, D. H. Everett, R. A. W. Haul, L. Moscou, R. A. Pierotti, J. Rouquerol and T. Siemieniewska, Pure Appl. Chem., 1985, 57, 603–619 CrossRef CAS.
- D. Ramimoghadam, S. Bagheri and S. B. Abd Hamid, BioMed Res. Int., 2014, 2014, 1–7 CrossRef PubMed.
- H. Lin, C. P. Huang, W. Li, C. Ni, S. Ismat Shah and Y. H. Tseng, Appl. Catal., B, 2006, 68, 1–11 CrossRef CAS.
- T. A. McMurry, J. A. Byrne, P. S. M. Dunlop, J. G. M. Winkelman, B. R. Eggins and E. T. McAdams, Appl. Catal., A, 2004, 262, 105–110 CrossRef.
- R. A. Doong, C. H. Chen, R. A. Maithreepala and S. M. Chang, Water Res., 2001, 35, 2873–2880 CrossRef CAS PubMed.
| This journal is © The Royal Society of Chemistry 2017 |

