 Open Access Article
Thermal behavior of nitrocellulose-based superthermites: effects of nano-Fe2O3 with three morphologies†
Ting Zhanga,
Ningning Zhaoa,
Jiachen Lia,
Hujun Gongb,
Ting Anc,
Fengqi Zhaoc and
Haixia Ma *a
*a
aSchool of Chemical Engineering, Northwest University, Xi'an 710069, Shaanxi, China. E-mail: mahx@nwu.edu.cn
bState Key Laboratory of Continental Dynamics, Northwest University, Xi'an 710069, Shaanxi, China
cScience and Technology on Combustion and Explosion Laboratory, Xi'an Modern Chemistry Research Institute, Xi'an 710065, Shaanxi, China
First published on 28th April 2017
Abstract
Superthermites or metastable intermolecular composites (MIC) are well-known for their excellent combustion characteristics in propellants. Herein, superthermites with three Fe2O3 morphologies (rod-like, polyhedral, and olivary) were synthesized. The effects of Al/Fe2O3 on the thermal decomposition property of nitrocellulose (NC) were investigated in detail via differential scanning calorimetry (DSC). The results indicate that the catalytic performances of the superthermites are highly relevant to the specific surface area of their corresponding Fe2O3. Al/Fe2O3 containing rod-like Fe2O3 (Fe2O3(r)) shows a much improved performance compared with other morphological samples. The values of apparent activation energy (Ea) and thermal ignition temperature (Tbeo) of NC-Al/Fe2O3(r) were the lowest. This study could provide some directive reference data for the thermal behavior of nitrocellulose-based superthermites.
1. Introduction
Metal-based nano-energetic materials (nEMs) composed of metal fuel and oxidizer are frequently referred to as superthermites or metastable intermolecular composites (MIC),1 which are used as combustion catalysts owing to their enhanced burning rate,2,3 short ignition lag time,3,4 high energy release,5 and combustion temperature.6,7 To date, great efforts have been focused on the fabrication of various superthermites such as Al/Bi2O3,8 Al/CuO,9,10 Al/Fe2O3,11 Al/I2O5,12 Al/MoO3,13 and Al/Co3O4.14 Among them, Al/Fe2O3, as one of the traditional thermites, is widely used as an additive in propellants, high-energetic explosives, free-standing heat sources, airbag ignition materials, hardware destruction devices, and welding torches.15,16 The diffusion distance, contact sites, and morphology are key factors for the reactive properties of thermites. To date, many methods such as electrospinning nanofibers,17 electrophoretic deposition,18 ultrasonic mixing,19 and sol–gel method20 or atomic layer deposition (ALD) technique21 have been applied to make the interfacial contact area of the thermites maximal. However, most of these focus on the thermite itself. In propellant systems, thermites are always used with other components. Thus, it is necessary to study the thermal behavior of nitrocellulose-based superthermites composites.Nitrocellulose (NC) is well known as an important ingredient in guns, explosives, and propellant formulations.22,23 The combustion performance is the core of propulsion technology, which can be significantly improved with the help of burning catalysts. An et al. studied the catalytic effects of three different types of thermites on the combustion of double-base (DB) propellants. The results indicated that DB propellants containing three thermites Al/PbO, Al/CuO, and Al/Bi2O3 showed excellent combustion performances.24 Yan et al. studied the catalytic action of nitrocellulose nanofiber-based thermite textiles compared with that of pure NC and nanoaluminum (n-Al)-incorporated nanofiber, which showed enhanced burning rates with the addition of Al/CuO composites.17 Li et al. investigated the impact of Al/Fe2O3 on the thermal properties and elastic modulus of NC fiber. The Al/Fe2O3/NC fibers showed a broader exothermic peak than pure NC and the elastic modulus was improved distinctly by the addition of 5.0 wt% Al/Fe2O3.25 Although there have been many efforts in this field, studies on the thermal behavior of nitrocellulose-based superthermites have rarely been reported. Therefore, the main objective of this article is to fully discuss the differences of three superthermites Al/Fe2O3 including their structures, profound effects on the decomposition processes of NC and catalysis action.
In this work, we design and prepare controllable NC-Al/Fe2O3 composites using various morphologies of Fe2O3. The thermal behaviours, kinetic equation of the exothermic decomposition reaction, thermal parameters and thermal safety of the NC-Al/Fe2O3 hybrids are carefully studied by means of differential scanning calorimetry (DSC). We find that the different morphologies cause an extensive change in the specific surface area of the composites, which thus affects their actual catalytic action and thermal decomposition characteristics of NC. The apparent activation energy (Ea) of NC-Al/Fe2O3(r) decreases the most by 24.95 kJ mol−1 in comparison with pure NC, which reveals that Al/Fe2O3(r) has the best catalytic effect, thus making it a potential material for application in micro-propellants.
2. Experimental
2.1 Synthesis of nanosized Fe2O3
2.2 Preparation of Al/Fe2O3
Al/Fe2O3 superthermites were prepared via ultrasonic dispersion in n-hexane with a stoichiometric ratio of Fe2O3![[thin space (1/6-em)]](https://www.rsc.org/images/entities/char_2009.gif) :
:![[thin space (1/6-em)]](https://www.rsc.org/images/entities/char_2009.gif) Al (71.1 wt%
Al (71.1 wt%![[thin space (1/6-em)]](https://www.rsc.org/images/entities/char_2009.gif) :
:![[thin space (1/6-em)]](https://www.rsc.org/images/entities/char_2009.gif) 28.9 wt%). First, n-Al and nano-Fe2O3 were each dispersed using ultrasonic waves for 0.5 h. Second, the homogeneous distributions of nano-Fe2O3 and n-Al were put into the same reaction vessel which was placed in an ultrasonic bath and heated at 40 °C for 2 h under a nitrogen atmosphere. Finally, the sample was ultrasonically mixed until the dispersant (n-hexane) almost completely evaporated and dried at 60 °C for 6 h to obtain the final composite.
28.9 wt%). First, n-Al and nano-Fe2O3 were each dispersed using ultrasonic waves for 0.5 h. Second, the homogeneous distributions of nano-Fe2O3 and n-Al were put into the same reaction vessel which was placed in an ultrasonic bath and heated at 40 °C for 2 h under a nitrogen atmosphere. Finally, the sample was ultrasonically mixed until the dispersant (n-hexane) almost completely evaporated and dried at 60 °C for 6 h to obtain the final composite.
2.3 Preparation of NC-based Al/Fe2O3
The solid propellants with 3–5 wt% catalyst show a great effect on the burning rate,27 therefore, physical mixtures of three types of Al/Fe2O3 powders and NC were prepared in an agate mortar with the mass ratio of 1![[thin space (1/6-em)]](https://www.rsc.org/images/entities/char_2009.gif) :
:![[thin space (1/6-em)]](https://www.rsc.org/images/entities/char_2009.gif) 19 and slowly ground. The slow grinding process was maintained for 30 min to obtain the composite materials.
19 and slowly ground. The slow grinding process was maintained for 30 min to obtain the composite materials.
2.4 Characterization
The physical phase, composition, morphology and structure of the materials were characterized via XRD, SEM-EDS, TEM, FT-IR and XPS. X-ray diffractograms were recorded on a D/MAX-3C (Japan) instrument using Cu Kα1 radiation (λ = 0.15406 nm) at 40 kV voltage and 40 mA current ranging from 10° to 80°. SEM observations were carried out on a Quanta 400 FE-SEM (FEI Co., USA) at an acceleration voltage of 30 kV. EDS spectra were measured using an INCAIE350 testing device from OXFORD Instruments INC (UK) with a discharge voltage of 4–10 kV and distance of exactly 1 mm between the electrodes. The morphology and size of the as-obtained products were investigated via transmission electron microscopy (TEM) and high-resolution transmission electron microscopy (HRTEM) on a Libra 200FE (Carl Zeiss SMT Pte Ltd., Germany). Fourier transform infrared spectroscopy (FT-IR, Bruker Tensor 27, powders were diluted in KBr) was used to investigate the nanoparticles (NPs). X-ray photoelectron spectroscopy (XPS) measurements were performed using a Thermo Scientific X-ray photoelectron spectrometer.The BET specific surface area and pore volume of the powders were measured on an Autosorb-1C-TCD physical adsorption instrument (American Quantachrome Co.). All samples were degassed at 180 °C prior to the nitrogen adsorption measurements. The BET surface area was determined via a multipoint BET method using the adsorption data in the relative pressure (P/P0, P0 is the pressure of saturated nitrogen vapor at a temperature of 77.35 K) range of 0.05–1.00. Desorption isotherms were used to determine the pore size distribution via the Barrett–Joyner–Halenda (BJH) method, assuming a cylindrical pore model. The nitrogen adsorption volume at the relative pressure (P/P0) of 0.99 was used to determine the pore volume and average pore size.
Raman spectroscopy on the three Fe2O3 samples was performed on a Renishaw Raman System (Renishaw Inc., model RM2000) with a red laser at 785 nm as the excitation source. The integration time for each Raman measurement was 30 s.
The thermal behaviors of the samples were determined using differential scanning calorimetry (DSC) at a heating rate of 10 °C min−1 from room temperature to 350 °C in an N2 atmosphere at a flow rate of 50 mL min−1 under ambient atmospheric pressure. To explore the reaction mechanism of the intense exothermic decomposition processes of the NC-based superthermites and obtain the corresponding kinetic parameters [apparent activation energy (Ea) and pre-exponential constant (A)] and the most probable kinetic model function, the DSC curves at the heating rates of 5.0, 10.0, 15.0, 20.0, 25.0 and 30.0 °C min−1 were processed mathematically.
3. Results and discussion
3.1 Morphology analysis
The resulting sample was firstly examined by TEM, as shown in Fig. 1. The cross-sectional TEM image clearly shows a rod-like shape in Fig. 1a. Fig. 1d (the area marked white pane and the corresponding insert) shows the typical HRTEM image of the small part of an Fe2O3 nanorod, where only one set of clear lattice fringes with the interplanar distance of 0.25 nm could be seen, which can be indexed to the (110) plane of the rhombohedral Fe2O3 structure. Excellent crystallinity is also confirmed by the corresponding fast Fourier-transform (FFT) (insert in Fig. 1d). The low-magnification TEM image (Fig. 1b) of the Fe2O3 nanoparticles indicates that the particles have a typical polyhedral geometrical structure. From TEM image (Fig. 1c), it can be seen that the Fe2O3 nanoparticles are olivary in shape. The typical HRTEM images of the polyhedral and olivary Fe2O3 are presented in Fig. 1e and f, respectively. Both of them show almost the same crystallographic orientation with the lattice inter-planar spacing of 0.25 nm, which can be indexed to the (110) plane of the rhombohedral Fe2O3 structure, and is additional evidence that the nanoparticles are highly crystalline according to their corresponding FFT patterns (insert in Fig. 1e and f, respectively).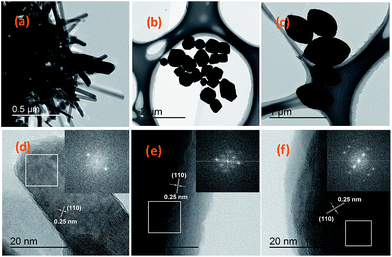 | ||
| Fig. 1 TEM and HRTEM images of Fe2O3 with three morphologies. (a, d) Fe2O3(r); (b, e) Fe2O3(p); and (c, f) Fe2O3(o). Insets: the corresponding FFT patterns marked in the white pane. | ||
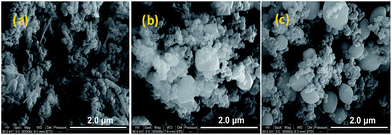
The SEM image in Fig. 2a shows Al/Fe2O3 nanorods with different lengths which could be due to the ultrasonic treatment. There are certain interfacial contacts between n-Al and Fe2O3(r) in the physical mixture. The SEM images of Al/Fe2O3(p) and Al/Fe2O3(o) are shown in Fig. 2b and c, respectively. In these images, loosemetallized agglomerations are clearly observed. Fig. 3 shows the structures and shapes of the NC-Al/Fe2O3 composite materials, in which Al/Fe2O3 is dispersed on the surface of NC.
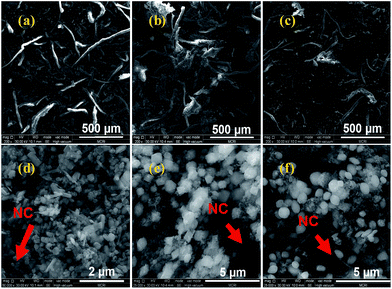 | ||
Fig. 3 SEM images of NC-Al/Fe2O3 (×200 magnification and ×50![[thin space (1/6-em)]](https://www.rsc.org/images/entities/char_2009.gif) 000 magnification). (a, d) NC-Al/Fe2O3(r); (b, e) NC-Al/Fe2O3(p) and (c, f) NC-Al/Fe2O3(o). 000 magnification). (a, d) NC-Al/Fe2O3(r); (b, e) NC-Al/Fe2O3(p) and (c, f) NC-Al/Fe2O3(o). | ||
3.2 Structure and composition
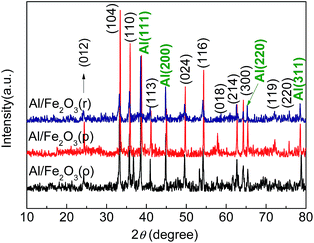
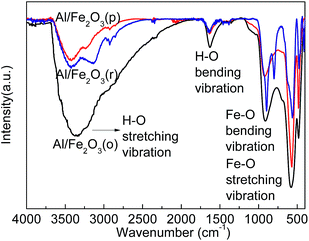
Elemental analysis reveals that Fe, O, and Al elements are present in the Al/Fe2O3 superthermites. The EDS spectra of NC-Al/Fe2O3 confirm a distinct mixture of superthermites and nitrocellulose fibers. Fig. 4 displays the typical XRD patterns of the three types of superthermites Al/Fe2O3. The obvious and sharp reflection peaks of pure aluminum and iron oxide phases are in accordance with that given in the Joint Committee on Powder Diffraction Standards (JCPDS) cards 65-2869 and 33-0664, respectively. There are no unknown crystalline phases and impurities in the Al/Fe2O3 superthermites.FT-IR studies (shown in Fig. 5) on the obtained superthermites were performed to ascertain their nature. For Al/Fe2O3(o), the bands at 480 and 579 cm−l are attributed to the metal–oxygen stretching vibrational mode. The Fe–O bonding bending vibration is observed at 1039 cm−l. The bonding in the region of 1670–1600 cm−l is ascribed to the O–H bonding bending vibrational modes. The general range of 3600–3100 cm−l may be assigned to the O–H bonding stretching vibrational modes for water of hydration. A similar absorption was observed in the other two samples. These results indicate that there is no chemical reaction between n-Al and nano-Fe2O3.
The surface composition and chemical state of elements in Fe2O3 and the Al/Fe2O3 composites were further investigated via XPS. Fig. 6a shows the Fe and O elements of Fe2O3. In Fig. 6b, the wide scan XPS indicates the existence of Fe, O and Al elements in Al/Fe2O3. In Fig. 6c, two characteristic peaks are observed, which are ascribed to the Fe 2p1/2 and Fe 2p3/2 peaks. It can be seen that the Fe 2p1/2 peak is located at 724.7 eV (Fe2O3(o)), 724.5 eV (Fe2O3(p)) and 724.2 eV (Fe2O3(r)) and the Fe 2p3/2 peak is located at 711.0 eV (Fe2O3(o)), 710.9 eV (Fe2O3(p)) and 710.7 eV (Fe2O3(r)).28,29 In the spectrum of Fe2O3(r), two accompanying satellite peaks are observed at 719.0 eV and 733.1 eV for Fe 2p3/2 and Fe 2p1/2, respectively, which indicate the existence of Fe3+.30,31 Similar satellite peaks can also be seen for Fe2O3(p) and Fe2O3(o). As illustrated in Fig. 6d, the peaks located at 724.8 eV, 724.5 eV, 724.9 eV and 711.1 eV, 711.2 eV, 711.6 eV are assigned to the Fe 2p1/2 and Fe 2p3/2, respectively, of Al/Fe2O3(o), Al/Fe2O3(p) and Al/Fe2O3(r).32,33 The satellite peaks demonstrate that the chemical states of the Fe element remain constant, which further indicates the stability of the Al/Fe2O3 composites.
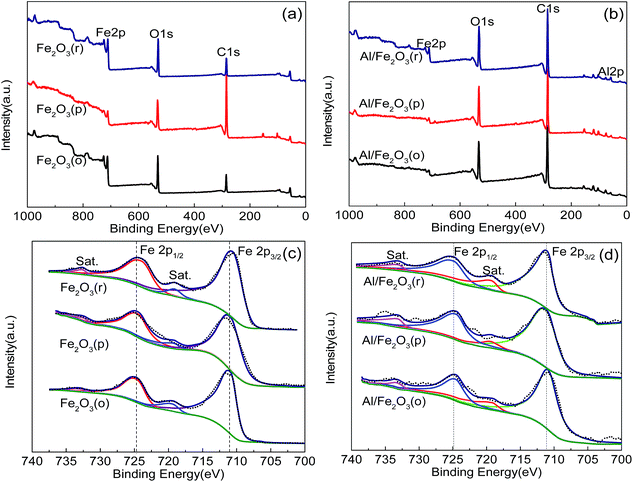 | ||
| Fig. 6 XPS spectra for Fe2O3 and Al/Fe2O3. (a) Wide spectra of Fe2O3 and Al/Fe2O3 (b); (c) Fe 2p of Fe2O3; and (d) Fe 2p of Al/Fe2O3. | ||
3.3 BET determination
Nitrogen adsorption/desorption isotherms were measured to determine the specific surface area and pore size distribution of the Fe2O3 nanostructures, and the corresponding images are presented in Fig. S1.† Fe2O3(p) exhibits a type H3 hysteresis loop according to the IUPAC classification,34 which indicates the presence of mesopores (2–50 nm). The pore size distribution of Fe2O3(p) indicates that it has mesoporous and microporous regions with a maximum peak pore diameter of 3.8 nm, as seen in Fig. S1.† The isotherms of Fe2O3(o) and Fe2O3(r) can be identified as type III, which indicates that the adsorbate–adsorbate interactions play an important role. The olivary Fe2O3 NPs exhibit a wide pore size distribution ranging from 1.4 to more than 30 nm which are mainly in the microporous and mesoporous region. The pore size of Fe2O3(r) is also microporous and mesoporous with a distribution primarily in the range of 1.4 to 32 nm. The Brunauer–Emmett–Teller (BET) specific surface areas of Fe2O3(p), Fe2O3(o), and Fe2O3(r) are 6.9, 3.1 and 37.5 m2 g−1, respectively. High-surface-area inorganic oxides have attracted much attention because they exhibit numerous edges and corners for adsorption and activation of reactions.35,36 Especially, nanorods particles, as one-dimensional nanostructure materials, are of interest due to their peculiar properties, which originate from their high surface area, low dimensionality and dominant facets.37–393.4 Raman spectroscopy and laser ignition analysis
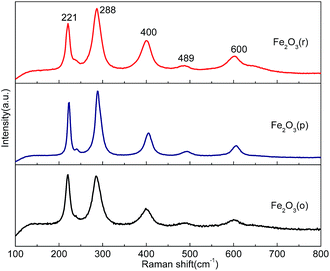
Fig. 7 shows the Raman spectra of the three Fe2O3 samples. Five optical phonon modes are observed for all three Fe2O3 nanoparticle samples, which correspond to the Ag: 221 and 489 cm−1 and Eg: 288, 400 and 600 cm−1 vibrations.40 The same peak positions show that these three samples are the same material, Fe2O3. However, the spectrum for Fe2O3(p) is broader in line width, indicating larger crystal sizes or domains, which have a smaller surface-to-volume ratio and are thus less desirable for catalysis applications that require large surface areas.In order to ascertain the activation of the three Fe2O3 samples, laser ignition analysis was also employed on a carbon dioxide laser ignition (SLC 110) system composed of four components: laser source, experimental container, high voltage impulse tester and test recorder. The maximum laser power is 120 W with a wavelength of 10.6 μm and the laser spot diameter on the sample surface is 5.0 mm. Figures of the initial and final spark taken from the video of the laser ignition process of the three particles are shown in Fig. S2,† in which the ignition of Fe2O3(p) has a weaker spark than that of the other two samples. Furthermore, the laser response delay time on Fe2O3(p), Fe2O3(o), and Fe2O3(r) are 107.3, 104.0, and 98.7 ms (taken from three experiments), respectively. Usually, the laser response delay time indicates the reaction activation of a material, and the shorter it is, the more active the material will be.41
Based on the analysis of surface area detection, Raman spectroscopy and laser ignition, the rod-like Fe2O3 with a larger specific surface area than the other two samples may have a more reactive activation on the Al/Fe2O3 catalyst in improving the thermal decomposition of NC.
3.5 Thermal analysis
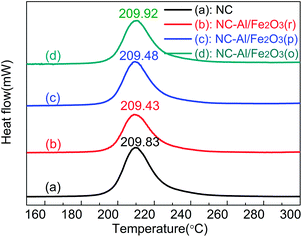
Fig. 8 shows the DSC heat flow curves of NC and the three different NC-Al/Fe2O3 composites at a heating rate of 10 °C min−1. The peak temperatures of the decomposition process are given to evaluate the effects of Al/Fe2O3 on NC. The peak temperatures of NC, NC-Al/Fe2O3(r), NC-Al/Fe2O3(p) and NC-Al/Fe2O3(o) are (209.83 ± 0.30), (209.43 ± 0.53), (209.48 ± 0.52) and (209.92 ± 0.31) °C, respectively. The decomposition peak temperatures of the NC-Al/Fe2O3(r) and NC-Al/Fe2O3(p) systems are almost equal, and they decompose at about 0.40 °C (calculated based on the data in Fig. 8) lower than NC alone. The decomposition peak temperature of NC-Al/Fe2O3(o) is 209.92 °C, which is 0.09 °C higher than that of NC and 0.49 °C higher than that of NC-Al/Fe2O3(r). Therefore, the three different shaped Al/Fe2O3 superthermites have an effect on NC at high temperature. To further study the role of Al/Fe2O3 in the NC-based composite energetic materials, the decomposition mechanism of NC and NC-Al/Fe2O3 were investigated.3.6 Non-isothermal reaction kinetics
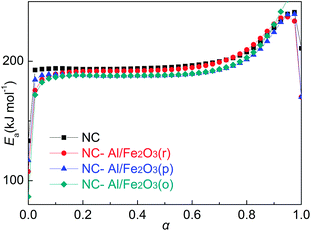
The thermal analysis shows that the decomposition temperature of NC-Al/Fe2O3(r) is the lowest among the three obtained NC-based superthermite composites. To explore the reaction mechanism of the intense exothermic decomposition process of NC-Al/Fe2O3(r) and obtain the corresponding kinetic parameters (Ea and A) and the most probable kinetic model functions, the DSC curves at the heating rates of 5.0, 10.0, 15.0, 20.0, 25.0 and 30.0 °C min−1 were processed mathematically. The temperature data corresponding to the conversion degrees (α) were found. Six integral methods (MacCallum–Tanner, Šatava–Šesták, Agrawal, General integral, Universal integral, and Flynn-Wall-Ozawa) and one differential method (Kissinger) were employed.42–46 The values of Ea were obtained using Ozawa's method from the iso-conversional DSC curves at the six heating rates,45,46 and the Ea–α relation is shown in Fig. 9. From Fig. 9, it can be seen that the activation energy slightly changes in the region of 0.175–0.675 (α), thus this range was selected to calculate the non-isothermal reaction kinetics.Forty-one types of kinetic model functions and basic data were put into the integral and differential equations for the calculation.47 The kinetic parameters and the probable kinetic model function were selected using the logical choice method which satisfied the ordinary range of the thermal decomposition kinetic parameters for energetic materials [Ea/(kJ mol−1) = 80–250, log(A/s) = 7–30]. These data together with their appropriate values of linear correlation coefficient (r), standard mean square deviation (Q) and believable factor (d, where d = (1 − r)Q), are presented in Table S1.†
The values of Ea and log![[thin space (1/6-em)]](https://www.rsc.org/images/entities/char_2009.gif) A obtained from the single non-isothermal DSC curve is in good agreement with the calculated values obtained by Kissinger's method and Ozawa's method. Therefore, we conclude that the reaction mechanism for the intense exothermic decomposition process of NC-Al/Fe2O3(r) can be classified using the Avrami–Erofeev equation: G(α) = [−ln(1 − α)]2/3. Substituting f(α) with 1.5(1 − α)[−ln(1 − α)]1/3, Ea with 182.53 kJ mol−1 and A with 1017.49 s−1 in eqn (1),
A obtained from the single non-isothermal DSC curve is in good agreement with the calculated values obtained by Kissinger's method and Ozawa's method. Therefore, we conclude that the reaction mechanism for the intense exothermic decomposition process of NC-Al/Fe2O3(r) can be classified using the Avrami–Erofeev equation: G(α) = [−ln(1 − α)]2/3. Substituting f(α) with 1.5(1 − α)[−ln(1 − α)]1/3, Ea with 182.53 kJ mol−1 and A with 1017.49 s−1 in eqn (1),
 | (1) |
The kinetic equation of the exothermic decomposition reaction can be described as eqn (2),
 | (2) |
In order to check the constancy and validity of the apparent activation energy (Ea) obtained from the logical choice method, an integral isoconversional non-linear (NL-INT) method was applied to verify the Ea in the same range of α.48–50 The values of ENL-INT-SY3 (SY3 means that the integral method I(Eα, Tα,i) in eqn (3) adopts the three order approximation of the Senum–Yang equation) were obtained by substituting the original data determined from DSC into eqn (3) and listed in Table S5.† The results show that the apparent activation energies calculated using these two methods are close to each other. The final mean value of apparent activation energy (Ea) is close to the mean value of ENL-INT-SY3, which further indicates that the kinetic model function and the values of Ea are reliable to a great extent.
 | (3) |
3.7 Thermal safety studies
The values (Te0 and Tp0) of the onset temperature (Te) and peak temperature (Tp) corresponding to β → 0 obtained from eqn (4) are 177.96 °C and 193.50 °C, respectively.| Te = Te0 + aβi + bβi2 + cβi3, i = 1–6 | (4) |
The thermal ignition temperature (Tbe0) was obtained by substituting Eeo and Te0 into the eqn (5) by Zhang et al.,51 and the value (Tbe0) of 187.50 °C was obtained.
 | (5) |
The thermal behaviors of NC-Al/Fe2O3(p), NC-Al/Fe2O3(o) and NC were also analyzed via the same method using the data in Fig. 8. The corresponding kinetic parameters are presented in Table S2–S4.† The results show that the reaction mechanism of their intense exothermic decomposition process is classified as reaction orders f(α) = 1.5(1 − α)[−ln(1 − α)]1/3 and G(α) = [−ln(1 − α)]2/3. The calculated values of the kinetic parameters of the decomposition reaction for NC and the three NC-Al/Fe2O3 composites are listed in Table 1.
| Sample | Ea/kJ mol−1 | log(A/s) | Tbe0/°C |
|---|---|---|---|
| NC | 207.48 | 20.22 | 191.42 |
| NC-Al/Fe2O3(p) | 191.75 | 18.51 | 190.25 |
| NC-Al/Fe2O3(o) | 186.18 | 17.87 | 189.39 |
| NC-Al/Fe2O3(r) | 182.53 | 17.49 | 187.50 |
From the thermal analysis, the addition of Al/Fe2O3 does not change the kinetic model function of NC, but reduces the thermal ignition temperature (Tbe0) and decreases the values of Ea and A. Among the three NC-Al/Fe2O3 composites, Al/Fe2O3(r) is the best since it possesses the lowest thermal ignition temperature, activation energy and frequency factor of NC and the Fe2O3(r) particles can have a significant influence on the catalytic actions of superthermites; thus Fe2O3(r) is the preferred material for the preparation of Al/Fe2O3.
4. Conclusion
In summary, we prepared three thermites with different morphological Fe2O3 and further studied their thermal decomposition effects on NC for the first time by analyzing their thermal behaviors. The kinetic model functions of NC and the three NC-Al/Fe2O3 samples are classified using the Avrami–Erofeev equation f(α) = 1.5(1 − α)[−ln(1 − α)]1/3 in the differential form. The ranking order of the values of the apparent activation energy (Ea) is as follows: NC-Al/Fe2O3(r) < NC-Al/Fe2O3(o) < NC-Al/Fe2O3(p) < NC. The thermal ignition temperature and frequency factor of NC-Al/Fe2O3(r) are the lowest. This is due to the fact that the Fe2O3 nanorod particles have the largest specific surface area, which could increase the interfacial contact points among the components. Therefore, the Al/Fe2O3(r) superthermite has substantial catalytic activity and the morphology of the Fe2O3 NPs helps to fabricate superthermites with excellent properties.Acknowledgements
This work was supported by Program for the National Natural Science Foundation of China (No. 21373161) and Opening Foundation of State Key Laboratory of Continental Dynamics (Northwest University, No. 12LCD07).References
- J. L. Cheng, H. H. Hng, Y. W. Lee, S. W. Du and N. N. Thadhani, Combust. Flame, 2010, 157, 2241 CrossRef CAS.
- S. M. Begley and M. Q. Brewster, J. Heat Transfer, 2007, 129, 624 CrossRef CAS.
- M. L. Pantoya and J. J. Granier, Propellants, Explos., Pyrotech., 2005, 3, 53 CrossRef.
- J. J. Granier and M. L. Pantoya, Combust. Flame, 2004, 138, 373 CrossRef CAS.
- L. L. Wang, Z. A. Munir and Y. M. Maximov, J. Mater. Sci., 1993, 28, 3693 CrossRef CAS.
- M. Petrantoni, C. Rossi, L. Salvagnac, V. Conédéra, A. Estève, C. Tenailleau, P. Alphonse and Y. J. Chabal, J. Appl. Phys., 2010, 108, 084323 CrossRef.
- A. E. Stiegman, C. D. Park, M. Mileham, L. J. van de Burgt and M. P. Kramer, Propellants, Explos., Pyrotech., 2009, 34, 293 CrossRef CAS.
- K. S. Martirosyan, L. Wang, A. Vicent and D. Luss, Nanotechnology, 2009, 20, 17579 CrossRef PubMed.
- G. Q. Jian, N. W. Piekiel and M. R. Zachariah, J. Phys. Chem. C, 2012, 116, 26881 CAS.
- X. Zhou, M. Torabi, J. Lu, R. Shen and K. Zhang, ACS Appl. Mater. Interfaces, 2014, 6, 3058 CAS.
- N. N. Zhao, C. C. He, J. B. Liu, H. J. Gong, T. An, H. X. Xu, F. Q. Zhao, R. Z. Hu, H. X. Ma and J. Z. Zhang, J. Solid State Chem., 2014, 219, 67 CrossRef CAS.
- K. S. Martirosyan, L. Wang and D. Luss, Chem. Phys. Lett., 2009, 483, 107 CrossRef CAS.
- S. M. Umbrajkar, M. Schoenitz and E. L. Dreizin, Propellants, Explos., Pyrotech., 2006, 31, 382 CrossRef CAS.
- D. G. Xu, Y. Yang, H. Cheng, Y. Y. Li and K. L. Zhang, Combust. Flame, 2012, 159, 2202 CrossRef CAS.
- T. Ulrich, Energetic Materials: Particle Processing and Characterization, Wiley-Vch Verlag GmbH & Co. KGaA, Weinheim, 2005, p. 245 Search PubMed.
- J. L. Cheng, H. H. Hng, H. Y. Ng, P. C. Soon and Y. W. Lee, J. Phys. Chem. Solids, 2010, 71, 90 CrossRef CAS.
- S. Yan, G. Q. Jian and M. R. Zachariah, ACS Appl. Mater. Interfaces, 2012, 4, 6432 CAS.
- D. Zhang, X. Li, B. Qin, C. Lia and X. Guo, Mater. Lett., 2014, 120, 224 CrossRef CAS.
- S. He, J. Chen, G. Yang, Z. Qiao and J. Li, Cent. Eur. J. Energ. Mater., 2015, 12, 129 CAS.
- K. B. Plantier, M. L. Pantoya and A. E. Gash, Combust. Flame, 2005, 140, 299 CrossRef CAS.
- L. Qin, N. Yan, J. Li, H. Hao and F. Zhao, RSC Adv., 2017, 7, 7188 RSC.
- M. A. Hassan, J. Hazard. Mater., 2001, 88, 33 CrossRef CAS PubMed.
- M. R. Sovizi, S. S. Hajimirsadeghi and B. Naderizadeh, J. Hazard. Mater., 2009, 168, 1134 CrossRef CAS PubMed.
- T. An, F. Q. Zhao, Q. Pei, L. B. Xiao, S. Y. Xu, H. X. Gao and X. L. Xing, Chin. J. Inorg. Chem., 2011, 27, 231 CAS.
- R. Li, H. Xu, H. Hu, G. Yang, J. Wang and J. Shen, J. Energ. Mater., 2014, 32, 50 CrossRef CAS.
- Y. Yang, H. X. Ma, J. Zhuang and X. Wang, Inorg. Chem., 2011, 50, 10143 CrossRef CAS PubMed.
- H. Ren, Y. Y. Liu, Q. J. Jiao, X. F. Fu and T. T. Yang, J. Phys. Chem. Solids, 2010, 71, 149 CrossRef CAS.
- N. S. Mcintyre and D. G. Zetaruk, Anal. Chem., 1977, 49, 1521 CrossRef CAS.
- C. Fu, A. Mahadevegowda and P. Grant, J. Mater. Chem. A, 2016, 4, 2597 CAS.
- S. Liu, K. Yao, L. H. Fu and M. G. Ma, RSC Adv., 2016, 6, 2135 RSC.
- J. Balbuena, M. Cruz and A. L. Cuevas, RSC Adv., 2016, 6, 92917 RSC.
- D. H. Taffa, I. Hamm, C. Dunkel, I. Sinev and D. Bahnemann, RSC Adv., 2015, 5, 1702 RSC.
- T. Yamashita and P. Hayes, Appl. Surf. Sci., 2008, 254, 2441 CrossRef CAS.
- K. S. W. Sing, D. H. Everett, R. A. W. Haul, L. Moscou, R. A. Pierotti, J. Rouquerol and T. Siemieniewska, Pure Appl. Chem., 1985, 57, 603 CrossRef CAS.
- D. Terribile, A. Trovarelli, A. De Leitenburg and G. Dolcetti, Chem. Mater., 1997, 9, 2676 CrossRef CAS.
- M. Daturi, E. Finocchio, C. Binet, J. C. Lavalley, F. Fally, V. Perrichon, H. Vidal, N. Hickey and J. Kašpar, J. Phys. Chem. B, 2000, 104, 9186 CrossRef CAS.
- Y. Xia, P. Yang, Y. Sun, Y. Wu, B. Mayers, B. Gates, Y. Yin, F. Kim and H. Yan, Adv. Mater., 2003, 15, 353 CrossRef CAS.
- K. Woo, H. J. Lee, J. P. Ahn and Y. S. Park, Adv. Mater., 2003, 15, 1761 CrossRef CAS.
- X. M. Zhou, J. Y. Lan, G. Liu, K. Deng, Y. L. Yang, G. J. Nie, J. G. Yu and L. J. Zhi, Angew. Chem., Int. Ed., 2012, 51, 178 CrossRef CAS PubMed.
- P. Lottici, C. Baratto, D. Bersani, G. Antonioli, A. Montenero and M. Guarneri, Opt. Mater., 1998, 9, 368 CrossRef CAS.
- T. An, F. Q. Zhao, H. X. Hao, H. X. Ma, E. G. Yao, Y. Yang and Y. Tan, Chin. J. Explos. Propellants, 2011, 34, 67 CAS.
- H. X. Ma, B. Yan, Y. H. Ren, Y. Hu, Y. L. Guan, F. Q. Zhao, J. R. Song and R. Z. Hu, J. Therm. Anal. Calorim., 2011, 103, 569 CrossRef CAS.
- H. X. Ma, B. Yan, J. F. Li, Y. H. Ren, Y. S. Chen, F. Q. Zhao, J. R. Song and R. Z. Hu, J. Mol. Struct., 2010, 981, 103 CrossRef CAS.
- H. X. Ma, B. Yan, Z. N. Li, Y. L. Guan, J. R. Song, K. Z. Xu and R. Z. Hu, J. Hazard. Mater., 2009, 169, 1068 CrossRef CAS PubMed.
- M. E. Brown, M. Maciejewski, S. Vyazovkin, R. Nomen, J. Sempere, A. Burnham, J. Opfermann, R. Strey, H. L. Anderson, A. Kemmler, R. Keuleers, J. Janssens, H. O. Desseyn, C. R. Li, T. B. Tang, B. Roduit, J. Malek and T. Mitsuhashi, Thermochim. Acta, 2000, 355, 125 CrossRef CAS.
- S. Vyazovkin, A. K. Burnham, J. M. Criado, L. A. Pérez-Maqueda, C. Popescud and N. Sbirrazzuoli, Thermochim. Acta, 2011, 520, 1 CrossRef CAS.
- R. Z. Hu and Q. Z. Shi, Thermal Analysis Kinetics, Science Press, Beijing, 2001, p. 127 Search PubMed.
- S. Vyazovkin and D. Dollimore, J. Chem. Inf. Comput. Sci., 1996, 36, 42 CrossRef CAS.
- S. Vyazovkin, J. Comput. Chem., 1997, 18, 393 CrossRef CAS.
- S. Vyazovkin, J. Comput. Chem., 2001, 22, 178 CrossRef CAS.
- T. L. Zhang, R. Z. Hu, Y. Xie and F. P. Li, Thermochim. Acta, 1994, 244, 171 CrossRef CAS.
Footnote |
| † Electronic supplementary information (ESI) available: See DOI: 10.1039/c6ra28502c |
| This journal is © The Royal Society of Chemistry 2017 |

