 Open Access Article
Gradient nanoporous gold: a novel surface-enhanced Raman scattering substrate†
Jinglin Huang a,
Yansong Liua,
Xiaoshan Hea,
Cuilan Tangab,
Kai Dua and
Zhibing He*a
aResearch Center of Laser Fusion, China Academy of Engineering Physics, Mianyang 621900, China
bSchool of Material Science and Engineering, Southwest University of Science and Technology, Mianyang 621010, China
First published on 9th March 2017
Abstract
The design and fabrication of surface-enhanced Raman scattering (SERS) substrates with high Raman enhancement, stability, homogeneity and processing compatibility is still one of the most challenging issues in SERS research. In this work, a novel nanoporous gold (NPG) structure that contains a gradient of ligament and pore structures along the thickness direction is designed and simply fabricated by combination of the traditional magnetron sputtering and dealloying technique. This novel nanoporous gold structure (we called it gradient nanoporous gold, GNPG) brings abundant inner structures into conventional nanoporous gold, which can produce remarkable properties for GNPG, such as the surface enhanced Raman scattering. GNPG was demonstrated to have ultrahigh and homogeneous surface enhanced Raman scattering. A simple method was proposed to estimate the relative enhancement factor (EF). The EF of GNPG was estimated to be ∼8-fold higher than conventional NPG, which means that its EF should over 107. It is believed that the gradient ligament structure of GNPG plays a key role for its Raman scattering enhancement.
1. Introduction
Surface-enhanced Raman scattering (SERS) has received increasing attention due to its high sensitivity, which can be exploited for sensitive and selective molecular identification.1–3 The main challenge for SERS study is the design and fabrication of proper SERS substrates with high Raman enhancement, stability, homogeneity and a simple preparation process. A mass of SERS substrates have been fabricated, such as surface roughened metals, metal island films, and colloidal nanoparticles since the discovery of SERS in 1974.4 However, these conventional substrates have some inherent defects, such as the relatively low enhanced factors, poor stabilities or homogeneities and complex fabrication processes.Nanoporous gold (NPG), fabricated by chemical or electrochemical dealloying of a gold based alloy (AuAg, AuCu, AuAl, etc.), is considered as a novel SERS substrate due to its high Raman enhancement effect, stability and homogeneity.3,5–11 The excellent SERS property of NPG originates from its unique structure, i.e. complicated ligament and pore bicontinuous nanostructure (or interconnected nanoporous framework) with the feature size as small as several nanometers.9,12 The efforts to design and fabricate NPG with various nanostructures for SERS application have never been stopped. Abundant NPGs have been reported, such as mechanically stamped NPG gratings,13 wrinkling NPG films,14 NPG disks15–17 and patterned NPGs.18 These NPG structures generally possess higher SERS enhancement factor (EF) than conventional NPG films. However, some defects exist in these NPGs themselves or their fabrication strategies. The SERS homogeneity of wrinkling NPG films is poor for the random wrinkling distribution.14 The stability of NPG disks is poor for the coarsening of nano-sized disks.17 The fabrication processes of these NPG structures always tend to be expensive and time-consuming, which limits cost-effectiveness and the potential for mass production. Although mechanically stamped NPG gratings were reported to be fabricated by a one-step process, the processing of the submicron silicon stamps may not be quite easily.13
In this work, a novel nanoporous gold structure that contains a gradient of ligaments and pore structures along the thickness direction is designed and simply fabricated by combination of the traditional magnetron sputtering and dealloying technique. We called this kind of nanostructure gradient nanoporous gold (GNPG). The composition, microstructure of GNPGs and their SERS effects for rhodamine 6G (R6G) and crystal violet (CV) molecules are discussed.
2. Experimental
2.1 Fabrication of gradient nanoporous gold
GNPGs were simply fabricated by dealloying gradient AuAg alloy precursor films. Fig. 1 shows a schematic diagram of the experimental process. The gradient AuAg alloy precursor films were deposited on Si substrates by direct-current (dc) magnetron co-sputtering of a Au target (99.99% pure) and a Ag target (99.9% pure). Si substrates were washed by acetone, ethanol and deionized water (DI, 18 MΩ), successively. The precursor films were sputtered in pure Ar at a working pressure of 0.5 Pa (3.8 mTorr) at room temperature, while the base pressure was lower than 1.2 × 10⁻⁴ Pa (9 × 10⁻⁷ Torr). The targets were first pre-sputtered to be cleaned for 150 s, after that a 10 nm Cr (Cr target, 99.99% pure) adhesion layer and 10 nm Au adhesion layer was deposited to increase the adhesion strength of AuAg alloy with Si substrate to avoid the fracture of films during dealloying. In order to acquire a gradient content ratio of Au and Ag atoms, the power of the targets should be carefully controlled. The power of Ag target was set constant at 50 watts, while the power of Au target was gradually varied. Two sets of precursor films were deposited: (1) Au15–40Ag85–60 alloy (subscript represents composition changing range), Au target power was varied from 82 to 22 watts; (2) Au25–40Ag75–60 alloy, Au target power was varied from 82 to 41 watts. The power of Au and Ag target was chosen via the deposition rate of Au and Ag. The thickness of AuAg alloy layer was deposited approximately to 90 nm. Another two kinds of NPG films (Au15Ag85 and Au25Ag75 films as the precursors) were prepared for comparison. Dealloying was implemented by dipping AuAg alloy precursor films in 70% room temperature HNO3 for 5 min followed by DI rinse and nitrogen dry to form the GNPG films.2.2 Characterization
The composition of GNPG nanostructures was determined by secondary ion mass spectroscopy (SIMS: Hiden EQS), X-ray photoelectron spectroscopy depth profile (XPS: PE PHI-5400) and energy dispersive X-ray spectroscopy (EDS). The time span of each etching time of XPS is 30 s with the etching depth ∼8 nm. The microstructure of GNPGs was examined by a field emission scanning electron microscopy (SEM: ZEISS Merlin VP Compact) operated at an accelerating voltage of 10 kV. The surface-enhanced Raman spectroscopy was performed using a micro-Raman spectrometer (Renishaw InVia) with an excitation laser wavelength of 514.5 nm. The laser power was 0.06 mW and the focused spot size was 1 μm. The spectra were obtained at random locations for each sample with an integration time of 50 s. Rhodamine 6G (R6G, 10−7 M) and crystal violet (CV, 10−5 M) was used as the probe molecules. In order to conduct SERS measurements, the GNPGs on Si substrates were immersed in probe molecules solution for 12 h, rinsed thoroughly with DI, and then dried under blowing N2. The surface area was measured by the capacitance ratio method using 1 M HClO4 as the electrolyte and GNPG samples as the working electrode.19,20 The Ag/AgCl electrode and Pt wire electrode were used as reference electrode and counter electrode, respectively. The contact area of working electrode with electrolyte was set to be 1 cm2. The cyclic voltammograms was measured using electrochemical workstation (Autolab PGSTAT 302N).3. Results and discussion
3.1 Composition analysis of precursors and GNPG films
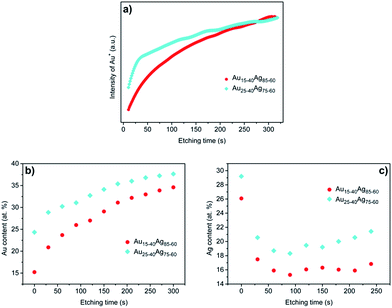
It is significant to ensure the gradient AuAg alloy has been deposited as we designed. Therefore, the composition of AuAg alloy precursors was measured by depth dependent composition analysis using SIMS. Fig. 2a shows the variation of Au+ intensity with the etching time in the two kinds of alloy precursors, which can represent the variation of Au content along the thickness direction. It is clear that the intensity of Au+ increases nearly linearly with the etching time. The intensity of Au+ in Au25–40Ag75–60 is higher than that in Au15–40Ag85–60 before 200 s, which indicates that the Au content in Au25–40Ag75–60 is higher than Au15–40Ag85–60 near the film surface. While when the etching time increases further, the intensity of Au+ is approximately equal for these two precursors. It is not easy to measure the precise element content by SIMS. Thus, the XPS depth profile was further used to demonstrate the gradient composition as shown in Fig. 2b. Clearly, the XPS results appear a similar variation of composition as SIMS. The results of SIMS and XPS demonstrate that the gradient AuAg alloy precursors have been deposited successfully. EDS measurement was made to characterize the total element distributions. The results are listed in Table 1. Note that the Au content of these two alloy precursors is ∼10 at% higher than the theoretically average values (that should be 27.5 at% and 32.5 at% of these two precursors, respectively) which is caused by the Au adhesion layers. The distribution of Au and Ag is uniform as shown in the element mapping (see Fig. S1†). The composition of fabricated GNPG films was also measured by XPS depth profile (Fig. 2c) and EDS (Table 1). The residual Ag content on the surface is higher than inside because of the higher Ag content on the surface in precursors. The content of residual Ag of GNPG films is higher than conventional NPG films21 which should caused by two factors. One is the short corrosion time. The other is the “parting limit” effect in alloy corrosion, which will be discussed in Section 3.2. The typical XPS spectra of Ag 3d and Au 4f of precursors and GNPG films are provided in Fig. S2.†| Au (at%) | Ag (at%) | |
|---|---|---|
| Au15–40Ag85–60 | 36.8 | 63.2 |
| Au25–40Ag75–60 | 43.9 | 56.1 |
| GNPG40–15 | 74.2 | 25.8 |
| GNPG40–25 | 71.7 | 28.3 |
3.2 Microstructure of GNPG films
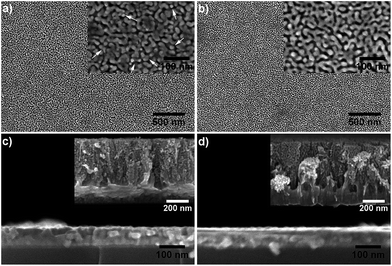
Fig. 3 shows typical SEM images of the two kinds of GNPG nanostructures. The nanoporous gold like morphologies, i.e., the ligament and pore bicontinuous nanostructure, can be observed in Fig. 3a and b. No cracks or other defects exist in the surface views of the fabricated GNPGs, which indicates an excellent structural homogeneity of these GNPGs in a large area (at least 2 × 3 μm2). Unlike the low magnification SEM images, a dramatic difference of microstructures can be seen in these two kinds of GNPG nanostructures. As shown in the inset of Fig. 3b, the microstructure of GNPG40–25 (the GNPG film fabricated by Au25–40Ag75–60 precursor film) appears a continuous network of branched ligaments in the full range, which is the same as normal NPG films.22 While the ligaments of GNPG40–15 (the GNPG film fabricated by Au15–40Ag85–60 precursor film as shown in inset of Fig. 3a) are partially continuous, some isolated islands (where the arrows aim at) can be observed. Moreover, the ligament size of these two GNPGs is nearly equal.As we know, a “parting limit” exists in the dealloying process, i.e., only alloys within a certain range of compositions can be dealloyed.23 Generally, for dealloying AuAg alloy, the continuous ligament structure would collapse and the films tend to fracture or even disintegrate when the content of Ag is lower than 20 at%.23–25 For GNPG40–15, the Ag content of its precursor (Au15–40Ag85–60 alloy) is lower than 20 at% in the top surface range with the thickness of ∼20 nm. Thus, the ligament structure in the top range of GNPG40–15 tends to collapse during the dealloying process. Observation on GNPG40–15 films shows that there is neither disintegration nor cracks in the full surface (Fig. 3a), which indicates the successful fabrication of a NPG structure from an alloy precursor with Au content as low as 15 at%.
This result should attribute to the gradient composition of GNPG precursors, which can lead to a NPG structure with the gradient distribution of ligaments and pores. The formation of nanoporous gold structure through dealloying AuAg alloy is controlled by two mean physical processes: the dissolution of silver atoms into the electrolyte and the coalescence of gold adatoms into stable clusters.6,26 The dissolution of silver atoms generally initiates from the grain boundaries of the alloy surface, then spread throughout the entire alloy layer for the increasing interfacial boundary energy in grain boundary areas, which making them more susceptible to chemical attack.11,27 Clearly, the dissolution of silver atoms has no influence on the distribution of remaining gold atoms, i.e., the distribution of ligaments and pores. The coalescence or diffusion of gold adatoms is the crucial factor of the final dealloying structure. According to the kinetic Monte Carlo simulation by Erlebacher J. et al.,6 the diffusion of gold adatoms is confined to the interface region between the alloy and the electrolyte. Thus, the diffusion of gold only has limited influence on the distribution of gold atoms. Overall, the gradient distribution of gold atoms would not be damaged during the dealloying process, which could lead to a nanoporous gold structure with gradient distribution of ligaments and pores, i.e. GNPG.
To confirm the above supposition, the cross-sectional SEM images of GNPGs are provided in Fig. 3c and d. The film thickness was reduced from ∼90 nm to ∼70 nm due to the shrinkage during selective etching.28 It is hardly to observe the subtle microstructure from the cross-section of fabricated GNPGs due to the extremely thin layer and small ligament size. Therefore, thicker GNGP films (∼550 nm) with the same composition were fabricated for the section view exploration. The observation on these cross-section images (as shown in insets of Fig. 3c and d) confirms that the ligament and pore structure was formed throughout the entire layer with a looser structure on the top and a denser structure at the bottom, which represents the variation of porosities along the thickness direction. It should be noted that no visible pores could be seen at the bottom of these GNPG layers, which indicates that the etching is weak. The content of Au on the bottom is ∼40 at% which exceeds the “parting limit”, thus the etching becomes hard. The increase of residual Ag after 150 s etching in XPS depth profile (Fig. 2c) is another evidence of this deduction. The incomplete etching of GNPGs also leads to a large Ag residual (see the results of EDS in Table 1). The results above demonstrate that a complex ligament and pore structure exists in the thickness direction of GNPG films. This complex nanostructure can bring abundant inner structures into the dull NPG structure, which should thus produce excellent properties in GNPG films.
3.3 SERS of GNPG films
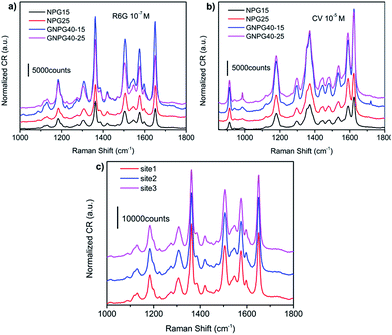
The SERS measurements were implemented via using R6G as the probe molecule. Different Au content in alloy precursors will lead to different porosities in the final dealloyed nanoporous gold, which would significantly affect the SERS property of NPG films.9,12 Thus, two NPG films with different Au content were used as contrast. As shown in Fig. 4a, the GNPG films lead to obvious improvement in the SERS enhancements in comparison with the conventional NPG films. The Raman intensity of GNPG films is about 3–5-fold stronger than NPG films (see Table 2), suggests that GNPG films should be a more potential SERS substrate than NPG films. More interestingly, the variation of Raman intensity for these two kinds of nanoporous gold is quite different. For NPG films, the Raman intensity of NPG25 (the NPG film fabricated by Au25Ag75) is ∼1.5-fold stronger than that of NPG15 (the NPG film fabricated by Au15Ag85). On the contrary, for GNPG films, the Raman intensity of GNPG40–15 is ∼1.7-fold stronger than GNPG40–25. This result implies that the enhancement mechanisms of these two kinds of nanoporous structures should be different, which will be discussed later. To confirm the generality of these results, the SERS spectra of CV molecule were also measured as shown in Fig. 4b. Similar results can be obtained from Fig. 4b, which indicates that it is the inherent property for GNPG films to possess more novel SERS features.| Relative intensity (I) | ||
|---|---|---|
| 1363 cm−1 | 1651 cm−1 | |
| GNPG40–15 | 742![[thin space (1/6-em)]](https://www.rsc.org/images/entities/char_2009.gif) 063.3 ± 27 063.3 ± 27![[thin space (1/6-em)]](https://www.rsc.org/images/entities/char_2009.gif) 000 000 |
711![[thin space (1/6-em)]](https://www.rsc.org/images/entities/char_2009.gif) 140.1 ± 23 140.1 ± 23![[thin space (1/6-em)]](https://www.rsc.org/images/entities/char_2009.gif) 000 000 |
| GNPG40–25 | 481![[thin space (1/6-em)]](https://www.rsc.org/images/entities/char_2009.gif) 424.7 ± 19 424.7 ± 19![[thin space (1/6-em)]](https://www.rsc.org/images/entities/char_2009.gif) 000 000 |
363![[thin space (1/6-em)]](https://www.rsc.org/images/entities/char_2009.gif) 469.1 ± 17 469.1 ± 17![[thin space (1/6-em)]](https://www.rsc.org/images/entities/char_2009.gif) 000 000 |
| NPG15 | 193![[thin space (1/6-em)]](https://www.rsc.org/images/entities/char_2009.gif) 514.3 ± 9500 514.3 ± 9500 |
134![[thin space (1/6-em)]](https://www.rsc.org/images/entities/char_2009.gif) 757.3 ± 6600 757.3 ± 6600 |
| NPG25 | 241![[thin space (1/6-em)]](https://www.rsc.org/images/entities/char_2009.gif) 210.3 ± 11 210.3 ± 11![[thin space (1/6-em)]](https://www.rsc.org/images/entities/char_2009.gif) 000 000 |
244![[thin space (1/6-em)]](https://www.rsc.org/images/entities/char_2009.gif) 804.1 ± 10 804.1 ± 10![[thin space (1/6-em)]](https://www.rsc.org/images/entities/char_2009.gif) 000 000 |
The SERS homogeneities of GNPG films were also investigated by acquiring the Raman signals from three different sites of GNPG40–15. As shown in Fig. 4c, the Raman intensity of these three sites is approximately equal, which indicates that GNPG films are homogeneous enhanced SERS substrates. The homogeneous Raman enhancement of GNPGs originates from their extremely homogeneous distribution of ligaments and pores as shown in Fig. 3a and b.
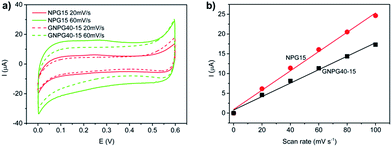
To precisely describe the SERS properties, the relative enhancement factor (EFR) of GNPG films versus NPG films was estimated by the following equation:14,29
| EFR = (IGNPG/NGNPG)/(INPG/NNPG) | (1) |
| EFR = (IGNPG/INPG) × (NNPG/NGNPG) | (2) |
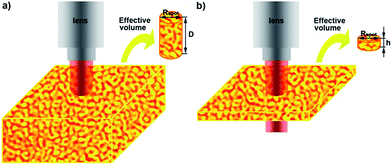
| NNPG/NGNPG = AeffNPG/AeffGNPG = αVNPG/αVGNPG | (3) |
The enhancement mechanisms of GNPG films are discussed below. According to Zhang L. et al.,14 if the SERS enhancement originates from the chemical effect, it will lead to the Raman band shift of ∼20 cm−1 and a stronger enhancement of depolarized bands (dp) than polarized bands (p). Three pairs of Raman bands of the CV molecules are investigated as shown in Fig. 7. Clearly, the Raman band shifts of these peaks compared with that in the FT-Raman spectra31 are less than 20 cm−1 and the Raman intensities of dp modes are weaker than p modes. Thus, the chemical effect should have negligible influence on the Raman enhancement of GNPG films.
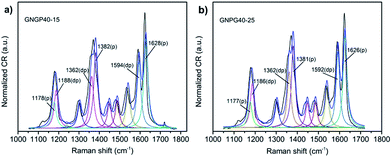 | ||
| Fig. 7 Peak fits of SERS spectra for different GNPG films. (a) GNPG40–15. (b) GNPG40–25. The three pairs of Raman bands were labeled for the comparison of Raman band shifts with the FT-Raman spectra. | ||
Silver may have significant contributions for the enhanced Raman signal of GNPGs because of its stronger SERS enhancement than gold.32 According to the results of XPS (Fig. 2c) and EDS (Table 1), the content of residual silver in GNPG40–15 is less than GNPG40–25. Therefore, if the residual silver in GNPG films plays a key role in the SERS enhancement, the Raman intensity of GNPG40–25 should be stronger than that of GNPG40–15. However, the results of Raman spectra are just opposite. Thus, the residual silver in GNPGs is not the major effect on the Raman enhancement.
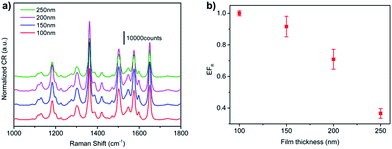
For NPG films, like other gold nano structures, the free electrons in nanosized gold ligaments is believed to generate localized surface plasmon resonance (LSPR) when excited by appropriate incident light, which can enhance the electromagnetic field around the ligaments.12,33 Generally, the enhancement of electromagnetic field is finite for isolated nano structures. While for NPG films, their unique bi-continuous structures can generate intense near-field coupling effect between the neighbouring ligaments, then leads to tremendous electromagnetic enhancement.9,12,34 For GNPG films, on the one hand, they have the similar bi-continuous ligament and pore structures to NPG films, thus it is no doubt that the LSPR effect and near-field coupling effect play a key role on the SERS of GNPGs. On the other hand, the unique gradient structure of GNPGs should have non negligible effect, we called it gradient effect, on their SERS properties. Clearly, the Raman intensity of GNPG40–15 is ∼1.7-fold stronger than GNPG40–25, which should be caused by the increased gradient effect of GNPG40–15. It is no doubt that the gradient effect will increase with the increase of structural gradient. To further prove the existence of gradient effect, the SERS properties of GNPG40–15 films with different thickness are discussed for the increase of film thickness will decrease the structural gradient. Fig. 8a shows the SERS spectra of these samples. To intuitively compare their SERS effect, the EFR is thus estimated as shown in Fig. 8b (the corresponding cyclic voltammograms results are provided in Fig. S3†). The EFR of GNPG40–15 distinctly decreases with the increase of film thickness, which dramatically coincides with the decrease of structural gradient. Therefore, the gradient effect should play a key role in the SERS properties of GNPG films. We believe that for GNPG films, their SERS enhancement is the combination of the LSPR effect of nanosized gold ligaments, the near-field coupling effect of neighbouring ligaments and the gradient effect of the gradient structures. We think the gradient effect may be a kind of structural coupling effect along the thickness direction, which could further enhance the local electric field compared to conventional NPGs. Moreover, this kind of structural coupling effect could easily be increased by the increase of structural gradient. The detailed physical mechanism will be the topic of our further work.
4. Conclusions
We have developed a novel gradient structural nanoporous gold substrate with high Raman enhancement effect, excellent SERS homogeneity and wonderful processing compatibility by combining the traditional magnetron sputtering with dealloying technique. The gradient composition of dealloying precursors leads to the gradient structure of dealloying products, which turns the monotonous NPG films to a vertical 3D nanostructure with abundant inner structures. The gradient structure of GNPG films plays a key role on their SERS enhancement. The relative enhancement factor of GNPG films versus NPG films is estimated to be ∼8 via the calculation of effective surface area. It is believed that the tremendous Raman enhancement of GNPG films is caused by the combination of the LSPR effect of nanosized gold ligaments, the near-field coupling effect of neighbouring ligaments and the gradient effect of the gradient structures.Acknowledgements
This research was supported by the National Natural Science Foundation of China (Grant No. 51401194).Notes and references
- C. L. Haynes, A. D. McFarland and R. P. V. Duyne, Anal. Chem., 2005, 338A–346A CAS.
- J. P. Camden, J. A. Dieringer, J. Zhao and R. P. V. Duyne, Acc. Chem. Res., 2008, 41, 1653–1661 CrossRef CAS PubMed.
- S. O. Kucheyev, J. R. Hayes, J. Biener, T. Huser, C. E. Talley and A. V. Hamza, Appl. Phys. Lett., 2006, 89, 053102 CrossRef.
- M. Fleischmann, P. J. Hendra and A. J. Mcquillan, Chem. Phys. Lett., 1974, 26, 163–166 CrossRef CAS.
- Y. Zhong, J. Markmann, H.-J. Jin, Y. Ivanisenko, L. Kurmanaeva and J. Weissmuller, Adv. Eng. Mater., 2014, 16, 389–398 CrossRef CAS.
- J. Erlebacher, M. J. Aziz, A. Karma, N. Dimitrov and K. Sieradzki, Nature, 2001, 410, 450–453 CrossRef CAS PubMed.
- Y. Ding, Y.-J. Kim and J. Erlebacher, Adv. Mater., 2004, 16, 1897–1900 CrossRef CAS.
- J. Biener, G. W. Nyce, A. M. Hodge, M. M. Biener, A. V. Hamza and S. A. Maier, Adv. Mater., 2008, 20, 1211–1217 CrossRef CAS.
- L. H. Qian, X. Q. Yan, T. Fujita, A. Inoue and M. W. Chen, Appl. Phys. Lett., 2007, 90, 153120 CrossRef.
- Q. Zhang, X. Wang, Z. Qi, Y. Wang and Z. Zhang, Electrochim. Acta, 2009, 54, 6190–6198 CrossRef CAS.
- R. Morrish, K. Dorame and A. J. Muscat, Scr. Mater., 2011, 64, 856–859 CrossRef CAS.
- X. Y. Lang, L. Y. Chen, P. F. Guan, T. Fujita and M. W. Chen, Appl. Phys. Lett., 2009, 94, 213109 CrossRef.
- Y. Jiao, J. D. Ryckman, P. N. Ciesielski, C. A. Escobar, G. K. Jennings and S. M. Weiss, Nanotechnology, 2011, 22, 295302 CrossRef PubMed.
- L. Zhang, X. Lang, A. Hirata and M. Chen, ACS Nano, 2011, 5, 4407–4413 CrossRef CAS PubMed.
- F. Zhao, J. Zeng, M. M. Parvez Arnob, P. Sun, J. Qi, P. Motwani, M. Gheewala, C. H. Li, A. Paterson, U. Strych, B. Raja, R. C. Willson, J. C. Wolfe, T. R. Lee and W. C. Shih, Nanoscale, 2014, 6, 8199–8207 RSC.
- J. Zeng, F. Zhao, J. Qi, Y. Li, C.-H. Li, Y. Yao, T. R. Lee and W.-C. Shih, RSC Adv., 2014, 4, 36682 RSC.
- J. Qi, P. Motwani, M. Gheewala, C. Brennan, J. C. Wolfe and W. C. Shih, Nanoscale, 2013, 5, 4105–4109 RSC.
- G. Ruffato, D. Garoli, S. Cattarin, S. Barison, M. Natali, P. Canton, A. Benedetti, D. De Salvador and F. Romanato, Microporous Mesoporous Mater., 2012, 163, 153–159 CrossRef CAS.
- S. Trasatti and O. A. Petrii, Pure Appl. Chem., 1991, 63, 711–734 CrossRef CAS.
- Z. Qi and J. Weissmüller, ACS Nano, 2013, 7, 5948–5954 CrossRef CAS PubMed.
- E.-J. Gwak, N.-R. Kang, U. B. Baek, H. M. Lee, S. H. Nahm and J.-Y. Kim, Scr. Mater., 2013, 69, 720–723 CrossRef CAS.
- B. H. Rösner, S. Parida, D. Kramer, C. A. Volkert and J. Weissmüller, Adv. Eng. Mater., 2007, 9, 535–541 CrossRef.
- A. Wittstock, J. Biener and M. Baumer, Phys. Chem. Chem. Phys., 2010, 12, 12919–12930 RSC.
- K. Sieradzki, N. Dimitrov, D. Movrin, C. McCall, N. Vasiljevic and J. Erlebacher, J. Electrochem. Soc., 2002, 149, B370 CrossRef CAS.
- R. C. Newman, S. G. Corcoran, J. Erlebacher, M. J. Aziz and K. Sieradzki, MRS Bull., 1999, 24–28 CrossRef CAS.
- J. Erlebacher, J. Electrochem. Soc., 2004, 151, C614 CrossRef CAS.
- X. Lu, T. J. Balk, R. Spolenak and E. Arzt, Thin Solid Films, 2007, 515, 7122–7126 CrossRef CAS.
- S. Parida, D. Kramer, C. Volkert, H. Rösner, J. Erlebacher and J. Weissmüller, Phys. Rev. Lett., 2006, 97, 035504 CrossRef CAS PubMed.
- C. Fang, J. G. Shapter, N. H. Voelcker and A. V. Ellis, RSC Adv., 2014, 4, 19502 RSC.
- S. Trasatti and A. Petrii, Pure Appl. Chem., 1991, 63, 711–734 CrossRef CAS.
- M. V. Canamares, C. Chenal, R. L. Birke and J. R. Lombardi, J. Phys. Chem. C, 2008, 112, 20295–20300 Search PubMed.
- L. Zhang, L. Chen, H. Liu, Y. Hou, A. Hirata, T. Fujita and M. Chen, J. Phys. Chem. C, 2011, 115, 19583–19587 CAS.
- E. Detsi, M. Salverda, P. R. Onck and J. T. M. De Hosson, J. Appl. Phys., 2014, 115, 044308 CrossRef.
- L. H. Qian, A. Inoue and M. W. Chen, Appl. Phys. Lett., 2008, 92, 093113 CrossRef.
Footnote |
| † Electronic supplementary information (ESI) available. See DOI: 10.1039/c6ra28591k |
| This journal is © The Royal Society of Chemistry 2017 |


