 Open Access Article
Creative Commons Attribution 3.0 Unported Licence
Design structure for CePr mixed oxide catalysts in soot combustion†
Lijia Fan,
Kang Xi,
Ying Zhou*,
Qiulian Zhu,
Yinfei Chen and
Hanfeng Lu *
*
College of Chemical Engineering, Zhejiang University of Technology, Hangzhou 310014, PR China. E-mail: wjfx@zjut.edu.cn; luhf@zjut.edu.cn; Tel: +86-571-88320767
First published on 7th April 2017
Abstract
Four CePr mixed oxides with different structures were designed and synthesized using a solid-phase grinding method: a uniform solid solution of Ce and Pr (CePr-NN), Pr6O11-coated CeO2 (CePr-NO), CeO2-coated Pr6O11 (CePr-ON), and particle packing of CeO2 and Pr6O11 (CePr-OO) were obtained, and characterized by XRD, H2-TPR, TEM and TG. The results show that CePr-NN exhibits the best low temperature catalytic activity among the CePr catalysts. CeO2 is the major active phase on the surface of the CePr catalysts, and the use of Pr6O11 as the framework maintains the thermal stability of the CePr composite oxide. Moreover, both the oxygen storage capacity and mobility of the active oxygen of the catalyst were improved with the incorporation of Pr into CeO2, resulting in a higher combustion rate. The “molten state” which appeared during the preparation when nitrate was used as the precursor, plays a significant role in the migration of Ce and Pr, and is the premise of forming different structures of solid solution or coating structure.
Introduction
Particulate matter (PM) is generated from the extensive use of diesel engines, with the main component being carbonaceous particles (often called soot), which is associated with serious risks in terms of human health and environmental issues.1–6 Hence, the removal of PM has become one of the utmost important ongoing research topics in the field of environmental catalysis.5,7 Diesel particulate filters (DPFs) combined with catalytic combustion of renewable technology is considered to be an efficient after-treatment of soot oxidation;3,5,8–10 an effective catalyst with a lower light-off temperature is extremely important for DPF regeneration.5,7,9–13Recently, CeO2 has not only been reported to be used successfully in three-way catalysts,14–17 but also as an excellent catalyst for soot combustion,3,7,12,18–20 because of its remarkable oxygen storage capacity (OSC) and redox property. Thus, CeO2-based catalysts have been investigated by several researchers, with respect to CeO2 doped with noble (e.g., Ag, Pt and Pd),17,21 transition (Cu, Mn, Co and Fe),22–24 and lanthanide (La and Pr) metals.25,26 In many cases, doping CeO2 with alterable valence-state metal ions to generate lattice defects has proven to be an effective method to enhance the redox capacity and oxide-ion mobility.3,7,9,27–29 Moreover, the activity, as well as the thermal stability, of CeO2 could be improved.4,14
In particular, Pr-doped CeO2 is a suitable catalyst for the formation of a solid solution,30,31 because the structures of CeO2 and Pr6O11 are fluorite-like. In addition, the Ce4+ ionic radius (0.097 nm) is considerably similar to that of Pr4+ (0.096 nm), and all of the atoms can exist with the mixed oxidation states of 3+ and 4+ in CePr solid solution. CePr mixed oxides show better performance than other CeO2-based catalysts in soot combustion14,30,32–36 with more active oxygen species and higher oxide-ion mobility, low-temperature activity, and thermal stability.37,38 However, to the best of our knowledge, few reports exist on how Pr penetrates into the CeO2 lattice and on the position distribution in the structure of the two metal elements, which are significantly important for the identification of the relationship between the structures and catalytic properties of CePr mixed oxides.
The preparation methods of CeO2-based catalysts mainly include coprecipitation,3,5,7,8,12,13,22,27,30,31,39 hydrothermal,40–42 citric acid complex combustion,23 sol–gel,2,33,43,44,46–48 solution combustion,40,41 solid-state,26 impregnation,45 (inverse) microemulsion,25,32,35 and solid-phase grinding methods.34,35 Among them, the solid-phase grinding method is the easiest technique to control the positions of the metal atoms in the structure. Moreover, this method is effective for building catalysts with different structures. In this work, CePr mixed oxides with different structures were prepared using a solid-phase grinding method, using different precursors to control the positions of Ce and Pr in the bulk structure. The physical and chemical properties were investigated using thermogravimetry (TG), hydrogen temperature-programmed reduction (H2-TPR), X-ray diffraction (XRD), and transmission electron microscopy (TEM), and associated with soot oxidation. The purpose of this work is to get an insight into the influence of the distribution of Ce and Pr in CePr catalysts on soot combustion performance.
Experimental
Catalyst preparation
Sample pretreatment: CeO2 was prepared using an ammonia coprecipitation method, using the corresponding nitrate as the precursor and ammonia water as the precipitating agent. The required amount of Ce(NO3)3·6H2O was dissolved in deionized water, and a suspension was achieved by dropwise addition of 1 M NH3·H2O until the pH reached 9 to 10. The precipitate obtained was isolated by filtration, washed three times with deionized water, and dried at 110 °C for 12 h. Finally, the sample was calcined at 500 °C for 3 h. Pure Pr6O11 was also prepared using the same coprecipitation method.CePr mixed oxide catalysts were prepared by mixing the appropriate amounts of Ce(NO3)3·6H2O/CeO2 and Pr(NO3)3·6H2O/Pr6O11 in an agate mortar, followed by calcination at 500 °C for 3 h. The resulting mixtures were referred to as CePr-NN (Ce(NO3)3·6H2O and Pr(NO3)3·6H2O), CePr-NO (Ce(NO3)3·6H2O and Pr6O11), CePr-ON (CeO2 and Pr(NO3)3·6H2O), and CePr-OO (CeO2 and Pr6O11).
Catalyst characterization
The structural features of all of the catalysts were characterized by powder XRD. The XRD patterns were recorded on a diffractometer (ARL SCINTAG X’TRA) operated at 45 kV and 30 mA using nickel-filtered Cu-Kα radiation. Diffractograms were registered between 10° and 80° (2θ) with a 0.02° step.The specific surface areas of the samples were determined by N2 adsorption measured at −196 °C, using the Brunauer–Emmett–Teller method and a micropore porosity analyzer (3Flex, Micromeritics, USA). The samples were pretreated under vacuum at 300 °C for 2 h prior to measuring.
The reducibility of the CePr catalysts was studied by performing H2-TPR experiments on a chemisorption analyzer (FINESORB-3010E, Fantai, China). The catalysts (100 mg) were pretreated in a U-shaped quartz reactor at 200 °C for 1 h and subsequently cooled to 100 °C under air flow (30 ml min−1). Then, the catalyst bed was subjected to a flow (30 ml min−1, 5% H2 in Ar) at 100 °C for 20 min, followed by heating at a constant rate (10 °C min−1) up to 750 °C. Finally, the catalyst was cooled under an Ar flow (30 ml min−1). The hydrogen consumption was monitored using a thermal conductivity detector operating at 60 °C and 60 mA.
The micro-morphology and actual composition of the CePr mixed oxides were determined using a HR-TEM (Tecnai G2 F30 S-Twin 300 kV, Philips-FEI, Netherlands) microscope-coupled EDS analyzer.
Raman spectra were acquired using a Raman spectrometer (HR 800 Lab RAM, Horiba Jobin Yvon, France) equipped with a 531.95 nm laser (frequency-doubled Nd:YAG, 20 mW) and a charge-coupled device (CCD) detector (multichannel, air cooled). Approximately 8 mW laser light was focused on the central level of the horizontal FSCR to acquire Raman signals in the liquid phase.
X-ray photoelectron spectroscopy was performed in order to identify the valence states and surface composition of the catalysts on a Kratos AXIS Ultra DLD spectrometer. The analysis system used a monochromatic Al Kα (1486.6 eV) X-ray source, and the pressure was kept below 5 × 10⁻⁷ Torr. The C 1s peak (284.6 eV) was used to calibrate the binding energy (BE).
Catalytic activity measurement
The catalytic activity for soot (Printex-U provided by Degussa) combustion of the CePr catalysts was studied in a TG analyzer (Netzsch STA 409PC, Germany). Soot–catalyst mixtures (catalyst![[thin space (1/6-em)]](https://www.rsc.org/images/entities/char_2009.gif) :
:![[thin space (1/6-em)]](https://www.rsc.org/images/entities/char_2009.gif) soot = 1
soot = 1![[thin space (1/6-em)]](https://www.rsc.org/images/entities/char_2009.gif) :
:![[thin space (1/6-em)]](https://www.rsc.org/images/entities/char_2009.gif) 10) were ground in an agate mortar for 10 min to achieve a “tight contact” condition for obtaining the intrinsic activity of the catalysts. Oxidation experiments involved heating each mixture (approximately 10 mg) at a rate of 10 °C min−1 from 25 °C to 650 °C under a flow of 10% O2 in N2 (50 ml min−1).
10) were ground in an agate mortar for 10 min to achieve a “tight contact” condition for obtaining the intrinsic activity of the catalysts. Oxidation experiments involved heating each mixture (approximately 10 mg) at a rate of 10 °C min−1 from 25 °C to 650 °C under a flow of 10% O2 in N2 (50 ml min−1).
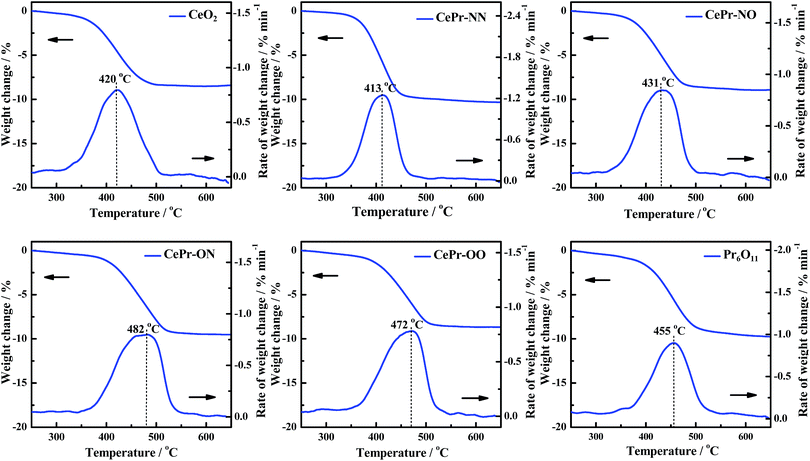
The catalytic activity was evaluated from three aspects: (a) the ignition temperature of the soot (Ti, the extrapolated starting point of the TG curve); (b) the temperature at the highest rate of soot oxidation (Tm, the maximum of the DTG curve); (c) the burnout temperature of the soot (Tf, the extrapolated ending point of the TG curve).
Results and discussion
Structural design of the catalysts
CePr catalysts with different structures were prepared from different precursors as designed. The structure of the CePr-NN catalyst is a uniform composition of Ce and Pr; CePr-NO is Pr6O11-coated CeO2, CePr-ON is CeO2-coated Pr6O11, and CePr-OO is particle packing of CeO2 and Pr6O11 (Fig. 1). Furthermore, the corresponding TEM images and mapping results are shown in Fig. 1. Fig. 1 shows the difficulty in distinguishing the phases of Ce and Pr in CePr-NN, which may be attributed to the even distribution of Ce and Pr, and results in the formation of a good solid solution structure. Pr6O11 exists on the surface of CeO2 in CePr-ON, whereas CePr-NO shows the opposite. The accumulation of CeO2 and Pr6O11 particles can be observed in CePr-OO. The X-EDS analysis of the catalysts (Table 1) and the elemental maps exhibiting the proportion and the distribution of Ce and Pr reveal that the structures of the catalysts that we prepared are similar to our design. These results provide clear evidence that nitrates are needed for preparing a CePr solid solution.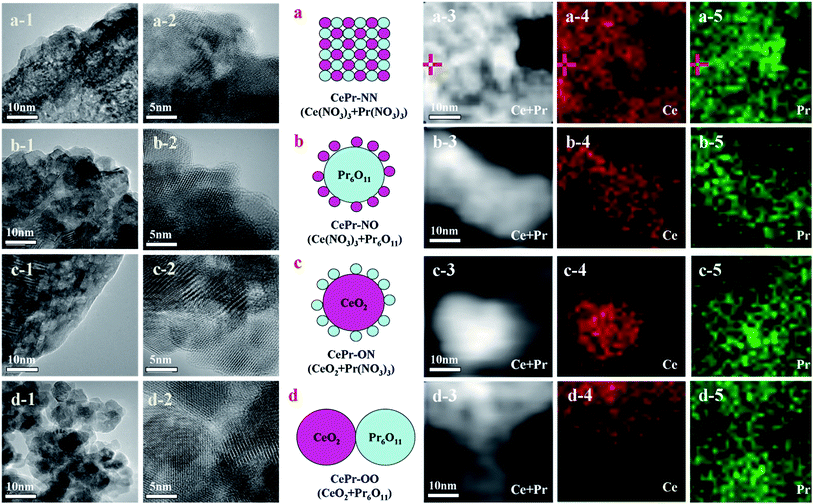 | ||
| Fig. 1 Structure design and TEM images (mapping results) of the CePr mixed oxides. (a) CePr-NN; (b) CePr-NO; (c) CePr-ON; (d) CePr-OO. | ||
| Sample | Weight/% | Atomic/% | Sample | Weight/% | Atomic/% | ||
|---|---|---|---|---|---|---|---|
| CePr-NN | Ce | 69.22 | 69.34 | CePr-ON | Ce | 41.67 | 41.80 |
| Pr | 30.77 | 30.77 | Pr | 58.32 | 58.19 | ||
| CePr-NO | Ce | 63.46 | 63.59 | CePr-OO | Ce | 53.56 | 53.70 |
| Pr | 36.53 | 36.40 | Pr | 46.43 | 46.29 | ||
Presently, several researchers have been devoted to obtaining different structures of catalysts for soot combustion, because the structure plays an important role in catalytic activity.41,42 This work shows that different combinations of precursors can build different structures of CePr catalysts using the simple solid-phase grinding method.
Textural and structural characterization
The XRD patterns of the catalysts are shown in Fig. 2. The lattice constants of CeO2 were calculated from the XRD patterns, based on Bragg’s law, and the average crystallite sizes were calculated from the FWHM of the XRD peak using the Scherrer equation (Table 2). All of the diffraction peaks of CeO2 in the 2θ range of 10° to 80° are remarkably near each other (Fig. 2(A)), because Ce and Pr have similar characteristics. However, a slight change in the diffraction peaks can be clearly observed in the enlarged version (Fig. 2(B)). For all of the CePr catalysts, the X-ray reflections shifted toward 2θ angles between CeO2 and Pr6O11, especially for CePr-NN. This finding suggests that a good solid solution structure is formed in CePr-NN, completely inserting Pr into the CeO2 crystal lattice, causing the increase of the lattice constant value. The broad diffraction peak in this region of CePr-OO does not suggest an external force during the oxide reaction. The 2θ value is the arithmetic mean of CeO2 and Pr6O11; thus, the CePr-OO structure may be particle packing of CeO2 and Pr6O11.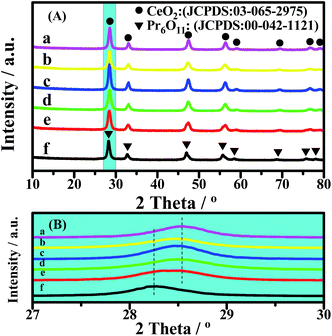 | ||
| Fig. 2 XRD patterns of the CePr catalysts with different structures. (a) CeO2; (b) CePr-NN; (c) CePr-NO; (d) CePr-ON; (e) CePr-OO; (f) Pr6O11. | ||
| Sample | 2θ | Lattice constant/nm | Crystallite size/nm | SBET/m2 g−1 | Lattice strain/% |
|---|---|---|---|---|---|
| CeO2 | 28.5458 | 0.5412 | 12.4 | 38.2200 | 1.113 |
| CePr-NN | 28.4660 | 0.5426 | 10.4 | 24.9019 | 1.336 |
| CePr-NO | 28.5328 | 0.5414 | 12.1 | 36.3385 | 1.148 |
| CePr-ON | 28.4994 | 0.5420 | 10.1 | 23.9571 | 1.189 |
| CePr-OO | 28.4660 | 0.5426 | 10.2 | 48.8569 | 1.305 |
| Pr6O11 | 28.2784 | 0.8919 | 13.5 | 30.7774 | 1.034 |
The characteristic diffraction peak of CeO2 in CePr-NO and CePr-ON did not deviate from that of pure CeO2, indicating that Pr did not dissolve into the CeO2 lattice. The 2θ value and lattice constant of CePr-NO are relatively near those of CeO2, indicating that CePr-NO formed upon the interaction between Ce4+ and Pr6O11 during the NO3− decomposition process; thus, CeO2 was exposed on the Pr6O11 surface. However, CePr-ON is opposite to CePr-NO.
The lattice strain values of the catalysts are shown in Table 2. It can be found that certain distortion occurred in the lattice structure of the catalyst, indicating that Pr inserts into the CeO2 crystal lattice. The greater the lattice strain value, the better the solid solution effect. It is thus reasonable to conclude that a good solid solution structure is formed in CePr-NN with the largest distortion.
In addition, doping with Pr is advantageous to obtain a reduction in crystallite sizes. However, the catalytic performance of the catalyst is not proportional to the specific surface area, as shown in Table 2. This demonstrated that the specific surface area is not the major factor in controlling the catalytic performance for soot combustion. There may be several other factors that do affect the catalytic performance, for example the number of contact points between the soot and catalyst particles, because soot oxidation occurs on the triple-contact point of gas (O2)–solid (catalyst)–solid (soot).49,50 Agreeing with previous observations of Shangguan et al.,51,52 we conclude that the specific surface area is not an important feature that influences the catalyst activity for soot combustion. The XRD results clearly confirm that the solid-phase grinding method used in this work is efficient in building different structures for CePr catalysts with different activities prepared from different precursors.
Redox properties
H2-TPR was performed to investigate the reducibility of the four kinds of CePr catalysts, the results of which are shown in Fig. 3. Pure CeO2 shows a wide reduction peak, which can be attributed to the reduction of Ce4+ to Ce3+. Pure Pr6O11 shows a large reduction peak below 200 °C but lost the reactive oxygen species before reaching the ignition temperature of soot combustion; thus, the light-off temperature increased to 406 °C. According to the literature,53 the oxygen release capacity of the catalysts in the range of 200 °C to 400 °C is a significant factor in determining the soot combustion performance. Thus, the H2 consumption of the four kinds of CePr catalysts in this temperature range was calculated by integrating the corresponding peak areas with that of a standard sample (CuO). Almost all of the reduction peaks of the catalysts fall within the range of the soot oxidation temperature, belonging to Ce4+ → Ce3+ and Pr4+ → Pr3+. The OSC of CeO2 is greatly enhanced by introducing Pr, which could provide more lattice oxygen, thereby leading to a higher combustion rate because of the further increase in the amount of available active oxygen. Particularly, CePr-NN shows a major reduction peak at 315 °C, which is due to the formation of a solid solution structure caused by the complete insertion of Pr into the CeO2 crystal lattice, and results in a significant improvement in OSC. Generally, the increased oxygen vacancies caused by the presence of Pr lead to easy exchange of oxygen. Therefore, the amount of reactive oxygen species can be increased and they are easily reduced by H2 at low temperature.34,54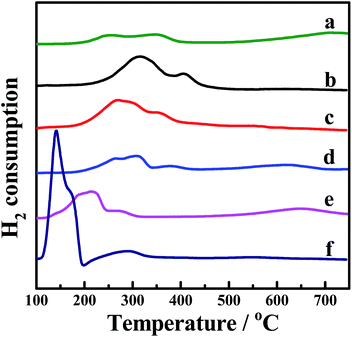 | ||
| Fig. 3 H2-TPR profiles of the CePr catalysts prepared from different precursors. (a) CeO2; (b) CePr-NN; (c) CePr-NO; (d) CePr-ON; (e) CePr-OO; (f) Pr6O11. | ||
Two reduction peaks exist for CePr-NO, which simultaneously shift to lower temperatures compared with those of CePr-ON. CeO2 is believed to be the major active component in CePr catalysts, which is located on the surface, where reduction is easier. In combination with the XRD patterns, a solid solution structure is confirmed to be absent in the four kinds of CePr catalysts besides CePr-NN. Therefore, the good redox capacity at low temperature of these mixed oxides is mostly related to the synergy of CeO2 and Pr6O11.
In addition, as calculated from Table 3, 0.7 times the H2 consumption of CeO2 plus 0.3 times the H2 consumption of Pr6O11 is 0.028 g. The value is less than that of CePr catalysts, implying that the delivery of oxygen capability increased through the synergistic effect between CeO2 and Pr6O11, resulting in a good redox property.
| Sample | Temperature of peak and H2 consumption (H2-TPR) | Ti/°C | Tm/°C | Tf/°C | |
|---|---|---|---|---|---|
| T/°C | n(H2)/(mmol g−1) | ||||
| CeO2 | 257 | 0.0285 | 370 | 420 | 467 |
| CePr-NN | 315 | 0.1421 | 370 | 413 | 443 |
| CePr-NO | 276 | 0.1229 | 379 | 431 | 471 |
| CePr-ON | 284 | 0.1005 | 411 | 482 | 517 |
| CePr-OO | 203 | 0.0701 | 404 | 472 | 502 |
| Pr6O11 | 141 | 0.0268 | 406 | 455 | 493 |
The TPR results indicate that the solid solution structure is conducive to the production of more oxygen vacancies, improving the OSC of the CePr catalysts. Therefore, a more reactive oxygen species is proposed to be generated via the method of doping Pr with nitrate.
Oxygen vacancies
The Raman spectra of the CePr catalysts with different structures are displayed in Fig. 4, the purpose of which is to demonstrate the formation of the oxygen vacancies. The Raman peak near 465 cm−1 is attributed to the F2g Raman mode of CeO2, characteristic of a fluorite structured material.34,55–57 The band at 465 cm−1 shifts to a lower frequency, indicating the formation of the solid solution.32,34 Thus, the band shifted down to 447 cm−1 of CePr-NN suggests the formation of a CePr solid solution. Meanwhile, the peak at a Raman shift of 570 cm−1 corresponds to the presence of oxygen vacancies.34,56 Comparison of the Raman line shape in the four CePr mixed oxides shows that the incorporation of Pr ions into CeO2 must be accompanied by the generation of oxygen vacancies. The population of oxygen vacancies is proportional to the peak area ratio of about 570 to 450 cm−1.55,58 The data collected in Table 4 imply that there are more oxygen vacancies for CePr-NN than for the other three CePr catalysts, which is in agreement with the results of H2-TPR.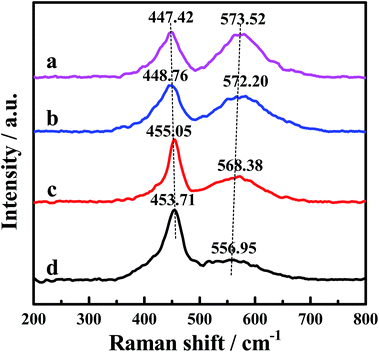 | ||
| Fig. 4 Raman spectra of the CePr catalysts with different structures. (a) CePr-NN; (b) CePr-NO; (c) CePr-ON; (d) CePr-OO. | ||
| Sample | A570/A450 | Sample | A570/A450 |
|---|---|---|---|
| CePr-NN | 1.744 | CePr-ON | 1.076 |
| CePr-NO | 1.470 | CePr-OO | 0.559 |
Surface properties
The oxidation states and surface composition of the catalysts were obtained by XPS analysis. The O 1s spectra of the samples are shown in Fig. 5. The spectra show three types of oxygen species. The peak with a lower binding energy at 528.49–528.74 eV was generally assigned to a normal O 1s (OI) signal that corresponds to the lattice oxygen type. The peak with a binding energy at 530.88–531.18 eV was attributed to oxygen species in the defects (denoted as OII) (e.g., O2−, O22− or O−), and the peak with a binding energy at 532.00–532.62 eV could instead be attributed to hydroxyl-like groups and adsorbed molecular water (OIII).5 The relative percentages of the three oxygen species were quantified based on the area ratios of their peaks (Table 5).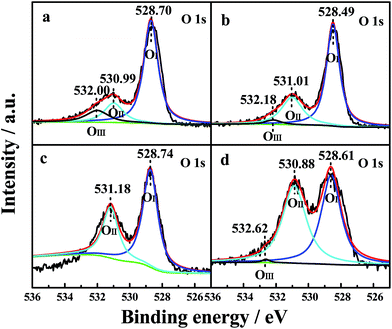 | ||
| Fig. 5 O 1s XPS profiles of the four CePr catalysts. (a) CePr-NN; (b) CePr-NO; (c) CePr-ON; (d) CePr-OO. | ||
| Sample | OIII/% | OII/% | OI/% | Ce 3d/% | Pr 3d/% |
|---|---|---|---|---|---|
| CePr-NN | 12.51 | 17.33 | 70.16 | 59.04 | 40.96 |
| CePr-NO | 3.47 | 29.05 | 67.48 | 51.19 | 48.81 |
| CePr-ON | — | 35.08 | 64.92 | 38.09 | 61.91 |
| CePr-OO | 0.65 | 50.79 | 48.56 | 35.85 | 64.15 |
As observed from Table 5, the relative percentages of OII detected from CePr-NO, CePr-ON and CePr-OO were obviously higher than that of CePr-NN. However, the majority of the defect oxygen species of these three CePr catalysts might result from Pr6O11 on the surface of the catalysts. This should be due to the large reduction peak below 200 °C of Pr6O11. Obviously, these oxygen species do not work for the soot combustion reaction. This is because the oxygen release capacity of the catalysts in the range of 200 °C to 400 °C is responsible for the soot reaction.53 Combined with the results of the H2-TPR analysis, it is deduced that the defect oxygen species caused by Pr6O11 is the ineffective oxygen. Therefore, CeO2 is considered as the active phase in CePr catalysts. Only the CePr-NN with the highest H2 consumption between 200 °C and 400 °C possesses the most effective active oxygen. Generally, OII is responsible for oxidation reactions.5 It can be established that the essentiality of enough OI and OIII required for supplemental effective active oxygen (OII) in the channel of oxygen migration (OI ↔ OII ↔ OIII) could be significant for the improvement of the OSC of the catalysts. Based on the above results, it can be concluded that CePr-NN showed the best catalytic activity and the fastest oxidation rate compared with the other three CePr catalysts, which might be attributed to its abundant oxygen species of OI and OIII.
The Ce 3d XP spectra and Pr 3d XP spectra of the catalysts are presented in Fig. 6. Meanwhile, the atomic concentrations of Ce and Pr at the surface of the catalysts are also shown in Table 5. The corresponding binding energies of Ce 3d and Pr 3d are not very different (870 and 970 eV, respectively).30 The main features of Ce 3d are composed of ten peaks. The peaks labelled as u are due to corresponding 3d3/2 spin–orbit states, and those labelled as v are due to 3d5/2 states. It can be seen from the spectrum that the four peaks labelled as u0, u′, v0 and v′ are attributed to Ce3+ ions, and the other peaks labelled as u, u′′, u′′′, v, v′′ and v′′′ are related to Ce4+ ions.5 Analysis of the spectra indicates that in the CePr mixed oxides cerium is present in both the 3+ and 4+ oxidation states, with the major oxidation state being 4+. Moreover, the relative intensity of the two peaks annotated u′ and v′ of CePr-NN is more prominent than for the other three catalysts, indicating that the incorporation of Pr4+ results in more surface Ce3+ in the solid solution structure. The existence of Ce3+ in the CeO2 lattice implies the formation of oxygen vacancies.31 Furthermore, the higher the Ce3+ concentration of the total Ce that exists, the more oxygen vacancies there are.
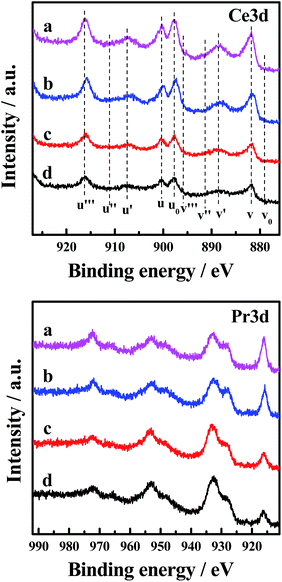 | ||
| Fig. 6 Ce 3d and Pr 3d XP spectra of the four CePr catalysts. (a) CePr-NN; (b) CePr-NO; (c) CePr-ON; (d) CePr-OO. | ||
Catalyst activity in soot combustion
The activity measurements of the CePr catalysts for soot oxidation were investigated under an O2/N2 atmosphere under “tight contact” conditions and are presented in Fig. 7. Generally, this analysis is used to discriminate the catalysts in terms of their intrinsic activity.3 The catalytic activities of the four kinds of CePr catalysts are compared using the reaction temperatures referred to as Ti, Tm, and Tf (Table 3). Obviously, CePr-NN gave the best low-temperature catalytic activity among the CePr catalysts, followed by CePr-NO, CePr-OO and CePr-ON. CePr-NN exhibits a similar catalytic activity to CeO2; CeO2 presents a higher activity than the three other CePr catalysts. This finding indicates that CeO2 is the major active component of the CePr mixed oxides. Therefore, the greater amount of CeO2 exposed on the catalyst surface results in a higher activity of soot oxidation.Combined with the XRD results, the higher combustion rate of CePr-NN compared with that of pure CeO2 is caused by the presence of a solid solution structure with a smaller crystal size and more defects, which could be beneficial to improve the OSC. In combination with the H2-TPR profiles, the reducibility of the CePr catalysts basically presents regularity on the soot combustion activity; in other words, a larger H2 consumption means a better catalytic activity. In addition, the small reduction peaks of CePr-ON and CePr-OO suggest that there are few surface oxygen species, which provide results at 30 °C to 40 °C, increasing the ignition temperature. However, the large amount of high-temperature lattice oxygen is not sufficient for soot oxidation, leading to the burnout temperature being above 500 °C.
If one focuses on the ignition temperature of CePr-NN, reduction is not obtained as it is with pure CeO2, but the rate of catalytic combustion is accelerated because of ΔT = Tf − Ti (the difference between the ignition temperature and burnout temperature). This means that the solid solution structure is beneficial for the enhancement of the soot oxidation rate. This reaction is caused by the large number of active oxygen species with high density and high mobility in the low-temperature range. In conclusion, CePr catalysts with different structures prepared from different precursors directly affect the soot combustion performance.
Grinding times for CePr-NN
The influence of uniformity (grinding times) in the solid-phase grinding method is studied. The activities of the CePr-NN catalysts prepared with different grinding times were measured, and are shown in Fig. 8. The corresponding reaction temperatures (Ti, Tm and Tf) are presented in Table 6 to compare the catalytic activities. The Ti values vary in a significantly narrow range (364 °C to 368 °C) as the grinding time increases, indicating a similar low-temperature catalytic activity for all of the CePr-NN catalysts. The catalytic activity did not increase with the increase of uniformity compared with that of CePr prepared by Pechini process.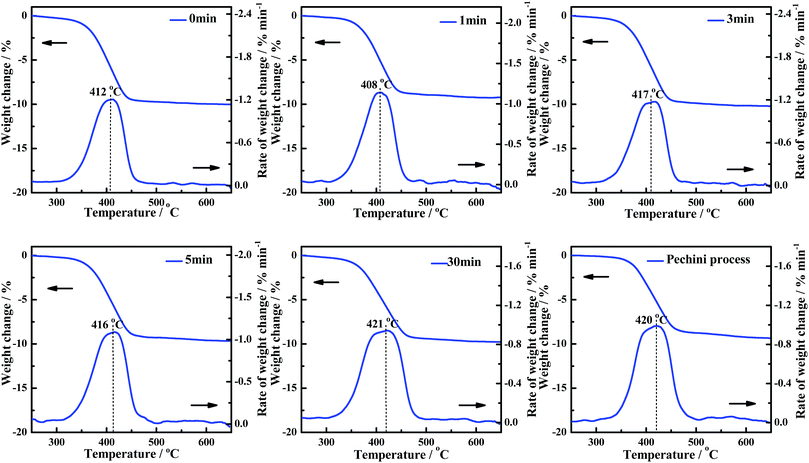 | ||
| Fig. 8 TG and DTG curves of the soot/catalyst mixture for CePr-NN catalysts prepared with different grinding times. | ||
| Grinding time/min | Ti/°C | Tm/°C | Tf/°C | Grinding time/min | Ti/°C | Tm/°C | Tf/°C |
|---|---|---|---|---|---|---|---|
| 0 | 365 | 412 | 438 | 5 | 365 | 416 | 445 |
| 1 | 368 | 408 | 439 | 30 | 364 | 421 | 455 |
| 3 | 365 | 417 | 442 | Pechini process | 370 | 420 | 452 |
The experiments point out that the grinding time does not affect the activity of CePr-NN for soot combustion. Thus, high-activity CePr catalysts can be prepared without prolonged grinding. However, the activity of the CePr-NN catalyst being independent from the grinding time remains unclear. Thus, nitrates were studied directly by means of TG to observe the change of states in the heating process.
The DSC curves corresponding to any changes in the heat of CePr-NN are shown in Fig. 9. A considerable amount of heat was absorbed during the sequential loss in both physical and hydrated water, as well as thermal decomposition process of the nitrates.59–61 Fig. 10 shows that solid turns into liquid (“molten state”) when nitrates reach their melting points (96 °C for cerium nitrate and 56 °C for praseodymium nitrate) with increasing temperature. The molten state is present until the nitrates completely decomposed into our catalyst. Therefore, we suggest that Ce4+ and Pr4+ migrate quickly to accomplish mixing, which could occur instead of grinding in this process. In addition, heat absorbed during NO3− decomposition also plays an important role in Ce4+ and Pr4+ migration.
In this regard, the existence of the molten state is an important factor for preparing CePr catalysts with different structures. Particularly, the high catalytic activity of CePr-NN is mainly attributed to the formation of a solid solution structure. Thus, for soot combustion, the grinding time is not considered to be important, which means that high activity catalysts can be prepared without grinding when nitrates are used as precursors.
Thermal stability test
The thermal stability was therefore examined because CePr-NN exhibits the same good catalytic activity as pure CeO2 toward soot combustion. To prove that the catalytic performance of CePr-NN is better than that of CeO2 in soot oxidation, the thermal stability of the catalysts was characterized by calcining at 800 °C for 10 h (marked as A) and compared with the catalytic activity at 500 °C for 10 h (marked as F).Fig. 11 shows the TG and DTG curves for soot combustion for the fresh and aging samples of CeO2, CePr-NN, and Pr6O11. The measured values of Ti, Tm, and Tf from the DTG are listed in Table 7. As shown in Fig. 11, both CeO2 and CePr-NN demonstrate good activity at 500 °C. The thermal stability test performed at 800 °C shows that the soot combustion is faster in the case of CePr-NN compared with that of CeO2, for which the activity decreased sharply with serious sintering. Ti did not increase remarkably with respect to the fresh sample, indicating that CePr-NN has good thermal stability. Note that Pr6O11 shows high stability, and the supporting phase, Pr, is thus concluded to enhance both the combustion rate and thermal stability of the catalyst toward soot oxidation.
| Sample | Ti/°C | Tm/°C | Tf/°C | Sample | Ti/°C | Tm/°C | Tf/°C |
|---|---|---|---|---|---|---|---|
| CeO2-F | 370 | 420 | 467 | CeO2-A | 452 | 548 | 599 |
| Pr6O11-F | 406 | 455 | 493 | Pr6O11-A | 438 | 503 | 544 |
| CePr-NN-F | 370 | 413 | 443 | CePr-NN-A | 388 | 443 | 470 |
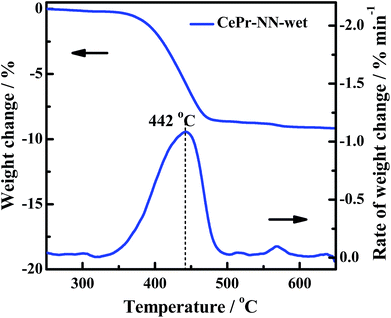
The gas composition is complex in engine exhausts, and includes H2O, COx, NOx and HC. The soot oxidation reaction may be affected by these gases. Previous research and literature have shown that NOx is a powerful oxidant,17 which is conducive to a significant decrease in the soot oxidation temperature; H2O may also affect the activity structure of the catalyst. Therefore, an experiment of treatment of CePr-NN-F at 850 °C in a wet atmosphere (100% relative humidity) for a couple of hours has been shown (Fig. 12). After treatment with steam, the activity of the catalyst is close to that of CePr-NN-A, which exhibits Ti, Tm and Tf values of 395, 444 and 467 °C, respectively. This indicated that CePr-NN-F exhibits good stability in the presence of steam.
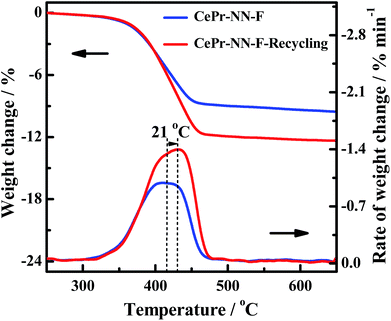
In order to further verify the reuse of the CePr-NN catalyst, a recycling experiment has been conducted. The residual CePr-NN catalyst which has burned soot in the crucible was mixed with soot particles (catalyst![[thin space (1/6-em)]](https://www.rsc.org/images/entities/char_2009.gif) :
:![[thin space (1/6-em)]](https://www.rsc.org/images/entities/char_2009.gif) soot = 1
soot = 1![[thin space (1/6-em)]](https://www.rsc.org/images/entities/char_2009.gif) :
:![[thin space (1/6-em)]](https://www.rsc.org/images/entities/char_2009.gif) 10), and then the catalytic activity of the catalyst was studied in the TG analyzer again, the results of which are shown in Fig. 13. It can be seen that CePr-NN has an excellent recyclability, illustrating that CePr-NN could maintain a stable active structure in the reaction.
10), and then the catalytic activity of the catalyst was studied in the TG analyzer again, the results of which are shown in Fig. 13. It can be seen that CePr-NN has an excellent recyclability, illustrating that CePr-NN could maintain a stable active structure in the reaction.
Conclusions
Incorporation of Pr atoms into CeO2 with nitrates as precursors mainly improves its OSC and the mobility of active oxygen at 200 °C to 400 °C, which leads to a higher combustion rate without affecting the soot ignition temperature. In addition, doping CeO2 with Pr can greatly enhance its thermal stability, because highly stable Pr6O11 is used as the supporting phase of the catalyst for soot oxidation. The molten state appeared during the preparation when nitrate is used as the precursor, and the heat absorbed when NO3− decomposed plays an important role in the migration of Ce and Pr. Subsequently, CePr catalysts with different structures are formed, whose activities are independent of the grinding time. Particularly, CePr-NN with a solid solution structure exhibits an accelerated combustion rate and high thermal stability for soot combustion.Acknowledgements
We would like to acknowledge the financial support from the Natural Science Foundation of China (No. 21506194, 21676255), Zhejiang Provincial Natural Science Foundation of China (No. Y14E080008, Y16B070025).Notes and references
- B. R. Stanmore, J. F. Brilhac and P. Gilot, Carbon, 2001, 39, 2247–2268 CrossRef CAS.
- Y. Q. Sheng, Y. Zhou, H. F. LU, Z. K. Zhang and Y. F. Chen, Chin. J. Catal., 2013, 34, 567–577 CrossRef CAS.
- P. A. Kumar, M. D. Tanwar, S. Bensaid, N. Russo and D. Fino, Chem. Eng. J., 2012, 207–208, 258–266 CrossRef CAS.
- D. Fino, S. Bensaid, M. Piumetti and N. Russo, Appl. Catal., A, 2016, 509, 75–96 CrossRef CAS.
- P. Venkataswamy, D. Jampaiah, K. N. Rao and B. M. Reddy, Appl. Catal., A, 2014, 488, 1–10 CrossRef CAS.
- Q. Shen, M. F. Wu, H. Wang, C. He, Z. P. Hao, W. Wei and Y. H. Sun, Catal. Sci. Technol., 2015, 5, 1941–1952 CAS.
- L. Katta, P. Sudarsanam, G. Thrimurthulu and B. M. Reddy, Appl. Catal., B, 2010, 101, 101–108 CrossRef CAS.
- J. Giménez-Mañogil and A. García-García, Fuel Process. Technol., 2015, 129, 227–235 CrossRef.
- E. Aneggi, N. J. Divins, C. D. Leitenburg, J. Llorca and A. Trovarelli, J. Catal., 2014, 312, 191–194 CrossRef CAS.
- M. Haneda and A. Towata, Catal. Today, 2015, 242, 351–356 CrossRef CAS.
- G. C. Zou, Y. Xu, S. J. Wang, M. X. Chen and W. F. Shangguan, Catal. Sci. Technol., 2015, 5, 1084–1092 CAS.
- E. Aneggi, C. D. Leitenburg and A. Trovarelli, Catal. Today, 2012, 181, 108–115 CrossRef CAS.
- H. L. Zhang, Y. Zhu, S. D. Wang, M. Zhao, M. C. Gong and Y. Q. Chen, Fuel Process. Technol., 2015, 137, 38–47 CrossRef CAS.
- A. Bueno-López, Appl. Catal., B, 2014, 146, 1–11 CrossRef.
- M. Shelef and R. W. McCabe, Catal. Today, 2000, 62, 35 CrossRef CAS.
- R. M. Heck and R. J. Farrauto, Appl. Catal., A, 2001, 221, 443 CrossRef CAS.
- S. Liu, X. D. Wu, D. Weng and R. Ran, J. Rare Earths, 2015, 33, 567–590 CrossRef CAS.
- C. Lee, J. I. Park, Y. G. Shul, H. Einaga and Y. Teraoka, Appl. Catal., B, 2015, 174–175, 185–192 CrossRef CAS.
- A. Bueno-López, K. Krishna, M. Makkee and J. A. Moulijn, Catal. Lett., 2015, 99, 203–205 CrossRef.
- P. Palmisano, N. Russo, D. Fino and C. Badini, Appl. Catal., B, 2006, 69, 85–92 CrossRef CAS.
- C. B. Lim, H. Kusaba, H. Einaga and Y. Teraoka, Catal. Today, 2011, 175, 106–111 CrossRef CAS.
- M. L. Fu, X. H. Yue, D. Q. Ye, J. H. Ouyang, B. C. Huang, J. L. Wu and H. Liang, Catal. Today, 2010, 153, 125–132 CrossRef CAS.
- H. Muroyama, S. Hano, T. Matsui and K. Eguchi, Catal. Today, 2010, 153, 133–135 CrossRef CAS.
- M. Dhakad, T. Mitshuhashi, S. Rayalu, P. Doggali, S. Bakardjiva, J. Subrt, D. Fino, H. Haneda and N. Labhsetwar, Catal. Today, 2008, 132, 188–193 CrossRef CAS.
- M. A. Małecka, L. Kępiński and W. Miśta, Appl. Catal., B, 2007, 74, 290–298 CrossRef.
- K. Harada, T. Oishi, S. Hamamoto and T. Ishihara, J. Phys. Chem. C, 2014, 118, 559–568 CAS.
- H. Muroyama, H. Asajima, S. Hano, T. Matsui and K. Eguchi, Appl. Catal., A, 2015, 489, 235–240 CrossRef CAS.
- L. F. Nascimento, R. F. Martins, R. F. Silva, P. C. de Sousa Filho and O. A. Serra, React. Kinet. Catal. Lett., 2014, 111, 149–165 CrossRef CAS.
- E. Saab, S. Aouad, E. Abi-Aad, E. Zhilinskaya and A. Aboukaïs, Catal. Today, 2007, 119, 286–290 CrossRef CAS.
- B. de Rivas, N. Guillén-Hurtado, R. López-Fonseca, F. Coloma-Pascual, A. García-García, J. I. Gutiérrez-Ortiz and A. Bueno-López, Appl. Catal., B, 2012, 121–122, 162–170 CrossRef CAS.
- G. Thrimurthulu, K. N. Rao, D. Devaiah and B. M. Reddy, Res. Chem. Intermed., 2012, 38, 1847–1855 CrossRef CAS.
- N. Guillén-Hurtado, A. García-García and A. Bueno-López, Appl. Catal., B, 2015, 174–175, 60–66 CrossRef.
- P. Fang, M. F. Luo, J. Q. Lu, S. Q. Cen, X. Y. Yan and X. X. Wang, Thermochim. Acta, 2008, 478, 45–50 CrossRef CAS.
- V. Rico-Pérez, E. Aneggi, A. Bueno-López and A. Trovarelli, Appl. Catal., B, 2016, 197, 95–104 CrossRef.
- V. Rico-Pérez and A. Bueno-López, Chem. Eng. J., 2015, 279, 79–85 CrossRef.
- L. Katta, P. Sudarsanam, G. Thrimurthulu and B. M. Reddy, Appl. Catal., B, 2010, 101, 101–108 CrossRef CAS.
- J. Liu, Z. Zhao, C. M. Xu, A. J. Duan, L. Wang and S. J. Zhang, Catal. Commun., 2007, 8, 220–224 CrossRef CAS.
- G. Z. Zhang, Z. Zhao, J. F. Xu, J. X. Zheng, J. Liu, G. Y. Jiang, A. J. Duan and H. He, Appl. Catal., B, 2011, 107, 302–315 CrossRef CAS.
- I. Atribak, B. Azambre, A. Bueno López and A. García-García, Appl. Catal., B, 2009, 92, 126–137 CrossRef CAS.
- M. Piumetti, S. Bensaid, N. Russo and D. Fino, Appl. Catal., B, 2015, 165, 742–751 CrossRef CAS.
- P. Miceli, S. Bensaid, N. Russo and D. Fino, Chem. Eng. J., 2015, 278, 190–198 CrossRef CAS.
- K. Nakagawa, T. Ohshima, Y. Tezuka, M. Katayama, M. Katoh and S. Sugiyama, Catal. Today, 2015, 246, 67–71 CrossRef CAS.
- C. F. Oliveira, F. A. C. Garcia, D. R. Araújo, J. L. Macedo, S. C. L. Dias and J. A. Dias, Appl. Catal., A, 2012, 413–414, 292–300 CrossRef CAS.
- L. F. Nascimento, R. F. Martins and O. A. Serra, J. Rare Earths, 2014, 7, 610–620 CrossRef.
- M. A. Małecka, Ceram. Int., 2016, 42, 14826–14833 CrossRef.
- H. F. Lu, X. X. Kong, H. F. Huang, Y. Zhou and Y. F. Chen, J. Environ. Sci., 2015, 32, 102–107 CrossRef PubMed.
- Y. Zhou, C. J. Xu, Y. Q. Sheng, Q. L. Zhu, Y. F. Chen and H. F. Lu, RSC Adv., 2015, 5, 91734–91741 RSC.
- H. F. Lu, Y. Zhou, H. F. Huang, B. Zhang and Y. F. Chen, J. Rare Earths, 2011, 9, 855–860 CrossRef.
- N. J. Feng, J. Meng, Y. Wu, C. Chen, L. Wang, L. Gao, H. Wan and G. F. Guan, Catal. Sci. Technol., 2016, 6, 2930–2941 CAS.
- J. G. Wang, L. Cheng, W. An, J. L. Xu and Y. Men, Catal. Sci. Technol., 2016, 6, 7342–7350 CAS.
- W. F. Shangguan, Y. Teraoka and S. Kagawa, Appl. Catal., B, 1997, 12, 237–247 CrossRef CAS.
- Z. P. Wang, Z. X. Zhang and W. F. Shangguan, Chem. Res. Chin. Univ., 2009, 30, 2226–2232 CrossRef CAS.
- G. Mul, F. Kapteijn and J. A. Moulijn, Appl. Catal., B, 1997, 12, 33–47 CrossRef CAS.
- M. F. Luo, Z. L. Yan and L. Y. Jin, J. Mol. Catal. A: Chem., 2006, 260, 157–162 CrossRef CAS.
- Y. J. Luo, K. C. Wang, Y. X. Xu, X. Y. Wang, Q. R. Qian and Q. H. Chen, New J. Chem., 2015, 39, 1001–1005 RSC.
- J. E. Spanier, R. D. Robinson, F. Zhang, S.-W. Chan and I. P. Herman, Phys. Rev. B: Condens. Matter Mater. Phys., 2001, 245–407, 1–8 Search PubMed.
- V. G. Keramidas and W. B. White, J. Chem. Phys., 1973, 59, 1561–1562 CrossRef.
- Q. Liang, X. D. Wu, D. Weng and H. B. Xu, Catal. Today, 2008, 139, 113–118 CrossRef CAS.
- M. Karppinen, P. Kylgikoski, L. Niinist and C. Rodellas, J. Therm. Anal., 1989, 35, 347–353 CrossRef CAS.
- A. Malecki, A. Malecka, R. Gajerski, B. Prochowska-Klisch and A. Podgórecka, J. Therm. Anal., 1988, 34, 203–209 CrossRef CAS.
- K. T. Wojciechowski and A. MaIecki, Thermochim. Acta, 1999, 331, 73–77 CrossRef CAS.
Footnote |
| † Electronic supplementary information (ESI) available. See DOI: 10.1039/c6ra28722k |
| This journal is © The Royal Society of Chemistry 2017 |

