 Open Access Article
Creative Commons Attribution 3.0 Unported Licence
Photoluminescence from amino functionalized graphene quantum dots prepared by electrochemical exfoliation method in the presence of ammonium ions†
Chien-Te Hsieh *,
Dong-Ying Tzou,
Keng-Yen Hsieh and
Ken-Ming Yin
Department of Chemical Engineering and Materials Science, Yuan Ze University, Taoyuan 32003, Taiwan. E-mail: cthsieh@saturn.yzu.edu.tw; Fax: +886-3-4559373; Tel: +886-3-4638800 ext. 2577
First published on 27th March 2017
Abstract
This study elucidates how the nitrogen functionalities affect the UV-visible absorption and photoluminescence (PL) emission of N-modified graphene quantum dots (NGQDs). An electrochemical exfoliation technique incorporated with an in situ amino-functionalization is adopted to synthesize N-modified graphene nanosheets (GNs) with different amidation levels. The applied voltage plays a crucial role in tuning the N/C atomic ratio on the GN product. The maximal N/C atomic ratio reaches 8.4% when exfoliating the GNs at 5 V. The nitrogen functionalities on the GNs include (i) amide/amino functional groups, decorated to the edge sites of GNs, and (ii) pyridinic/pyrrolic/quaternary N, planar to the GNs. The tunable PL emission is strongly affected by the n–π* transitions, forming an interstate transition. The N chemical doping in C![[double bond, length as m-dash]](https://www.rsc.org/images/entities/char_e001.gif) C sp2 domains and amino edge functional groups strongly influences the bonding and anti-bonding of molecular orbits, leading to different electronic transition n-states. Thus, the N dopant and edge N functionalities serve as new radiative sites to tune the PL emission. The surface coverage of sp2 carbon bonding decreased with an increase in the number of N functional groups, inducing a red shift. Therefore, the color-tunable emission from blue to greenish color and the increase of absorption in the visible region can be done by tuning appropriate amidation level on the NGQD specimens.
C sp2 domains and amino edge functional groups strongly influences the bonding and anti-bonding of molecular orbits, leading to different electronic transition n-states. Thus, the N dopant and edge N functionalities serve as new radiative sites to tune the PL emission. The surface coverage of sp2 carbon bonding decreased with an increase in the number of N functional groups, inducing a red shift. Therefore, the color-tunable emission from blue to greenish color and the increase of absorption in the visible region can be done by tuning appropriate amidation level on the NGQD specimens.
Introduction
Graphene is a monolayer of carbon atoms tightly arranged into a two-dimensional honeycomb lattice,1 offering a wide range of applications including transparent conducting films,2 catalyst supports,3 lithium-ion batteries,4 and electrochemical capacitors5 because of its extraordinary mechanical, electronic and optical properties. The other derivative, graphene oxide (GO), is a chemically modified graphene, decorated with oxygen functionalities such as hydroxyl, carbonyl, and carboxyl groups. It is generally recognized that pristine graphene exhibits a high electron mobility of 10−6 cm2 V−1 s−1 and an almost zero band gap,6 whereas the band gap and optical properties of GO sheets strongly depend on their oxidation levels.7 This finding raises great interest in surface modification of graphene which enables tuning of the optical and electronic properties for practical applications. Recently, the chemical doping of GNs with heteroatoms like sulfur, boron and nitrogen has emerged due to its ability to provide fascinating optical and electronic characteristics.8–10 Both dopant type and concentration have been considered as crucial factors to alter the band structure of graphene, i.e., the energy gap between valence and conduction bands.10 Particularly, nitrogen-doping in carbon delivers a very promising potential in a variety of applications such as graphene quantum dots (GQDs).11,12 The presence of N atoms has been confirmed to tailor the charge density on carbon, originated from an incorporation of N atoms with excess electrons, i.e., n-type semiconductor.13 Recently, a number of methods have been developed to prepare N-doped GNs or GO sheets, including NH3 annealing followed by N+-ion irradiation,10 hydrothermal reaction with ammonia,9,11 ammonia-ultrasonic bathing method,12 chemical doping of epitaxial graphene by 4-amino-2,2,6,6-tetramethyl-1-piperidinyloxy,14 and chemical doping of trans- and cis-azobenzene.15 Usually, the N-functionalization (i.e., N-doping or chemical decoration) on GNs are carried out after the preparation of GO sheets. There are few reports focusing on one-step processes, consisted of graphene synthesis and amino-functionalization.This work intends to adopt one-step process, incorporated with N-functionalization and electrochemical exfoliation (N-EE), to synthesize high quality GN products. Basically, the EE method offers great potential in large-scale production due to its high efficiency and better environmental friendliness, as compared to other ones (e.g., Hummers' method and chemical vapor deposition).16–19 Moreover, as the exfoliation of graphite takes place in aqueous electrolyte at ambient temperature, the overall process is economic. In comparison, the N-EE approach could be operated in (NH4)2HPO4, forming N-modified GN products without any further modification. The voltage, ranged from 5 to 12 V, serves as an operating parameter to tune the amidation level and amino group distribution on GN powders. Meanwhile, the exfoliation and N-doping could take place simultaneously, shortening operation period and thus showing great feasibility for commercialization. To explore their photoluminescence (PL) performance, the amino-functionalized GNs could be sieved and classified within the region of 3–5 nm in particle size through a high-performance centrifugal process, thereby giving N-modified GQDs (NGQDs). In fact, pioneering studies have reported one possibility of tailoring the PL emission of GQDs, strongly influenced by their size, morphology and surface functionalization.20–23 However, an understanding regarding the PL emission from NGQDs prepared by one-step N-EE route is still unclear. Accordingly, this work aims to clarify the PL emission from the NGQDs, prepared through the N-EE route. The relationship between the band gap and the PL efficiency of NGQDs is systematically investigated. The present work explores one efficient protocol that employs one-step N-EE method followed by high-performance nano-sieving process to synthesize the NGQDs with different amidation levels, using (NH4)2HPO4 electrolytes under the constant-voltage within potential range of 5–12 V.
Experimental
Fabrication of NGQDs by N-EE method
The N-EE method for producing N-functionalized GNs in a large quantity could be briefly described as follows. First of all, two pieces of highly-oriented pyrolytic graphite (HOPG) plates were carefully cut into a dimension of 10 × 10 × 2 cm3. We adopted one two-electrode configuration system, consisted of 15 liter Teflon tank and in-serial five channels, to fabricate GN products in pilot scale. Thus, the N-EE approach enabled mass-production of GNs from ten pieces of HOPG electrodes simultaneously when operating at high voltage. The distance between each HOPG electrode was set at 3 cm, and the electrolyte were prepared using 10 mol% (NH4)2HPO4. The N-EE process was carried out by applying two-step DC bias on the HOPG electrodes. In the first-step a potential difference of 1 V was maintained for 0.2 h; and in the second step the potential difference is raised to different values (i.e., 5, 7, 9, and 12 V) and then maintained at the same voltages for 0.5 h. After the N-EE process, the GN flakes were collected and dried at 105 °C in one vacuum oven overnight. The collection of N-functionalized GQDs was described as follows. A high-performance centrifuge was used to sieve and screen the GN powders into various particle sizes, using polymeric filters with different nominal pore sizes. The rotation speed and centrifugation period were set at 10![[thin space (1/6-em)]](https://www.rsc.org/images/entities/char_2009.gif) 000 rpm and 0.5 h, respectively.
000 rpm and 0.5 h, respectively.
Characterization of N-modified GNs and NGQDs
HR-TEM (JEOL, JEM-2100) was adopted to inspect the micro-structural GN powders. FTIR (Nicolet Avatar 360 FTIR) spectroscopy was adopted to identify surface functional groups on graphene samples. Herein 32 scans in the spectral ranges were recorded with a resolution of 4 cm−1. We employed X-ray photoelectron spectroscopy (XPS) to characterize the chemical composition of N-modified GN powders. Each XP spectrum was recorded by a Fison VG ESCA210 spectrometer with Mg-Kα radiation. Both the C 1s and N 1s spectra were deconvoluted by using a non-linear least squares fitting program with a symmetric Gaussian function. The surface composition of as-prepared GN samples was calculated with an appropriate sensitivity factor.The particle size distributions of as-prepared NGQD samples were analyzed by AFM (Ardic P100). The ultraviolet-visible (UV-vis) absorbance spectra of GN suspension (weight ratio: 0.05 mg GN/1 mL distilled water) in quartz cell were analyzed and collected using an UV-vis spectrometer (Agilent Technology Cary 60) with a wavelength scan rate of 60 nm min−1. Herein the distilled water served as a blank spectrum. For the PL characterization, the emission and excitation spectra of GN suspensions were recorded by using an optic spectrometer (FLS920P Edinburgh Analytical Instrument), equipped with Xe lamp as an excitation source. We set the wavelength of excitation at 360 nm. Herein all GN powders were dispersed in distilled water to avoid re-absorption and other interferences. The PL measurements were performed at room temperature.
Results and discussion
The as-prepared GN samples were designated to GN-5, GN-7, GN-9, and GN-12, according to the applied voltages: 5, 7, 9, and 12 V, respectively. After the size classification, the GN samples were collected and designated as NGQD-5, NGQD-7, NGQD-9, and NGDQ-12, also based on the applied voltages: 5, 7, 9, and 12 V, respectively. Fig. 1(a)–(d) present high-resolution transmission electron microscope (HR-TEM) micrographs of N-modified GNs, and the insets depict the selected-area diffraction (SAD) patterns for all samples. The atomic force microscope (AFM) images and their size-distribution histograms are presented in Fig. S1 in the ESI.† The layer number, observed from AFM micrographs, ranges from 6 to 10. The HR-TEM images reveal that the as-prepared GNs have a curved morphology with several micrometers in length. Each GN sample is found to have a few stacked graphene layers. There are several rings in the SAD patterns, confirming the existence of polycrystalline structures in each GN sample. The production yield of N-functionalized GN powders could be evaluated by the ratio of gain of GNs to loss of graphite electrode. The average yield for all operating voltages is approximately 80%. As observed from AFM images, all NGQD samples display similar particle size distributions, in the range of 3–5 nm. Fig. 2(a) presents the Fourier transformed infrared (FTIR) spectra of different NGQDs, showing the presence of oxygen and amino functional groups on the NGQD samples. The spectra of NGQDs exhibit characteristic bands around 1410 and 1730 cm−1 for tertiary alcoholic C–OH bending and HO–C![[double bond, length as m-dash]](https://www.rsc.org/images/entities/char_e001.gif) O/C
O/C![[double bond, length as m-dash]](https://www.rsc.org/images/entities/char_e001.gif) O stretching, respectively. The transmittance bands at 1100 cm−1 can be assigned to C–N stretching vibrations.24 It is worth noting that the O–H group at 3300–3500 cm−1 corresponds to physically adsorbed moisture onto carbon surface, while the band appears at 2900–3200 cm−1 for the vibration of N–H groups in sp2 domain plane of GNs.25 The NGQD-5 sample shows an emerging band in the range of 2900–3200 cm−1 as compared to the others, indicating presence of a large amount of amino or amide groups. Accordingly, the N-EE technique operated at low voltage is able to produce GN product with low amidation level. This result is also in accordance with the pioneering study,26 in which the N chemical doping is accompanied by the introduction of oxygen-containing functionalities, e.g., hydroxyl, carbonyl and carboxyl groups.
O stretching, respectively. The transmittance bands at 1100 cm−1 can be assigned to C–N stretching vibrations.24 It is worth noting that the O–H group at 3300–3500 cm−1 corresponds to physically adsorbed moisture onto carbon surface, while the band appears at 2900–3200 cm−1 for the vibration of N–H groups in sp2 domain plane of GNs.25 The NGQD-5 sample shows an emerging band in the range of 2900–3200 cm−1 as compared to the others, indicating presence of a large amount of amino or amide groups. Accordingly, the N-EE technique operated at low voltage is able to produce GN product with low amidation level. This result is also in accordance with the pioneering study,26 in which the N chemical doping is accompanied by the introduction of oxygen-containing functionalities, e.g., hydroxyl, carbonyl and carboxyl groups.
 | ||
| Fig. 1 HR-TEM micrographs of (a) GN-P5, (b) GN-P7, (c) GN-P9, and (d) GN-P12. The inset shows the SAD pattern for each amino-functionalized GN products, prepared by N-EE method. | ||
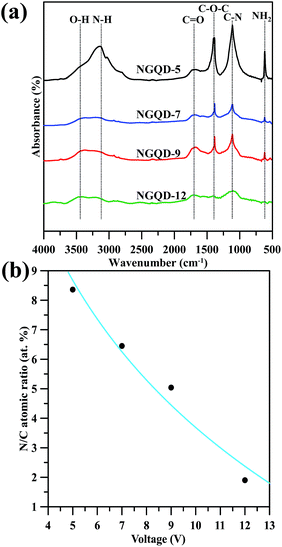 | ||
| Fig. 2 (a) FT-IR transmittance spectra of amino-functionalized GN products prepared at different voltages. (b) The N/C atomic ratio as a function of applied voltage. | ||
The full-range XPS spectra of N-modified GN sample are illustrated in Fig. S2 (see ESI†), showing the C 1s, N 1s, and O 1s peaks at binding energies of approximately 284, 400, and 532 eV, respectively. The quantitative analysis of the XPS spectra reflects that the GN-P5 sample exhibits the high N/C atomic ratio of 8.4% among the GN samples. The N/C atomic ratio as a decreasing function of applied voltage is depicted in Fig. 2(b). This result reveals that the exfoliation of GNs in (NH4)2HPO4 at 5 V sequentially implant nitrogen atoms and attach amino groups to the GNs, while the exfoliation at 12 V is prone to dramatically separate the GNs from the graphite electrodes with little N chemical doping and less implantation of N-containing functional groups. Therefore, it can be said that, this approach provides an efficient pathway to produce N-modified GN product through an electrochemical exfoliation incorporated with in situ amino-functionalization.
The proposed mechanism concerning N-EE approach illustrated in Fig. 3 consists of the following steps: (i) ionic intercalation, (ii) graphite layer expansion, and (iii) bubble expansion. In the step (i), water is initially oxidized to generate hydroxyl (OH˙) and oxygen (O˙) radicals at high potentials (i.e., 5–12 V in this case), leading to the corrosion of edges sites and grain boundaries and opening up some defective sites of expanded graphite.19,27,28 In the step (ii), the oxygenated graphite layers tend to be expanded, allowing ionic intercalation followed by surface oxidation/amidation in the presence of various ions, e.g., OH−, NH4+, H+, and PO43−. The step (iii) enables the anion reduction and water oxidation, inducing the release of O2 and other gases (e.g., CO2).27,28 The bubble expansion thus makes the exfoliation of graphene layers from the HOPG electrodes. Meanwhile, there are a large number of dangling bonds generated on graphene sheets in the presence of NH4+, in which nitrogen dopants would chemically interact with the defect sites and amino groups tend to terminate the dangling bond on the edges sites of graphene layer. Thus, the N-EE method leads to an in situ amino-functionalization route during the electrochemical exfoliation process. When operating at 12 V, the chemical kinetics of water electrolysis becomes faster, thus leading high exfoliation rate, i.e., high production rate of GNs. Herein, the in situ amino-functionalization cannot take place completely due to its higher energy barrier of forming amino group and N chemical doping, compared to the exfoliation rate of GNs. At present, the rate of generation of oxygen functionalities, mainly originated from the free radicals (i.e., hydroxyl and oxygen radicals), is much higher than that of amino and amine groups on N-modified GNs. Thus, the N-modified GNs show higher amidation level when exfoliating at low voltage (e.g., 5 V). The related chemical reaction steps regarding the formation mechanism have been formulated and expressed in Fig. 3.
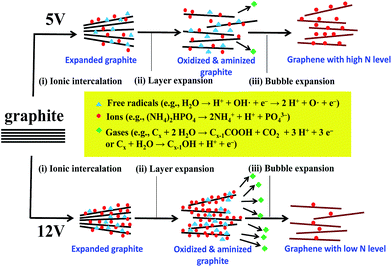 | ||
| Fig. 3 Schematic illustration for the electrochemical exfoliation incorporated with amino-functionalization method of producing graphene nanosheets with different amidation levels. | ||
Fig. 4 presents the focused C 1s spectra of N-modified GN samples, composed of several peaks obtained by deconvolution: C–C (284.6 eV), C–N (285.8 eV), C–OH (286.5 eV), C![[double bond, length as m-dash]](https://www.rsc.org/images/entities/char_e001.gif) O (288.0 eV), and O–C
O (288.0 eV), and O–C![[double bond, length as m-dash]](https://www.rsc.org/images/entities/char_e001.gif) O (289.1 eV).9,24 The later three oxygen functionalities, phenolic, carbonyl, and carboxylic group, are frequently attached to basal and edge sites of graphene layer. It should be noted that the emergence of π–π* satellite peak (∼298 eV) of sp2 carbon domain in all N-modified GN samples confirms the resonance in the aromatic orbitals of GNs. It can be seen that the GN-P5 sample offers the largest C–N intensity, showing the highest amidation level as compared to the other three samples. This reflects that the in situ amino-functionalization increases the contribution of C–N bond at the expense of that of oxygen functionality, e.g., carbonyl and carboxylic groups. The conversion of the nitrogen functionality caused by the in situ amino functionalization route can also be elucidated by the analysis of N 1s spectra.
O (289.1 eV).9,24 The later three oxygen functionalities, phenolic, carbonyl, and carboxylic group, are frequently attached to basal and edge sites of graphene layer. It should be noted that the emergence of π–π* satellite peak (∼298 eV) of sp2 carbon domain in all N-modified GN samples confirms the resonance in the aromatic orbitals of GNs. It can be seen that the GN-P5 sample offers the largest C–N intensity, showing the highest amidation level as compared to the other three samples. This reflects that the in situ amino-functionalization increases the contribution of C–N bond at the expense of that of oxygen functionality, e.g., carbonyl and carboxylic groups. The conversion of the nitrogen functionality caused by the in situ amino functionalization route can also be elucidated by the analysis of N 1s spectra.
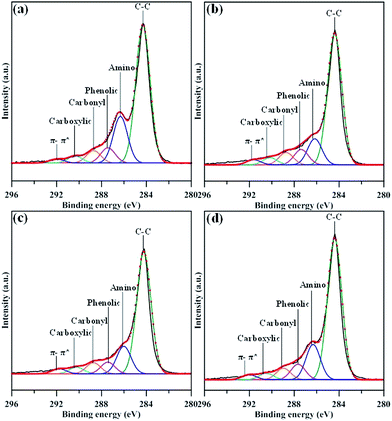 | ||
| Fig. 4 XPS C 1s peaks of amino-functionalized GN products: (a) GN-P5, (b) GN-P7, (c) GN-P9, and (d) GN-P12. | ||
Fig. 5 depicts the N 1s spectra of N-modified GN samples, comprising five main peaks assigned to pyridinic (∼398.4 eV), amino (–NH2, 399.2 eV), pyrrolic (∼399.6 eV), quaternary (∼400.7 eV), and amide (O![[double bond, length as m-dash]](https://www.rsc.org/images/entities/char_e001.gif) C–N, 401.2 eV) functional groups.29,30 The composition of nitrogen functionalities for all N-modified GN samples, determined from the deconvolution of N 1s peak using a multiple Gaussian function. The presence of pyridinic, pyrrolic, quaternary functionalities on GNs reveals that N atoms are doped through replacing C atoms of graphene24 through the N-EE route. The quaternary N atoms doped in aromatic graphene lattice could repair the vacancy defects in graphene sheets.31,32 It can be observed from Fig. 5 that the percentage of amide group delivers an increasing trend after exfoliating at 7–12 V. We believe that the amide functionalities were generated in large amounts at the expense of loss of pyridinic and pyrrolic nitrogen or the replacement of carboxylic groups. The formation of amide may be associated with the cleavage of C–N bonds in pyridinic and pyrrolic groups24 or the strong interaction between ammonia and oxygen functionalities during the exfoliation incorporated with in situ N-functionalization process.
C–N, 401.2 eV) functional groups.29,30 The composition of nitrogen functionalities for all N-modified GN samples, determined from the deconvolution of N 1s peak using a multiple Gaussian function. The presence of pyridinic, pyrrolic, quaternary functionalities on GNs reveals that N atoms are doped through replacing C atoms of graphene24 through the N-EE route. The quaternary N atoms doped in aromatic graphene lattice could repair the vacancy defects in graphene sheets.31,32 It can be observed from Fig. 5 that the percentage of amide group delivers an increasing trend after exfoliating at 7–12 V. We believe that the amide functionalities were generated in large amounts at the expense of loss of pyridinic and pyrrolic nitrogen or the replacement of carboxylic groups. The formation of amide may be associated with the cleavage of C–N bonds in pyridinic and pyrrolic groups24 or the strong interaction between ammonia and oxygen functionalities during the exfoliation incorporated with in situ N-functionalization process.
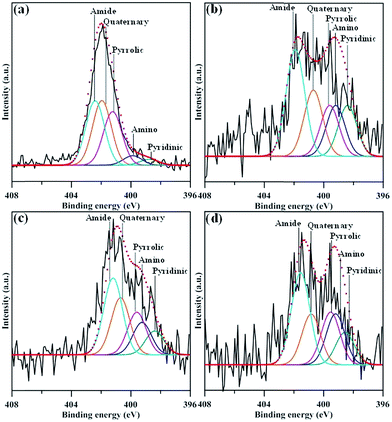 | ||
| Fig. 5 XPS N 1s peaks of amino-functionalized GN products: (a) GN-P5, (b) GN-P7, (c) GN-P9, and (d) GN-P12. | ||
Fig. 6 shows ultraviolet (UV)-visible spectra of NGQD samples in distilled water, in which the maximal absorbance can be attributed to π–π* transition in sp2 domains, whereas the absorption edge mainly originates from n–π* transitions of nonbonding electrons of adatoms,33–35 e.g., nitrogen functionalities. Apparently, there is an obvious shift of adsorption band edge to long wavelengths with an increase in the N/C atomic ratio of NGQDs. This shift is ascribed to the surface defect sites on NGQDs (i.e., nitrogen functionalities), thus, providing intermediate states (i.e., n-states) within the π–π* energy gap. Accordingly, the presence of nitrogen functionalities causes the red shift in UV light absorption, i.e., n–π* transitions. The PL excitation spectra of NGQDs a also illustrated in Fig. 6. The feature of PL excitation spectra can be divided into three adsorptive transition regions: (i) n–π*, (ii) π–π* and (iii) n–σ transitions.33 The maximal peak of the PL excitation for all NGQDs falls into the range of 405–415 nm. The NGQD-5 displays the highest intensity of PL excitation as compared to the other three samples, indicating the importance of N/C atomic ratio and nitrogen group distribution. Because of all NGQDs with a narrow particle size distribution (see Fig. S1†), the PL excitation shift can be inferred from the number and location of carbon vacancy defects. When forming the carbon vacancies at the edges of NGQD with lower formation energy, the NGQDs would permit an efficient elastic relaxation of atoms for stress release (i.e., weak confinement). If these defects exist in the interior of NGQDs, the excitons require an extra energy to escape from the inner perfect crystal structure, leading to a larger lattice relaxation (i.e., strong confinement).6 Since the NQGD-5 sample possesses a large amount of nitrogen edge sites (i.e., amino/amide groups), the PL excitation tends to be a weak confinement behavior due to the transition of bound excitons localized inside the edge of N-modified GQDs. Thus, the weak confinement of excitons in the NGQDs imparts the high-energy PL emission. In contrast, the nitrogen functionalities, e.g., pyridinic-N, pyrrolic-N, quaternary-N, is prone to tightly confine the excitons inside the interior of NQGDs, leading to a lower PL response.
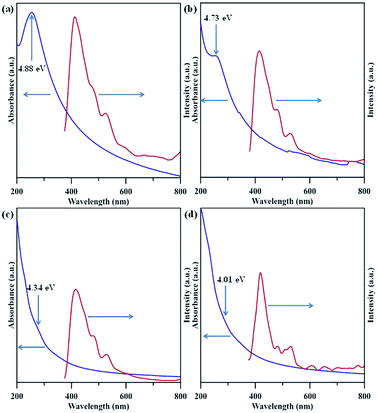 | ||
| Fig. 6 UV-visible and PLE spectra of amino-functionalized GQDs: (a) NGQD-5, (b) NGQD-7, (c) NGQD-9, and (d) NGDQ-12. | ||
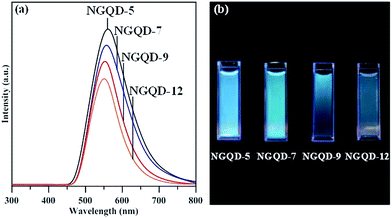
Fig. 7(a) shows PL spectra of NGQD specimens excited at a wavelength of 340 nm. The NGQDs display single PL response at 562 nm (NGQD-5), 557 nm (NGQD-7), 553 nm (NGQD-9), and 551 nm (NGQD-12). The red shift in the PL spectra with an increase in N/C atomic ratio can be viewed, encompassing the blue to green-blue of visible spectrum, as shown in Fig. 7(b). It is worthwhile to note that the NGQD-5 specimen is capable of offering the highest intensity of PL emission among the specimens. This is presumably due to one possible reason that the design of NGQD specimen displays the weak quantum confinement with increasing amino-functionalization extent. Concerning the shape of PL response, two types of bound excitons may exist in the NGQDs: (i) one is the bound excitons into NGQDs, contributing the low-energy transition, and (ii) the other is the bound excitons in edge sites of NGQDs, exhibiting the high-energy transition. This argument can be supported by the full width at half maximum (FWHM) of each PL peak. The FWHM for all PL responses shows an order as 118 nm (NGQD-5) > 112 nm (NGQD-7) > 96 nm (NGQD-9) > 91 nm (NGQD-12). Since the NQGD-5 specimen owns two different bound excitons, the NGQD-5 sample displays the wide PL emission from visible to near-infrared wavelength. Accordingly, this is an essence why the NGQDs with high amidation level offer high-intensity fluorescence and broadened PL response.
Fig. 8(a) gives a schematic of energy levels associated with absorption and PL emission of NGQDs. Obviously, the tunable PL emission is strongly affected by the n–π* transitions, forming an interstate transition. This is because the N chemical doping in C![[double bond, length as m-dash]](https://www.rsc.org/images/entities/char_e001.gif) C sp2 domains and amino edge functional groups influence the bonding and anti-bonding of molecular orbits, imparting different electronic transition n-states.12 The electron transition from π* orbital to n-state orbital consists of radiative recombination and phonon scattering. It is believed that the N dopant and edge N functionalities could act as new radiative sites to tune the PL emission.36,37 As for the NGQDs with low amidation level, the blue light emission to the intrinsic states associated with isolated sp2 nanodomains appears, whereas the greenish light illuminates from the NGQDs with high amidation extent due to the extrinsic states formed by different N functionalities. With increasing the amount of nitrogen functional groups, the surface coverage of sp2 carbon bonding decreases, thus leading to the red shift.
C sp2 domains and amino edge functional groups influence the bonding and anti-bonding of molecular orbits, imparting different electronic transition n-states.12 The electron transition from π* orbital to n-state orbital consists of radiative recombination and phonon scattering. It is believed that the N dopant and edge N functionalities could act as new radiative sites to tune the PL emission.36,37 As for the NGQDs with low amidation level, the blue light emission to the intrinsic states associated with isolated sp2 nanodomains appears, whereas the greenish light illuminates from the NGQDs with high amidation extent due to the extrinsic states formed by different N functionalities. With increasing the amount of nitrogen functional groups, the surface coverage of sp2 carbon bonding decreases, thus leading to the red shift.
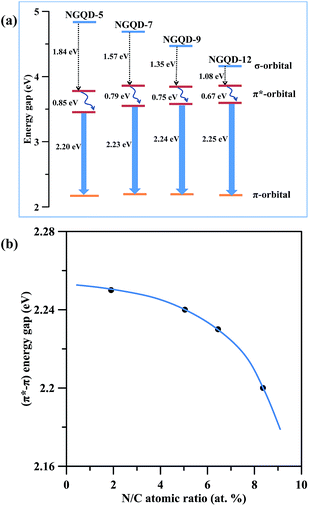 | ||
| Fig. 8 (a) Band gap structure of different N-modified GQDs. (b) The (π*–π) energy gap in PL spectra as a function of N/C atomic ratio. | ||
Therefore, the higher the amidation level, the suppressed the π*–π transition becomes, as illustrated in Fig. 8(b). In contrast, the π*–π transition becomes broader at low amidation level on NGQDs, showing a blue shift. The above achievement of the present work delivers a great potential that both the tunable PL emission and the increase of absorption in visible region are workable if tuning to an appropriate amidation level on the GQD specimens. Accordingly, this study provides a straightforward route to versatile applications in biosensors, optoelectronics, photodetection, photovoltaics, light-emitting diodes and plasmonics.
Conclusions
This study elucidated how the nitrogen functionalities affect the UV-visible absorption and PL emission of N-modified GQDs. An efficient exfoliation technique incorporated with an in situ amino-functionalization was adopted to synthesize N-modified GNs with different amidation levels. The applied voltage served as a crucial factor in tuning the N/C atomic ratio on the GN product. The N/C atomic ratio of as-prepared GNs was a decreasing function of applied voltage, and the maximal N/C atomic ratio reached to 8.4% when exfoliating the GN sample at 5 V.Analyzed by XPS, the nitrogen functionalities on the GNs include (i) amide/amino functional groups, decorated at the edge sites of GNs, and (ii) pyridinic/pyrrolic/quaternary N, planar to the GNs. An obvious shift of UV adsorption band edge to long wavelengths was observed when increasing the N/C atomic ratio of NGQDs. This shift was attributed to the surface defect sites on NGQDs (i.e., nitrogen functionalities), thus, providing intermediate states (i.e., n-states) within the π–π* energy gap. Accordingly, the presence of nitrogen functionalities resulted in the red shift in UV light absorption, i.e., n–π* transitions. Due to a large amount of nitrogen edge sites (i.e., amino/amide groups), the PL excitation tends to be a weak confinement behavior due to the transition of bound excitons localized inside the edge of N-modified GQDs. Thus, the weak confinement of excitons in the NGQDs facilitated the high-energy PL emission. In comparison, the nitrogen functionalities including pyridinic-N, pyrrolic-N, quaternary-N, tended to tightly confine the excitons in the interior of NQGDs, imparting a lower PL response. The wide PL emission from visible to near-infrared wavelength could be ascribed to two different bound excitons. A schematic of energy levels associated with absorption and PL emission of NGQDs was proposed. The tunable PL emission is strongly affected by the n–π* transitions, forming an interstate transition. This is because the N chemical doping in C![[double bond, length as m-dash]](https://www.rsc.org/images/entities/char_e001.gif) C sp2 domains and amino edge functional groups influence the bonding and anti-bonding of molecular orbits, imparting different electronic transition n-states. In our opinion the N dopant and edge N functionalities act as new radiative sites to tune the PL emission. As for the NGQDs with low amidation level, the blue light emission to the intrinsic states associated with isolated sp2 nanodomains appeared, whereas the greenish light illuminated from the NGQDs with high amidation extent due to the extrinsic states formed by different N functionalities. The surface coverage of sp2 carbon bonding decreased with an increase in the amount of nitrogen functional groups, thus leading to the red shift. Accordingly, the higher the amidation level, the suppressed the π*–π transition became. On the basis of the above deduction, this work offered one feasibility that the color-tunable emission from blue to greenish color and the increase of absorption in visible region were feasible if tuning to an appropriate amidation level on the GQD specimens.
C sp2 domains and amino edge functional groups influence the bonding and anti-bonding of molecular orbits, imparting different electronic transition n-states. In our opinion the N dopant and edge N functionalities act as new radiative sites to tune the PL emission. As for the NGQDs with low amidation level, the blue light emission to the intrinsic states associated with isolated sp2 nanodomains appeared, whereas the greenish light illuminated from the NGQDs with high amidation extent due to the extrinsic states formed by different N functionalities. The surface coverage of sp2 carbon bonding decreased with an increase in the amount of nitrogen functional groups, thus leading to the red shift. Accordingly, the higher the amidation level, the suppressed the π*–π transition became. On the basis of the above deduction, this work offered one feasibility that the color-tunable emission from blue to greenish color and the increase of absorption in visible region were feasible if tuning to an appropriate amidation level on the GQD specimens.
Acknowledgements
The authors are very grateful for the support from the Ministry of Science and Technology (Taiwan, R.O.C.) under the contracts MOST 105-2628-E-155-002-MY3, MOST 105-2221-E-155-014-MY3, MOST 105-2622-E-155-011-CC2, and MOST 105-2218-E-155-007.References
- Y. N. Guo, X. Lu, J. Weng and Y. Leng, J. Phys. Chem. C, 2013, 117, 5708–5717 CAS.
- S. Biswas and L. T. Drzal, Nano Lett., 2009, 9, 167–172 CrossRef CAS PubMed.
- C. T. Hsieh, J. L. Gu, Y. C. Chen and D. Y. Tzou, Electrochim. Acta, 2013, 98, 39–47 CrossRef CAS.
- S. M. Paek and E. Yoo, Nano Lett., 2009, 9, 72–75 CrossRef CAS PubMed.
- C. T. Hsieh, W. Y. Lee, C. E. Lee and H. Teng, J. Phys. Chem. C, 2014, 118, 15146–15153 CAS.
- P. Huang, J. J. Shi, M. Zhang, X. H. Zhong, Y. M. Ding, X. Cao, M. Wu and J. Lu, J. Phys. Chem. Lett., 2016, 7, 2888–2892 CrossRef CAS PubMed.
- M. H. Jang, H. D. Ha, E. S. Lee, F. Liu, Y. H. Kim, T. S. Seo and Y. H. Cho, Small, 2015, 11, 3773–3781 CrossRef CAS PubMed.
- L. H. Poh, P. Simek, Z. Sofer and M. Pumera, ACS Nano, 2013, 7, 5262–5272 CrossRef PubMed.
- S. A. Hasan, E. K. Tsekoura, V. Sternhagen and M. Stromme, J. Phys. Chem. C, 2012, 116, 6530–6536 CAS.
- B. Guo, Q. Liu, E. Chen, H. Zhu, L. Fang and J. R. Gong, Nano Lett., 2010, 10, 4975–4980 CrossRef CAS PubMed.
- H. Tetsuka, R. Asahi, A. Nagoya, K. Okamoto, I. Tajima, R. Ohta and A. Okamoto, Adv. Mater., 2012, 24, 5333–5338 CrossRef CAS PubMed.
- G. S. Kumar, R. Roy, D. Sen, U. K. Ghorai, R. Thapa, N. Mazumder, S. Saha and K. K. Chattopadhyay, Nanoscale, 2014, 6, 3384–3391 RSC.
- J. Ortiz-Medina, F. Lopez-Urias, H. Terrones, F. J. Rodriguez-Macias, M. Endo and M. Terrones, J. Phys. Chem. C, 2015, 119, 13972–13978 CAS.
- J. Choi, H. Lee, K. Kim, B. Kim and S. Kim, J. Phys. Chem. Lett., 2010, 1, 505–509 CrossRef CAS.
- N. Peimyoo, J. Li, J. Shang, X. Shen, C. Qiu, L. Xie, W. Huang and T. Yu, ACS Nano, 2012, 6, 8878–8886 CrossRef CAS PubMed.
- J. Liu, H. Yang, S. G. Zhen, C. K. Poh, A. Chaurasia, J. Luo, X. Wu, E. K. L. Yeow, N. G. Sahoo, J. Lin and Z. Shen, RSC Adv., 2013, 3, 11745–11750 RSC.
- P. K. M. K. S. Shanthini and C. Srivastava, RSC Adv., 2015, 5, 53865–53869 RSC.
- X. Huang, S. Li, Z. Qi, Z. Wei, Y. Wei and Y. Fang, Nanotechnolgy, 2015, 26, 105602 CrossRef PubMed.
- C. T. Hsieh and J. H. Huseh, RSC Adv., 2016, 6, 64826–64831 RSC.
- S. H. Jin, D. H. Kim, G. H. jun, S. H. Hong and S. Jeon, ACS Nano, 2013, 7, 1239–1245 CrossRef CAS PubMed.
- M. Xie, Y. Su, X. Lu, Y. Zhang, Z. Yang and Y. Zhang, Mater. Lett., 2013, 93, 161–164 CrossRef CAS.
- Y. Dong, J. Shao, C. Chen, H. Li, R. Wang, Y. Chi, X. Lin and G. Chen, Carbon, 2012, 50, 4738–4743 CrossRef CAS.
- S. Kim, S. W. Hwang, M. K. Kim, D. Y. Shin, D. H. Shin, C. O. Kim, S. B. Yang, J. H. Park, E. Hwang, S. H. Choi, G. Ko, S. Sim, C. Sone, H. J. Choi, S. Bae and B. H. Hong, ACS Nano, 2012, 6, 8203–8208 CrossRef CAS PubMed.
- L. C. Chen, C. Y. Teng, C. Y. Lin, H. Y. Chang, S. J. Chen and H. Teng, Adv. Energy Mater., 2016, 6, 1600719 CrossRef.
- J. Lu, J. X. Yang, J. Wang, A. Lim, S. Wang and K. P. Loh, ACS Nano, 2009, 3, 2367–2375 CrossRef CAS PubMed.
- S. Sarkar, M. Sudolska, M. Dubecky, C. J. Reckmeier, A. L. Rogach and R. Zboril, J. Phys. Chem. C, 2016, 120, 1303–1308 CAS.
- S. Ravula, S. N. Baker, G. Kamath and G. A. Baker, Nanoscale, 2015, 7, 4338–4353 RSC.
- K. Parvez, Z. S. Wu, R. Li, X. Liu, R. Graf, X. Feng and K. Müllen, J. Am. Chem. Soc., 2014, 136, 6083–6091 CrossRef CAS PubMed.
- T. F. Yeh, C. Y. Teng, S. J. Chen and H. Teng, Adv. Mater., 2014, 26, 3297–3303 CrossRef CAS PubMed.
- H. Wang, T. Maiyalagan and X. Wang, ACS Catal., 2012, 2, 781–794 CrossRef CAS.
- T. F. Yeh, S. J. Chen and H. Teng, Nano Energy, 2015, 12, 476–485 CrossRef CAS.
- B. Guo, Q. Liu, E. Chen, H. Zhu, L. Fang and J. R. Gong, Nano Lett., 2010, 10, 4975–4980 CrossRef CAS PubMed.
- T. F. Yeh, W. L. Huang, C. J. Chung, I. T. Chiang, L. C. Chen, H. Y. Chang, W. C. Su, C. Cheng, S. J. Chen and H. Teng, J. Phys. Chem. Lett., 2016, 7, 2087–2092 CrossRef CAS PubMed.
- G. Eda, Y. Y. Lin, C. Mattevi, H. Yamaguchi, H. A. Chen, I. S. Chen, C. W. Chen and M. Chhowalla, Adv. Mater., 2010, 22, 505–509 CrossRef CAS PubMed.
- F. liu, M. H. Jang, H. D. Ha, J. H. Kim, Y. H. Cho and T. S. Seo, Adv. Mater., 2013, 25, 3657–3662 CrossRef CAS PubMed.
- S. Zhu, J. Zhang, S. Tang, S. Qiao, L. Wang, H. Wang, X. Liu, B. Li, Y. Li, W. Yu, X. Wang, H. Sun and B. Yang, Adv. Funct. Mater., 2012, 22, 4732–4740 CrossRef CAS.
- J. Shen, Y. Zhu, C. Chen, X. Yang and C. Li, Chem. Commun., 2011, 47, 2580–2582 RSC.
Footnote |
| † Electronic supplementary information (ESI) available. See DOI: 10.1039/c6ra28742e |
| This journal is © The Royal Society of Chemistry 2017 |

