 Open Access Article
Reversibility of imido-based ionic liquids: a theoretical and experimental study†
Bobo Caoa,
Jiuyao Dua,
Ziping Caoa,
Haitao Sun *a,
Xuejun Sun*a and
Hui Fu*b
aChemistry and Chemical Engineering College, Qufu Normal University, Qufu 273165, Shandong, P. R. China. E-mail: sunhaitao1960@126.com; sxjsunxuejun@163.com; caozp_qfnu@163.com; qufucaobobo@163.com; jwyhbxr@163.com
bState Key Laboratory of Heavy Oil Processing, College of Science, China University of Petroleum, Qingdao 266580, Shandong, P. R. China. E-mail: fuhui@upc.edu.cn
First published on 13th February 2017
Abstract
Multiple techniques were used to study the reversibility of a series of imido-based ionic liquids (ILs). DFT (density functional theory) modeling originally indicated that methyl transfer favorably took place at the unsaturated C![[double bond, length as m-dash]](https://www.rsc.org/images/entities/char_e001.gif) X bond in the N–C
X bond in the N–C![[double bond, length as m-dash]](https://www.rsc.org/images/entities/char_e001.gif) X (N, O and S) fragment. A series of imido-based ILs derived from the N–C
X (N, O and S) fragment. A series of imido-based ILs derived from the N–C![[double bond, length as m-dash]](https://www.rsc.org/images/entities/char_e001.gif) X (N, O and S) fragment were studied and characterized using theoretical and experimental methods. Seven imido-based ILs were facilely synthesized in the experiment, which is consistent with the lower energy barriers obtained in the potential energy surface (PES) compared to the other ILs. Their structures were measured in nuclear magnetic resonance (NMR) spectra. The thermal stabilities were further studied by thermogravimetric analysis (TGA). The bond order results indicated that non-covalent interactions were the major driving force in the methyl transfer process. Non-covalent interactions in these ILs were investigated and characterized using atoms in molecules (AIM), reduced density gradient (RDG) and natural bond orbital (NBO) methods.
X (N, O and S) fragment were studied and characterized using theoretical and experimental methods. Seven imido-based ILs were facilely synthesized in the experiment, which is consistent with the lower energy barriers obtained in the potential energy surface (PES) compared to the other ILs. Their structures were measured in nuclear magnetic resonance (NMR) spectra. The thermal stabilities were further studied by thermogravimetric analysis (TGA). The bond order results indicated that non-covalent interactions were the major driving force in the methyl transfer process. Non-covalent interactions in these ILs were investigated and characterized using atoms in molecules (AIM), reduced density gradient (RDG) and natural bond orbital (NBO) methods.
1. Introduction
In the last few decades, ionic liquids (ILs), known as salts in liquid form at (or near) room-temperature, have been receiving significant interest, with applications as engineering fluids1–6 and electrolytes7–9 and for gas absorption10–14 and biomass dissolution,15–17 mainly because of their appealing properties such as low-melting points and flexibilities in structure and function design.18–20 Their properties can be tailored by incorporating anion and cation species and functional groups to serve certain purposes.21–23 The extremely low vapor pressure means they are not volatile under mild conditions, and thus, the loss of solvents into the atmosphere and the risk of exposure can be avoided. However, a recycling scheme, as an associated challenge, severely limits the large-scale industrial applications and further efficient purifications of ILs, which cannot be easily recycled under mild conditions such as distillation and liquid–liquid separator.24,25 Considering this doubtlessly important feature, studies on the distillation of ILs are very valuable for expanding their applications and opening the way to innovative extraction and purification processes, which may lead to their recognition as green solvents.The distillation tests of ILs can be traced back to an article on the distillation and volatility of a wealth of commonly used aprotic ILs at low pressure without decomposition that was reported by Earle and co-workers.26 Earle et al. forcefully contradicted the widely held belief that ILs were nonvolatile. Unfortunately, the harsh conditions and poor efficiency mean it hardly meets the requirements of industry. Since then, efforts have been devoted to the investigation of the volatility and distillability of ILs.27–30 Jones et al.31 achieved higher distillation rates of [Cnmim][Tf2N] than those obtained by Earle et al.26 under high vacuum conditions. Furthermore, serious efforts were devoted to investigate the distillation of protic ILs, in which the neutral acids and bases were obtained in the distillation process via a proton-transfer mechanism.24,26,32–35 Efforts are still eagerly undertaken to systematically study novel distillable ILs to satisfy many requirements of the decarbonised global economy.
The reversibility and distillation of X-methylated (X = N, O, and S) triflates [TfO]− ILs are studied using experimental and computational methods. Electrostatic potential (ESP) was performed to locate the more favorable position for the methyl transfer reaction of sixteen ILs. Potential energy surface (PES) obtained through energy calculation is helpful in locating the reasonable reaction paths. Among these ILs, seven typical ILs were synthesized, and the structures of them were confirmed by nuclear magnetic resonance (NMR) spectra. Short-term stability and long-term stability of these ILs were investigated by temperature-ramped thermogravimetric analysis (TGA) and isothermal TGA experiments, respectively.36 Mayer bond order (MBO) and Laplacian bond order (LBO) were performed to reveal the nature of the chemical bonds based on two different quantum mechanical properties. The atoms in molecules (AIM) theory combined with the reduced density gradient (RDG) method as well as the natural bond orbital (NBO) theory were used to study the properties of the non-covalent interactions. The emphasis was on investigating the thermal stability of the ILs and revealing the thermodynamics and chemical mechanisms of reversibility.
2. Results and discussion
2.1 ILs design based on ESP analysis
Due to ILs' important structure and function design properties, a new class of reversible and distillable ILs were designed based on the N–C![[double bond, length as m-dash]](https://www.rsc.org/images/entities/char_e001.gif) X (N, O and S) fragment. To accomplish this point, the reaction from the neutral molecule to the alkylated cation must be reversible. Before this, we should understand whether the reaction of amide derivatives with alkylating agents occurs at the amide nitrogen atom or the electron-rich nitrogen/oxygen/sulfur atom.
X (N, O and S) fragment. To accomplish this point, the reaction from the neutral molecule to the alkylated cation must be reversible. Before this, we should understand whether the reaction of amide derivatives with alkylating agents occurs at the amide nitrogen atom or the electron-rich nitrogen/oxygen/sulfur atom.
To answer the question above, ESP was applied for the prediction of the nucleophilic and electrophilic sites.37–39 Since it reflects the specific electron structure features of a molecule, including lone pairs, π electrons, etc., ESP was performed on the van der Waal (vdW) surface. Additionally, it was further quantified and decomposed to the local surfaces corresponding to individual atoms to extract more information.
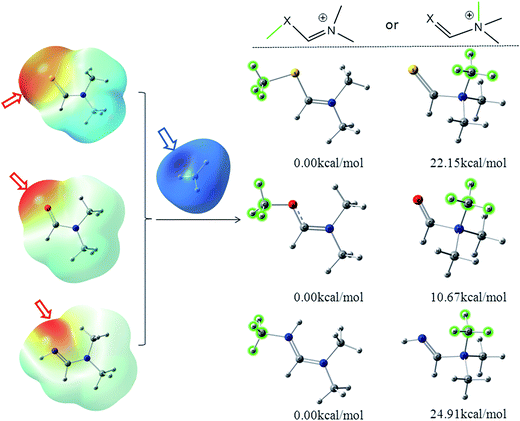
The color-code ESP on the vdW surfaces of N,N-dimethylformamide (DMF)/N,N-dimethylformimidamide (DMFA)/N,N-dimethylmethanethioamide (DMSF), their two possible methylated products and relative energies was calculated at the M06-2X/6-311++G** level and is shown in Fig. 1. The detailed results are listed in Table S1 (ESI†). C![[double bond, length as m-dash]](https://www.rsc.org/images/entities/char_e001.gif) X is an electron-withdrawing group conjugated to the nitrogen atom that tends to make the nitrogen atom less nucleophilic in the N–C
X is an electron-withdrawing group conjugated to the nitrogen atom that tends to make the nitrogen atom less nucleophilic in the N–C![[double bond, length as m-dash]](https://www.rsc.org/images/entities/char_e001.gif) X fragment. Due to the n–π* electron delocalization, the average of the ESP calculated on the surface of the oxygen atom (−33.06 kcal mol−1) was more negative than the nitrogen atom (−1.17 kcal mol−1) in DMF. Additionally, the negative (red) regions and maximal value (−43.69 kcal mol−1) of the whole molecular surface were distributed around the oxygen atom on the color-code ESP surface (Fig. 1), where it is easier to attract the positive methyl carbon (blue regions). The same situations were found in DMSF and DMFA. It suggests that X instead of N in the N–C
X fragment. Due to the n–π* electron delocalization, the average of the ESP calculated on the surface of the oxygen atom (−33.06 kcal mol−1) was more negative than the nitrogen atom (−1.17 kcal mol−1) in DMF. Additionally, the negative (red) regions and maximal value (−43.69 kcal mol−1) of the whole molecular surface were distributed around the oxygen atom on the color-code ESP surface (Fig. 1), where it is easier to attract the positive methyl carbon (blue regions). The same situations were found in DMSF and DMFA. It suggests that X instead of N in the N–C![[double bond, length as m-dash]](https://www.rsc.org/images/entities/char_e001.gif) X fragment is more likely to react with the alkylating agents due to its higher nucleophilicity. It can be clearly seen from Fig. 1 that the X-alkylated products are more stable than their N-alkylated counterparts, with an energy difference of 22.15, 10.67, 24.91 kcal mol−1 for the methylated DMSF, DMF and DMFA cations, respectively. Considering the higher nucleophilicity and more stable methylated products, the X atom in the N–C
X fragment is more likely to react with the alkylating agents due to its higher nucleophilicity. It can be clearly seen from Fig. 1 that the X-alkylated products are more stable than their N-alkylated counterparts, with an energy difference of 22.15, 10.67, 24.91 kcal mol−1 for the methylated DMSF, DMF and DMFA cations, respectively. Considering the higher nucleophilicity and more stable methylated products, the X atom in the N–C![[double bond, length as m-dash]](https://www.rsc.org/images/entities/char_e001.gif) X fragment should be the more favorable position for the methyl transfer reaction.
X fragment should be the more favorable position for the methyl transfer reaction.
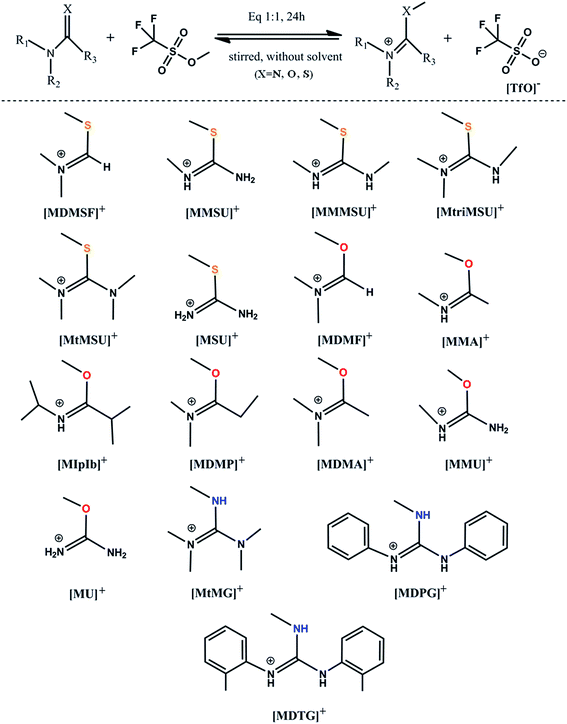
The [TfO]− anion has been used to study reversible and distillable ILs for many years due to its excellent performance in [Bmim][TfO].40,41 The distillation of TfO-based ILs has been systemically studied by both experimental and computational methods.27,28,30,31,42 Based on the analyses above, reversible and distillable ILs containing a series of methylated N–C![[double bond, length as m-dash]](https://www.rsc.org/images/entities/char_e001.gif) X cations and the [TfO]− anion were designed by replacing the branched chain. The synthetic route of these ILs is typically depicted in Fig. 2 (see the Experimental section for details).
X cations and the [TfO]− anion were designed by replacing the branched chain. The synthetic route of these ILs is typically depicted in Fig. 2 (see the Experimental section for details).
2.2 Reaction path and PES analyses
All initial structures were constructed and optimized by fully considering the intra- or intermolecular (interionic) interactions at the M06-2X/6-311++G** level, including van der Waals forces, the coulombic electrostatic force, hydrogen/halogen bonds and the steric effect. The most stable structures of the intermediate (IM), transition state (TS) and IL were obtained. The accuracy of the TS structure was confirmed by vibrational frequency and intrinsic reaction coordinate (IRC) calculation. The total energies along the IRC are depicted in Fig. S1–S3,† respectively. For [MMU][TfO], [MtriMSU][TfO] and [MDTG][TfO], the structures are depicted in Fig. 3, which will be further discussed in the following portion. The other structures of the X-methylated (X = N, O, S) ILs are shown in Fig. S4–S6.† The thorough scans of PES were performed to study the reaction path of the methyl transfer in the studied system. The relative energies (the total energy of the reactant used as a reference point for each system) of the structures are listed in Table 1, and the corresponding PESs are presented in Fig. 4.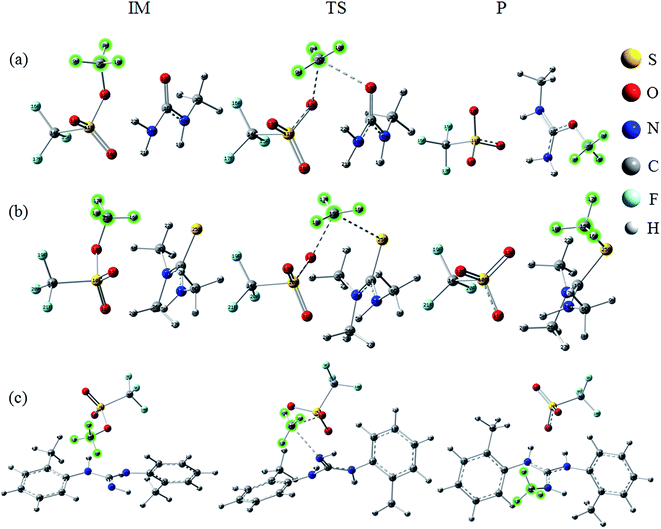 | ||
| Fig. 3 Reaction paths for the methyl transfer in ILs. (a), (b) and (c) [MMU][TfO], [MtriMSU][TfO] and [MDTG][TfO], respectively. The color coding of atoms is depicted on the right side. | ||
| Species | R | IM | TS | IL | ΔEa | ΔEb |
|---|---|---|---|---|---|---|
| [MDMF][TfO] | 0 | −6.02 | 48.57 | −9.79 | 54.59 | 58.36 |
| [MMA][TfO] | 0 | −7.03 | 49.38 | −8.98 | 56.41 | 58.36 |
| [MIpIb][TfO] | 0 | −6.65 | 49.07 | −7.84 | 55.72 | 56.91 |
| [MDMP][TfO] | 0 | −6.59 | 48.50 | −10.99 | 55.09 | 59.49 |
| [MDMA][TfO] | 0 | −7.43 | 47.82 | −11.73 | 55.16 | 59.55 |
| [MMU][TfO] | 0 | −9.29 | 44.05 | −13.49 | 53.34 | 57.54 |
| [MU][TfO] | 0 | −8.41 | 45.56 | −11.79 | 53.97 | 57.35 |
| [MDMSF][TfO] | 0 | −6.97 | 44.61 | −17.70 | 51.58 | 62.31 |
| [MMSU][TfO] | 0 | −10.54 | 39.72 | −21.40 | 50.26 | 61.12 |
| [MMMSU][TfO] | 0 | −11.48 | 38.72 | −24.28 | 50.20 | 63.00 |
| [MtriMSU][TfO] | 0 | −10.04 | 37.84 | −26.42 | 47.88 | 64.26 |
| [MtMSU][TfO] | 0 | −8.66 | 39.59 | −25.67 | 48.25 | 65.26 |
| [MSU][TfO] | 0 | −7.91 | 43.67 | −18.89 | 51.58 | 62.56 |
| [MtMG][TfO] | 0 | −6.02 | 42.25 | −41.21 | 51.27 | 83.46 |
| [MDPG][TfO] | 0 | −7.15 | 44.62 | −30.81 | 51.77 | 75.43 |
| [MDTG][TfO] | 0 | −10.79 | 38.72 | −44.55 | 49.51 | 83.27 |
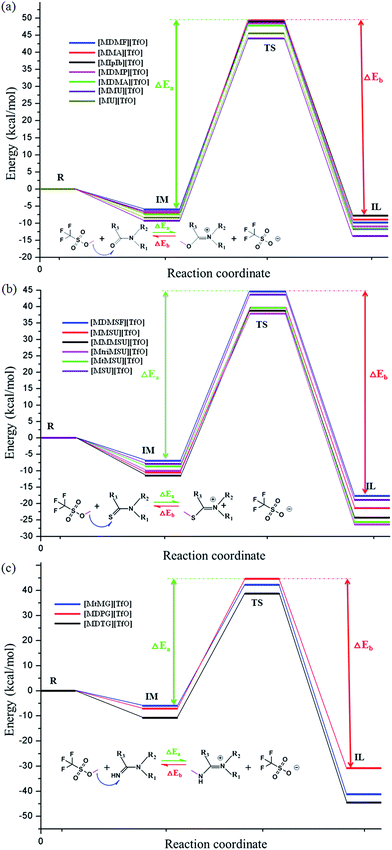 | ||
| Fig. 4 PES of sixteen ILs calculated at M06-2X/6-311++G** level. ΔEa and ΔEb are energy barriers for synthesis and decomposition of ILs, respectively. | ||
As shown in Fig. 3a, the methyl of the methyl triflates transfers to the unsaturated C![[double bond, length as m-dash]](https://www.rsc.org/images/entities/char_e001.gif) O bond by forming a TS where the methyl carbon atom lies almost midway between the two O atoms. Additionally, the IM corresponding to the TS structure also refers to the reaction path. The bond distance of CF3SO3⋯CH3 extends from 1.47 Å in the IM to 2.21 Å in the TS; simultaneously, the C
O bond by forming a TS where the methyl carbon atom lies almost midway between the two O atoms. Additionally, the IM corresponding to the TS structure also refers to the reaction path. The bond distance of CF3SO3⋯CH3 extends from 1.47 Å in the IM to 2.21 Å in the TS; simultaneously, the C![[double bond, length as m-dash]](https://www.rsc.org/images/entities/char_e001.gif) O⋯CH3 bond begins to form with a distance of 2.28 Å. Finally, the neutral molecules transform to ILs, in which molecular-type hydrogen bonds transform to ionic-type hydrogen bonds. The fragments obtain (lose) methyls to become cations (anions). For the decomposition process, the path can be traced back from the ILs to the neutral molecules, and more energy will be consumed to overcome the energy barrier.
O⋯CH3 bond begins to form with a distance of 2.28 Å. Finally, the neutral molecules transform to ILs, in which molecular-type hydrogen bonds transform to ionic-type hydrogen bonds. The fragments obtain (lose) methyls to become cations (anions). For the decomposition process, the path can be traced back from the ILs to the neutral molecules, and more energy will be consumed to overcome the energy barrier.
Fig. 4 shows that the energy barriers within each family are similar; however, the situation is discriminatory between the three families. All the energy barriers of decomposition (ΔEb) are obviously larger than those of the synthesis (ΔEa). As shown in Table 1, the ΔEa of ILs are in the order of [MMU][TfO] (53.34) < [MU][TfO] (53.97) < [MDMF][TfO] (54.59) < [MDMP][TfO] (55.09) < [MDMA][TfO] (55.16) < [MMA][TfO] (56.41) < [MIpIb][TfO] (55.72), and the ΔEb are in the order of [MIpIb][TfO] (56.91) < [MU][TfO] (57.35) < [MMU][TfO] (57.54) < [MDMF][TfO] (58.36) = [MMA][TfO] (58.36) < [MDMP][TfO] (59.49) < [MDMA][TfO] (59.55 kcal mol−1). The ΔEa and ΔEb of [MMU][TfO] and [MU][TfO] are about 54 and 57 kcal mol−1, respectively. It may indicate that their synthesis/decomposition processes can take place under mild conditions, which has been further demonstrated in our laboratory. Similar discussions and analyses can be extended to other ILs and similar conclusions can be obtained. Besides, Table 1 shows that the synthesis/decomposition processes of ILs are endothermal/exothermal reactions.
[MtriMSU][TfO] and [MtMSU][TfO] in the N–C![[double bond, length as m-dash]](https://www.rsc.org/images/entities/char_e001.gif) S family are easier to prepare due to their ΔEa of around 48 kcal mol−1 [MMU][TfO] and [MU][TfO] in the N–C
S family are easier to prepare due to their ΔEa of around 48 kcal mol−1 [MMU][TfO] and [MU][TfO] in the N–C![[double bond, length as m-dash]](https://www.rsc.org/images/entities/char_e001.gif) O family are easier to decompose because of their ΔEb of about 57 kcal mol−1 [MtMG][TfO], [MDPG][TfO] and [MDTG][TfO] in the N–C
O family are easier to decompose because of their ΔEb of about 57 kcal mol−1 [MtMG][TfO], [MDPG][TfO] and [MDTG][TfO] in the N–C![[double bond, length as m-dash]](https://www.rsc.org/images/entities/char_e001.gif) N family are also easy to prepare since their ΔEa are around 50 kcal mol−1. However, their larger ΔEbs (up to 75 kcal mol−1) makes them difficult to decompose. The seven kinds of ILs were chosen to further study their short-term and long-term thermal stabilities by using temperature-ramped TGA and isothermal TGA experiments, respectively.
N family are also easy to prepare since their ΔEa are around 50 kcal mol−1. However, their larger ΔEbs (up to 75 kcal mol−1) makes them difficult to decompose. The seven kinds of ILs were chosen to further study their short-term and long-term thermal stabilities by using temperature-ramped TGA and isothermal TGA experiments, respectively.
2.3 Thermal stability analysis
The thermal stability analysis of distillable ILs in the present work can be broadly divided into two categories. Temperature-ramped TGA measures the curve of the weight% versus the sample temperature with a constant heating rate of 10 °C min−1 within the range of 30–600 °C. The TG curves of [MMU][TfO], [MU][TfO], [MtriMSU][TfO], [MtMSU][TfO] are depicted in Fig. 5a. The TG curves of [MtMG][TfO], [MDPG][TfO] and [MDTG][TfO] are shown in Fig. S7.† Besides, the TG-differential thermogravimetry (TG-DTG) curves of [MMU][TfO], [MU][TfO], [MtriMSU][TfO], [MtMSU][TfO] are shown in Fig. 5b–e, respectively. Temperature-ramped TGA was performed to evaluate the short-term stability by the onset decomposition temperature (Tonset). For [MMU][TfO] and [MU][TfO], the Tonset was about 250 °C. The Tonset of [MtriMSU][TfO] and [MtMSU][TfO] was around 300 °C. However, the Tonset were up to 350–425 °C for [MtMG][TfO], [MDPG][TfO] and [MDTG][TfO]. This indicates that the thermal stability of C![[double bond, length as m-dash]](https://www.rsc.org/images/entities/char_e001.gif) N based ILs are higher than those of C
N based ILs are higher than those of C![[double bond, length as m-dash]](https://www.rsc.org/images/entities/char_e001.gif) O and C
O and C![[double bond, length as m-dash]](https://www.rsc.org/images/entities/char_e001.gif) S based ILs. On the other hand, it also suggests that C
S based ILs. On the other hand, it also suggests that C![[double bond, length as m-dash]](https://www.rsc.org/images/entities/char_e001.gif) O is easier to decompose with a lower energy consumption and cost, which is consistent with the PES analyses above. The largest speed of mass loss was determined by their TG-DTG curves, which reduced in the order of [MtMSU][TfO] (416 °C) < [MtriMSU][TfO] (414 °C) < [MU][TfO] (413 °C) < [MMU][TfO] (410 °C). The analysis above indicates cations containing the methylated N–C
O is easier to decompose with a lower energy consumption and cost, which is consistent with the PES analyses above. The largest speed of mass loss was determined by their TG-DTG curves, which reduced in the order of [MtMSU][TfO] (416 °C) < [MtriMSU][TfO] (414 °C) < [MU][TfO] (413 °C) < [MMU][TfO] (410 °C). The analysis above indicates cations containing the methylated N–C![[double bond, length as m-dash]](https://www.rsc.org/images/entities/char_e001.gif) X fragment can distinctly affect the thermal stability of ILs.
X fragment can distinctly affect the thermal stability of ILs.
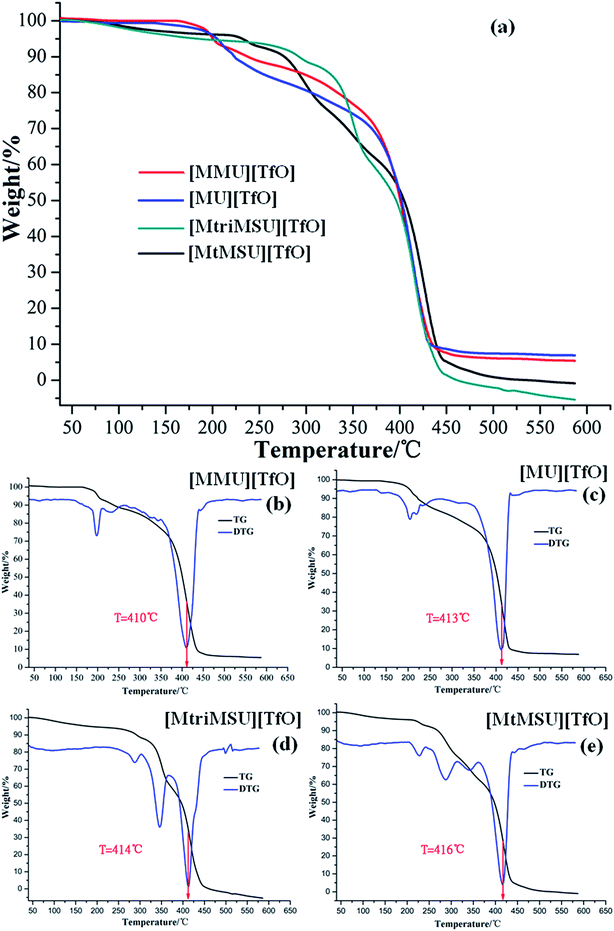 | ||
| Fig. 5 TG curves (a) and their TG-DTG curves for [MMU][TfO] (b), [MU][TfO] (c), [MtriMSU][TfO] (d) and [MtMSU][TfO] (e). | ||
Considering its advantages of lower ΔEa and energy consumption, the long-term stability of [MMU][TfO] was further investigated by isothermal TG experiment with a temperature gradient of 15 °C in the range of 300–225 °C, which is depicted in Fig. 6a. Distinctly, the isothermal TG curve shows a similar behavior where a linear weight loss was obtained for the entire duration of the experiment. Since the weight loss is about 12% after 6 h of isothermal TG experiment at 240 °C, this distillable IL can be used for different purposes because of its relative thermal stability.
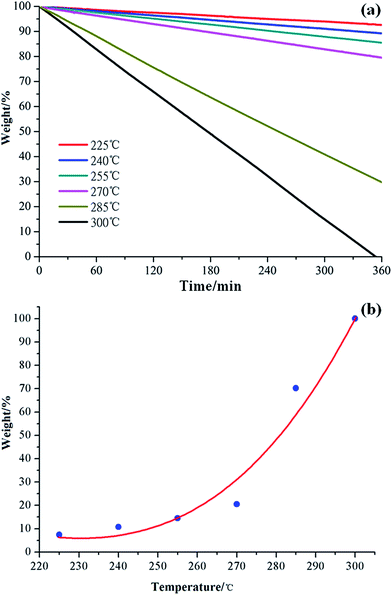 | ||
| Fig. 6 Isothermal TG curves of [MMU][TfO] at different temperatures (a) and the variation of weight% as a function of temperature after 6 h of isothermal thermogravimetry (b). | ||
Isothermal TG is shown in Fig. 6b, in which the weight loss of [MMU][TfO] is a function of temperature. Distinctly, the weight loss increases gradually in the temperature range of 225–270 °C; thereafter, it increases rapidly within the temperature range of 270–300 °C. It can be easy to conclude that [MMU][TfO] exhibits substantial (6 h) long-term thermal stability up to 270 °C with less than 20% weight loss. The Tonset determined using the temperature-ramped TGA method is useful to serve as the limiting value for practical application. This is consistent with the results of PES analyses above.
2.4 Bond order analysis
Bond order is one of the most important concepts for revealing the nature of chemical bonds, and it has many different definitions based on quantum mechanical properties.43,44 For instance, MBO45,46 and LBO47 are prevalently used to predict the molecular reactivity, stability and aromaticity.[MMU][TfO], [MtriMSU][TfO] and [MDTG][TfO] are chosen to show the bond order variation from IMs, TSs and ILs. The bond orders are listed in Table 2. The LBOs are distinctly smaller than the MBOs, which is attributed to the fact that the definition of the LBO is a covalent bond order rather than total bond order and no contribution of non-covalent interactions is included. In [MMU][TfO], the trend of the methyl transfer elongates O12–CH3 from 1.47 Å (in IM) to 2.21 Å (in TS) and, subsequently, the cleavage of O12–CH3 and the formation of O23–CH3 (1.33 Å in IL). Simultaneously, the MBO (LBO) varies from 0.802 (0.174), 0.300 (0.002) and 0.858 (0.277), respectively. It is worth it to note that both of the bond distances between the transferring methyl and two fragments are more than 2.20 Å, and their MBOs are 0.300 and 0.274, respectively. In contrast, their corresponding LBOs are almost zero (0.002). It can be concluded that non-covalent interactions instead of covalent interactions are the major driving force between the transferring methyl with two fragments. As expected, the increase in the C![[double bond, length as m-dash]](https://www.rsc.org/images/entities/char_e001.gif) O bond distance from 1.23 Å (in IM) and 1.26 Å (in TS) to 1.33 Å (in IL) and the decrease of their corresponding MBO (LBO) from 1.727 (1.126) and 1.495 (0.995) to 1.108 (0.657) were found where a double bond reduced to a single bond. The MBO (total bond order) and the LBO (covalent bond order) decreased by 0.619 and 0.469, respectively. This indicates that the covalent bond order included in the total bond order is extremely weakened in this process. The same results can be obtained from the variation of the bond distance and bond orders in [MtriMSU][TfO] and [MDTG][TfO].
O bond distance from 1.23 Å (in IM) and 1.26 Å (in TS) to 1.33 Å (in IL) and the decrease of their corresponding MBO (LBO) from 1.727 (1.126) and 1.495 (0.995) to 1.108 (0.657) were found where a double bond reduced to a single bond. The MBO (total bond order) and the LBO (covalent bond order) decreased by 0.619 and 0.469, respectively. This indicates that the covalent bond order included in the total bond order is extremely weakened in this process. The same results can be obtained from the variation of the bond distance and bond orders in [MtriMSU][TfO] and [MDTG][TfO].
| Species | Bond distance | MBO | LPO | ||
|---|---|---|---|---|---|
| [MMU][TfO] | IM | O12–CH3 | 1.47 | 0.802 | 0.174 |
| O12–S11 | 1.61 | 0.920 | 0.381 | ||
O23![[double bond, length as m-dash]](https://www.rsc.org/images/entities/char_e001.gif) C1 C1 |
1.23 | 1.727 | 1.126 | ||
| TS | O12–CH3 | 2.21 | 0.300 | 0.002 | |
| O12–S11 | 1.52 | 1.278 | 0.612 | ||
| O23–CH3 | 2.28 | 0.274 | 0.002 | ||
| O23–C1 | 1.26 | 1.495 | 0.995 | ||
| IL | O12–S11 | 1.48 | 1.605 | 0.767 | |
| O23–CH3 | 1.44 | 0.858 | 0.277 | ||
| O23–C1 | 1.33 | 1.108 | 0.657 | ||
| [MtriMSU][TfO] | IM | O13–CH3 | 1.47 | 0.804 | 0.177 |
| O13–S10 | 1.61 | 0.925 | 0.384 | ||
S25![[double bond, length as m-dash]](https://www.rsc.org/images/entities/char_e001.gif) C1 C1 |
1.70 | 1.466 | 1.121 | ||
| TS | O13–CH3 | 2.19 | 0.282 | 0.002 | |
| O13–S10 | 1.52 | 1.285 | 0.609 | ||
| S25–CH3 | 2.80 | 0.430 | 0.001 | ||
| S25–C1 | 1.73 | 1.287 | 1.042 | ||
| IL | O13–S10 | 1.49 | 1.497 | 0.715 | |
| S25–CH3 | 1.84 | 0.952 | 0.571 | ||
| S25–C1 | 1.78 | 1.114 | 0.896 | ||
| [MDTG][TfO] | IM | O13–CH3 | 1.46 | 0.808 | 0.183 |
| O13–S7 | 1.61 | 0.916 | 0.377 | ||
| N3–C1 | 1.28 | 1.760 | 1.667 | ||
| N3–H4 | 1.02 | 0.819 | 0.687 | ||
| TS | O13–CH3 | 2.18 | 0.304 | 0.002 | |
| O13–S7 | 1.53 | 1.263 | 0.602 | ||
| N3–CH3 | 2.36 | 0.321 | 0.001 | ||
| N3–C1 | 1.30 | 1.564 | 1.563 | ||
| N3–H4 | 1.02 | 0.811 | 0.690 | ||
| IL | O13–S7 | 1.48 | 1.537 | 0.750 | |
| N3–CH3 | 1.47 | 0.922 | 0.675 | ||
| N3–C1 | 1.35 | 1.202 | 1.230 | ||
| N3–H4 | 1.01 | 0.792 | 0.691 | ||
Table 2 shows that the LBOs of the X–CH3 bond in [MMU][TfO], [MtriMSU][TfO] and [MDTG][TfO] are 0.277, 0.571 and 0.675, respectively. It indicates that the thermal stabilities are in the order of [MMU][TfO] < [MtriMSU][TfO] < [MDTG][TfO], which is consistent with the results of TGA experiments.
2.5 AIM and RDG analyses
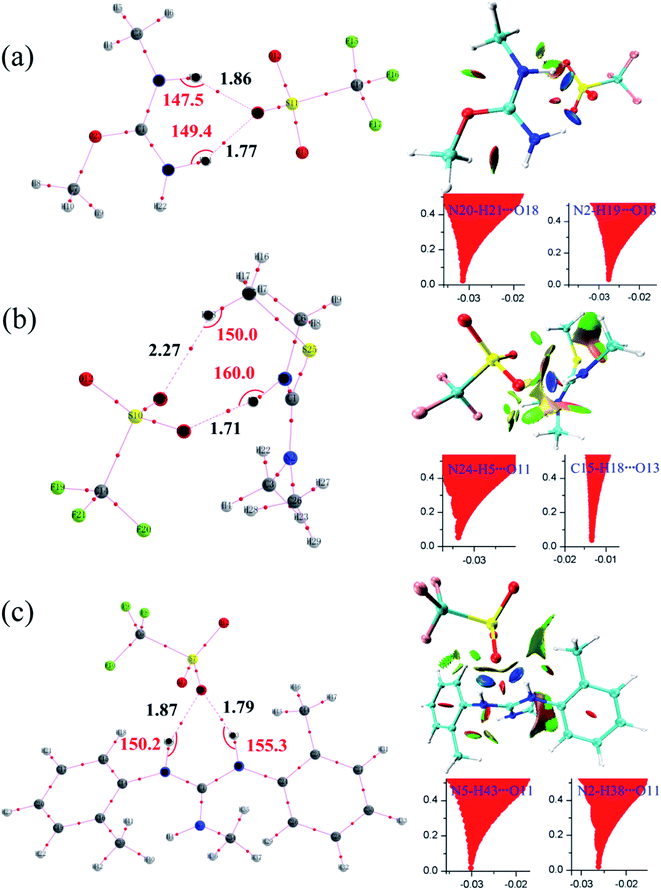
Since AIM and RDG are useful methods to study non-covalent interactions, they are also employed to further study hydrogen bonds in [MMU][TfO], [MtriMSU][TfO] and [MDTG][TfO].48,49 The geometrical and topological parameters of intermolecular hydrogen bonds are collected in Table 3, which are calculated by using wavefunctions generated at M06-2X/6-31G** level. Molecular graphs and RDG isosurfaces attached with plots of RDG versus sign(λ2)ρ are depicted in Fig. 7a–c.| H-Bonds | Distance/Å | Angle/deg. | ρ/a.u. | ∇2ρ/a.u. | H/a.u. | |
|---|---|---|---|---|---|---|
| [MMU][TfO] | N20–H21⋯O18 | 1.77 | 149.4 | 0.0318 | 0.1794 | −0.00042 |
| N2–H19⋯O18 | 1.86 | 147.5 | 0.0278 | 0.1430 | −0.00084 | |
| [MtriMSU][TfO] | N24–H5⋯O11 | 1.71 | 160.0 | 0.0341 | 0.2079 | −0.00041 |
| C15–H18⋯O13 | 2.27 | 150.0 | 0.0125 | 0.0522 | 0.00030 | |
| [MDTG][TfO] | N5–H43⋯O11 | 1.79 | 155.3 | 0.0306 | 0.1693 | −0.00075 |
| N2–H38⋯O11 | 1.87 | 150.2 | 0.0269 | 0.1374 | −0.00079 |
Topological parameters, such as electron density (ρ), Laplacian of electron density (∇2ρ) as well as energy density (H), are commonly extracted from interested bond critical points (BCPs) at interaction regions.49 It can be seen from Table 3, two types of intermolecular hydrogen bonds are found, i.e., N–H⋯O and C–H⋯O. The former type is distinctly stronger than the latter due to their ideal geometrical parameters, such as short bond distance, large bond angles and topological parameters. In [MMU][TfO], the intermolecular hydrogen bond distances of N20–H21⋯O18 and N2–H19⋯O18 are 1.77 and 1.86 Å, and their corresponding bond angles are 149.4 and 147.5 deg., respectively. As expected, the positive values of the Laplacian of the electron density (∇2ρ) at their bond critical points (BCP) demonstrate that these bonds are strong hydrogen bonds, and the electron density (ρ) value of N20–H21⋯O18 (0.0318 a.u.) is larger than N2–H19⋯O18 (0.0278 a.u.). Besides, the negative energy density (H) of them indicates that the partial covalent is included. In [MtriMSU][TfO], the intermolecular hydrogen bond distances of N24–H5⋯O11 and C15–H18⋯O13 are 1.71 and 2.27 Å, and their corresponding bond angles are 160.0 and 150.0 deg., respectively. Considering the small value of ρ (0.0125 a.u.) and∇2ρ (0.0522 a.u.) at BCPs, C15–H18⋯O13 was determined to be a weak hydrogen bond. Simultaneously, its positive H value (0.0003 a.u.) also indicates that no covalent component exists in this weak hydrogen bond. Similar conclusions can be obtained in [MDTG][TfO].
The BCP criterions in the AIM analysis are hard to use to distinguish weak interaction types. The RDG method can be regarded as an extension of the topological theory and has been performed as a suitable tool to further differentiate weak interactions from repulsive and attractive. As predicted, all N/C–H⋯O intermolecular hydrogen bonds were classified as attractive by the RDG method; however, the intensity of them cannot be distinguished quantitatively. Fig. 7a shows the scatter graphs of [MMU][TfO], in which two RDG spikes corresponding to N20–H21⋯O18 and N2–H19⋯O18 were found, and the sign(λ2)ρ were −0.0318 and −0.0278 a.u., respectively. Indeed, their disc-shape regions between the O and H atoms are also shown in a deep blue color in the RDG isosurfaces. Both of these results indicated the two interactions were strong intermolecular hydrogen bonds, coinciding with the geometrical parameters in Table 3. As shown in Fig. 7b, both the RDG spike and disc-shape region corresponding to N24–H5⋯O11 were similar to that of N20–H21⋯O18 and N2–H19⋯O18. Thus, the attraction between the O11 and H5 atoms was reasonably determined to be a strong hydrogen bond. In contrast, the RDG spike of C15–H18⋯O13 was located at a sign(λ2)ρ of −0.0125 a.u., and the disc-shape region between O13 and H18 was drawn in a light green color. This indicated that the C15–H18⋯O13 contact was a very weak hydrogen bond or even a van der Waals interaction, which can successfully confirm the results obtained from the geometrical results. The similar analysis can be extended to other ILs studied in this work.
2.6 NBO analysis
Herein, the NBO analysis was carried to get further information on the intermolecular hydrogen bonds between ions pairs. In the NBO technique, the orbital interactions between the proton donors and acceptors were obtained base on the second order perturbation theory in the following equation:where E(2) represents the second order interaction energy, εi and εj are diagonal elements, and F(i,j) is the off-diagonal NBO Fock matrix element.50 For [MMU][TfO], [MtriMSU][TfO] and [MDTG][TfO], the NBO 3D overlap diagrams for the donor–acceptor orbital interactions in the intermolecular hydrogen bonds are drawn in Fig. 8, and the details of the NBO parameters are listed in Table 4.
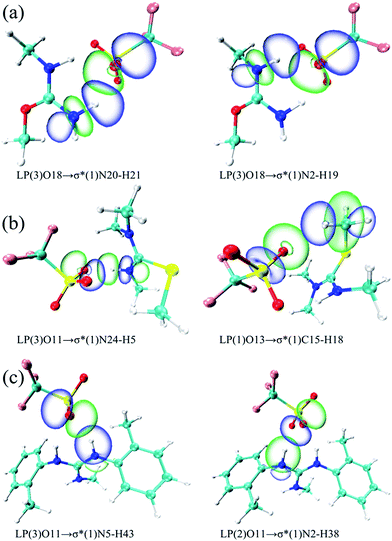 | ||
| Fig. 8 NBO 3D overlap images for donor–acceptor orbital interactions in intermolecular hydrogen bonds. (a), (b) and (c) respect [MMU][TfO], [MtriMSU][TfO] and [MDTG][TfO], respectively. | ||
| Species | Donor (i) | Acceptor (j) | E(2)/(kcal mol−1) | E(j) − E(i)/(a.u.) |
|---|---|---|---|---|
| [MMU][TfO] | LP(3)O18 | σ*(1)N20–H21 | 12.15 | 0.72 |
| LP(1)O18 | σ*(1)N20–H21 | 7.60 | 1.17 | |
| LP(3)O18 | σ*(1)N2–H19 | 7.10 | 0.72 | |
| LP(2)O18 | σ*(1)N2–H19 | 7.07 | 0.69 | |
| LP(2)O18 | σ*(1)N20–H21 | 4.59 | 0.69 | |
| LP(1)O18 | σ*(1)N2–H19 | 4.11 | 1.17 | |
| [MtriMSU][TfO] | LP(3)O11 | σ*(1)N24–H5 | 19.20 | 0.69 |
| LP(1)O11 | σ*(1)N24–H5 | 10.35 | 1.15 | |
| LP(2)O11 | σ*(1)N24–H5 | 4.57 | 0.68 | |
| LP(1)O13 | σ*(1)C15–H18 | 2.10 | 1.12 | |
| [MDTG][TfO] | LP(3)O11 | σ*(1)N5–H43 | 15.73 | 0.70 |
| LP(2)O11 | σ*(1)N2–H38 | 13.82 | 0.72 | |
| LP(1)O11 | σ*(1)N5–H43 | 6.43 | 1.17 | |
| LP(1)O11 | σ*(1)N2–H38 | 4.42 | 1.17 | |
| LP(2)O11 | σ*(1)N5–H43 | 2.28 | 0.72 |
As shown in Table 4, there were strong orbital interactions between the antibonding orbital of the proton donors σ*N–H and the lone pairs of the proton acceptors LPO. Coinciding with the geometrical and topological results, the weak orbital interaction between σ*(1)C15–H18 and LP(1)O13 was obtained in the NBO analysis. In Table 4, three types of electron transfer are found from the LPO18 to the σ*C15–H18, i.e., LP(1)O18 → σ*(1)N20–H21, LP(2)O18 → σ*(1)N20–H21 and LP(3)O18 → σ*(1)N20–H21, respectively. The E(2)s are in the order of LP(3)O18 → σ*(1)N20–H21 (12.15 kcal mol−1) > LP(1)O18 → σ*(1)N20–H21 (7.60 kcal mol−1) > LP(2)O18 → σ*(1)N20–H21 (4.59 kcal mol−1). This indicated that the orbital interaction intensity reduced in the order above. Besides, substantial overlaps were also found between LP(1)O13 with σ*(1)N20–H21/σ*(1)N2–H19 in Fig. 8a. In contrast, only the small E(2) value of 2.10 kcal mol−1 (Table 4) and the small overlap (Fig. 8b) in the boundaries of the orbitals of LP(1)O13 and σ*(1)C15–H18 were found, which indicated the existence of weak orbital interaction. Similar results can be extended to other ILs. The NBO analysis in this work is consistent with the strength of the intermolecular hydrogen bonds mentioned above.
3. Conclusions
Sixteen kinds of reversible and distillable ILs derived from the N–C![[double bond, length as m-dash]](https://www.rsc.org/images/entities/char_e001.gif) X (N, O and S) fragment were designed and studied in DFT modeling and experiments. The reversibility can be achieved through the methyl transfer mechanism between the methyl triflates and unsaturated C
X (N, O and S) fragment were designed and studied in DFT modeling and experiments. The reversibility can be achieved through the methyl transfer mechanism between the methyl triflates and unsaturated C![[double bond, length as m-dash]](https://www.rsc.org/images/entities/char_e001.gif) X bond. ESP analysis suggested that the X atom in the N–C
X bond. ESP analysis suggested that the X atom in the N–C![[double bond, length as m-dash]](https://www.rsc.org/images/entities/char_e001.gif) X fragment was a more favorable site for methyl transfer due to its higher nucleophilicity. PES analysis showed that [MtriMSU][TfO] and [MtMSU][TfO] were easier to prepare due to their lower ΔEa (around 48 kcal mol−1). [MMU][TfO] and [MU][TfO] were easier to decompose because their lower ΔEb (about 57 kcal mol−1). [MtMG][TfO], [MDPG][TfO] and [MDTG][TfO] were also easily prepared; however, their decomposition was difficult. Then, [MMU][TfO], [MU][TfO], [MtriMSU][TfO], [MtMSU][TfO], [MtMG][TfO], [MDPG][TfO] and [MDTG][TfO] were synthesized under mild conditions with high yields. The N–C
X fragment was a more favorable site for methyl transfer due to its higher nucleophilicity. PES analysis showed that [MtriMSU][TfO] and [MtMSU][TfO] were easier to prepare due to their lower ΔEa (around 48 kcal mol−1). [MMU][TfO] and [MU][TfO] were easier to decompose because their lower ΔEb (about 57 kcal mol−1). [MtMG][TfO], [MDPG][TfO] and [MDTG][TfO] were also easily prepared; however, their decomposition was difficult. Then, [MMU][TfO], [MU][TfO], [MtriMSU][TfO], [MtMSU][TfO], [MtMG][TfO], [MDPG][TfO] and [MDTG][TfO] were synthesized under mild conditions with high yields. The N–C![[double bond, length as m-dash]](https://www.rsc.org/images/entities/char_e001.gif) O derived ILs are excellent reversible ILs due to their Tonset at about 250 °C measured by the temperature-ramped TG experiments. Substantial long-term thermal stability of [MMU][TfO] was obtained in isothermal TG experiments since less than a 20% weight loss was observed when the sample was heated up to 270 °C for 6 hours. Non-covalent interactions are the major driving force of the methyl transfer according to the bond order variations of the N–C
O derived ILs are excellent reversible ILs due to their Tonset at about 250 °C measured by the temperature-ramped TG experiments. Substantial long-term thermal stability of [MMU][TfO] was obtained in isothermal TG experiments since less than a 20% weight loss was observed when the sample was heated up to 270 °C for 6 hours. Non-covalent interactions are the major driving force of the methyl transfer according to the bond order variations of the N–C![[double bond, length as m-dash]](https://www.rsc.org/images/entities/char_e001.gif) X fragment from IMs via TSs to ILs. Additionally, AIM, RDG and NBO methods were performed to study the nature of non-covalent interactions in [MMU][TfO], [MtriMSU][TfO] and [MDTG][TfO].
X fragment from IMs via TSs to ILs. Additionally, AIM, RDG and NBO methods were performed to study the nature of non-covalent interactions in [MMU][TfO], [MtriMSU][TfO] and [MDTG][TfO].
It is the further aim of this work to extend studies to more reversible and distillable ILs and their applications. A subsequent paper on radioiodine capture and carbohydrate polymer dissolution in these reversible and distillable ILs is being prepared.
4. Experimental methods
4.1 Materials
1,1,3,3-Tetramethylguanidine, 1,3-diphenylguanidine and 1,3-di-o-tolylguanidine, were purchased from Shanghai Macklin Biochemical Co., Ltd. Methyl triflates, urea, 1-methylurea, 1,1,3-trimethylthiourea and 1,1,3,3-tetramethylthiourea were obtained from Sinopharm Chem. Reagent Co. Ltd. All the chemicals were used as received without further purifications unless otherwise stated.4.2 Preparations of distillable ILs
The synthesis processes of the ILs were identical and simple, and the strategy was shown in Fig. 2. The starting material was dropped into a round-bottomed flask with vigorous stirring in an ice bath. Subsequently, methyl triflates were injected dropwise into the round-bottomed flask through a syringe under vacuum condition. The mole fraction of the starting material and methyl triflates was 1![[thin space (1/6-em)]](https://www.rsc.org/images/entities/char_2009.gif) :
:![[thin space (1/6-em)]](https://www.rsc.org/images/entities/char_2009.gif) 1. Then, the round-bottomed flask was removed to room temperature for 24 hours. Evaporation under vacuum at 70 °C was carried out to remove impurities. Colourless liquids (ILs) were obtained. The structures of seven ILs, including [MMU][TfO], [MU][TfO], [MtriMSU][TfO], [MtMSU][TfO], [MtMG][TfO], [MDPG][TfO] and [MDTG][TfO], were confirmed by NMR spectra, which were depicted in Fig. S8–S14,† respectively.
1. Then, the round-bottomed flask was removed to room temperature for 24 hours. Evaporation under vacuum at 70 °C was carried out to remove impurities. Colourless liquids (ILs) were obtained. The structures of seven ILs, including [MMU][TfO], [MU][TfO], [MtriMSU][TfO], [MtMSU][TfO], [MtMG][TfO], [MDPG][TfO] and [MDTG][TfO], were confirmed by NMR spectra, which were depicted in Fig. S8–S14,† respectively.
4.3 Methodology and instrumentation
The 1H NMR spectra were recorded for all the ILs on Bruker AVANCE III HD 500 MHz spectrometer at 298 K using D2O or CDCl3.Thermogravimetric measurements were conducted on a TGA apparatus Henven HCT-1. Unless otherwise stated, N2 atmosphere was used as the insert carrier gas. Thermal stabilities of the distillable ILs were studied by both temperature-ramped TG and isothermal TG experiments. Temperature-ramped TG experiments were performed on 10 mg of each sample from room temperature to 600 °C with a heating rate of 10 °C min−1 by using open aluminium pans. Isothermal TG was performed on 20 mg of each sample at a certain temperature for 6 h.
5. Computational details
The M06-2X functional51 was employed for DFT calculations together with the 6-311++G** basis set using the Gaussian 09 software package.52 Dispersion forces included in the M06-2X functional were demonstrated to be essential, especially in studying the weak interactions of the IL systems, such as hydrogen/halogen bonding and van der Waals interactions.16,53 In order to obtained reasonable energy profiles, the counterpoise (CP) method was employed to correct the basis set's superposition error (BSSE).54 All geometry optimizations were performed at the M06-2X/6-311++G** level of theory, starting from the structures initially optimized at the M06-2X/6-31G** level without any restriction. The wavefunctions were generated at the same level. The Intrinsic Reaction Coordinate (IRC) calculations were performed to trace all transition state (TS) structures linked the assigned intermediates (IM) and ILs. Bond orders (including Mayer bond order45 and Laplacian bond order47), atoms in molecules49,55 (AIM), natural bond orbital50,56 (NBO) and reduced density gradient48 (RDG) were carried out to investigate the bond properties and the nature of interactions using the Multiwfn software package57 together with the Visual Molecular Dynamics (VMD) program.58Conflict of interest
The authors declare no competing financial interest.Acknowledgements
This work was supported by the National Natural Science Foundation of China (No. 21203250 and 21402106) and Shandong Natural Science Foundation (ZR2014BQ024).References
- D. Y. Xing, W. Dong and T. S. Chung, Ind. Eng. Chem. Res., 2016, 55, 7505–7513 CrossRef CAS.
- H. Rodríguez, Ionic Liquids in the Context of Separation Processes, Springer, Berlin, Heidelberg, 2016 Search PubMed.
- V. Wadekar, Appl. Therm. Eng., 2017, 111, 1581–1587 CrossRef CAS.
- T. L. Greaves and C. J. Drummond, Chem. Soc. Rev., 2013, 44, 1096–1120 RSC.
- P. F. Requejo, E. Gómez, N. Calvar and Á. Domínguez, Ind. Eng. Chem. Res., 2015, 54, 1342–1349 CrossRef CAS.
- Z. Xue, B. Cao, W. Zhao, J. Wang, T. Yu and T. Mu, RSC Adv., 2016, 6, 64338–64343 RSC.
- M. Armand, F. Endres, D. R. Macfarlane, H. Ohno and B. Scrosati, Nat. Mater., 2009, 8, 621–629 CrossRef CAS PubMed.
- I. Osada, H. De Vries, B. Scrosati and S. Passerini, Angew. Chem., 2015, 55, 500–513 CrossRef PubMed.
- J. M. Vicent-Luna, J. M. Ortiz-Roldán, S. Hamad, R. Tena-Zaera, S. Calero and J. A. Anta, ChemPhysChem, 2016, 17, 2473–2481 CrossRef CAS PubMed.
- H. Mahmood, M. Moniruzzaman and S. Yusup, Adv. Mater. Res., 2016, 1133, 566–570 CrossRef.
- Z. Xue, Z. Zhang, J. Han, Y. Chen and T. Mu, Int. J. Greenhouse Gas Control, 2011, 5, 628–633 CrossRef CAS.
- H. Sun, B. Cao, Q. Tian, S. Liu, D. Du, Z. Xue and H. Fu, J. Mol. Liq., 2016, 215, 496–502 CrossRef CAS.
- B. Cao, S. Liu, D. Du, Z. Xue, H. Fu and H. Sun, J. Mol. Graphics Modell., 2015, 64, 51–59 CrossRef PubMed.
- G. Li, C. Yan, B. Cao, J. Jiang, W. Zhao, J. Wang and T. Mu, Green Chem., 2015, 18, 2522–2527 RSC.
- X. F. Sun, Y. L. Chi and T. C. Mu, Green Chem., 2014, 16, 2736–2744 RSC.
- B. Cao, J. Du, D. Du, H. Sun, X. Zhu and H. Fu, Carbohydr. Polym., 2016, 149, 348–356 CrossRef CAS PubMed.
- Z. Xue, X. Sun, Z. Li and T. Mu, Chem. Commun., 2015, 51, 10811–10814 RSC.
- Y. Marcus, The Properties of Ions Constituting Ionic Liquids, 2016, pp. 7–22 Search PubMed.
- Y. Zhang and E. J. Maginn, J. Phys. Chem. Lett., 2015, 6, 700–705 CrossRef CAS PubMed.
- C. Yan and T. Mu, Phys. Chem. Chem. Phys., 2015, 17, 3241–3249 RSC.
- W. E. S. Hart, J. B. Harper and L. Aldous, Green Chem., 2014, 17, 214–218 RSC.
- O. Nacham, K. D. Clark, H. Yu and J. L. Anderson, Chem. Mater., 2015, 27, 923–931 CrossRef CAS.
- M. T. Clough, C. R. Crick, J. Gräsvik, P. A. Hunt, H. Niedermeyer, T. Welton and O. P. Whitaker, Chem. Sci., 2014, 6, 1101–1114 RSC.
- P. Wasserscheid, Nature, 2006, 439, 797 CrossRef CAS PubMed.
- B. Wu, W. W. Liu, Y. M. Zhang and H. P. Wang, Chem.–Eur. J., 2009, 15, 1804–1810 CrossRef CAS PubMed.
- M. J. Earle, M. A. Gilea, J. N. C. Lopes, L. P. N. Rebelo, J. W. Magee, K. R. Seddon and J. A. Widegren, Nature, 2006, 439, 831–834 CrossRef CAS PubMed.
- Z. J. Chen, H. W. Xi, K. H. Lim and J. M. Lee, Angew. Chem., Int. Ed., 2013, 52, 13392–13396 CrossRef CAS PubMed.
- A. W. T. King, J. Asikkala, I. Mutikainen, P. Järvi and I. Kilpeläinen, Angew. Chem., Int. Ed., 2011, 50, 6301–6305 CrossRef CAS PubMed.
- M. S. Kelkar and E. J. Maginn, J. Phys. Chem. B, 2007, 111, 9424–9427 CrossRef CAS PubMed.
- J. P. Leal, J. M. Esperança, P. M. Da, J. N. Lopes, L. P. Rebelo and K. R. Seddon, J. Phys. Chem. A, 2007, 111, 6176–6182 CrossRef CAS PubMed.
- A. W. Taylor, K. R. Lovelock, A. Deyko, P. Licence and R. G. Jones, Phys. Chem. Chem. Phys., 2010, 12, 1772–1783 RSC.
- X. Sun, S. Liu, X. Zhou, B. Cao, X. Zhu and H. Fu, J. Mol. Liq., 2016, 221, 254–261 CrossRef CAS.
- J. Stoimenovski, E. I. Izgorodina and D. R. Macfarlane, Phys. Chem. Chem. Phys., 2010, 12, 10341–10347 RSC.
- M. Yoshizawa, W. Xu and C. A. Angell, J. Am. Chem. Soc., 2003, 125, 15411–15419 CrossRef CAS PubMed.
- T. L. Greaves and C. J. Drummond, Chem. Rev., 2008, 108, 206–237 CrossRef CAS PubMed.
- Y. Chen, Y. Cao, Y. Shi, Z. Xue and T. Mu, Ind. Eng. Chem. Res., 2012, 51, 241–246 Search PubMed.
- I. Mata, E. Molins and E. Espinosa, J. Phys. Chem. A, 2007, 111, 9859–9870 CrossRef CAS PubMed.
- M. E. Brezgunova, J. Lieffrig, E. Aubert, S. Dahaoui, P. Fertey, S. Lebègue, J. G. Ángyán, M. Fourmigué and E. Espinosa, Cryst. Growth Des., 2013, 13, 3283–3289 CAS.
- A. Kumar and S. R. Gadre, J. Chem. Theory Comput., 2016, 12, 1705–1713 CrossRef CAS PubMed.
- L. P. Rebelo, J. N. Canongia Lopes, J. M. Esperança and E. Filipe, J. Phys. Chem. B, 2005, 109, 6040–6043 CrossRef CAS PubMed.
- P. Ballone, C. Pinilla, J. Kohanoff and M. G. Del Pópolo, J. Phys. Chem. B, 2007, 111, 4938–4950 CrossRef CAS PubMed.
- M. S. Miran, H. Kinoshita, T. Yasuda, M. A. Susan and M. Watanabe, Phys. Chem. Chem. Phys., 2012, 14, 5178–5186 RSC.
- T. Ye, L. Xu, Z. Zhen, R. Chen, H. Li, X. Hui, Z. Chao and H. Wei, J. Am. Chem. Soc., 2016, 138, 9655–9662 CrossRef PubMed.
- J. Liu, J. Wu, J. Zhu, Z. Wang, J. Zhou and K. Cen, Fuel, 2016, 178, 85–92 CrossRef CAS.
- A. J. Bridgeman, G. Cavigliasso, L. R. Ireland and J. Rothery, J. Chem. Soc., Dalton Trans., 2001, 2001, 2095–2108 RSC.
- I. Mayer, Chem. Phys. Lett., 1985, 117, 270–274 CrossRef.
- T. Lu and F. Chen, J. Phys. Chem. A, 2013, 117, 3100–3108 CrossRef CAS PubMed.
- E. R. Johnson, S. Keinan, P. Morisánchez, J. Contrerasgarcía, A. J. Cohen and W. Yang, J. Am. Chem. Soc., 2010, 132, 6498–6506 CrossRef CAS PubMed.
- R. F. W. Bader, M. T. Carroll, J. R. Cheeseman and C. Cheng, J. Am. Chem. Soc., 2002, 109, 417–423 Search PubMed.
- E. D. Glendening, C. R. Lis and W. Frank, Natural Bond Orbital Methods, Wiley Interdiscip. Rev.: Comput. Mol. Sci., 2002, 2, 1–42 CrossRef.
- Y. Zhao and D. G. Truhlar, Theor. Chem. Acc., 2008, 120, 215–241 CrossRef CAS.
- M. J. Frisch, et al., Gaussian 09, revision D.01, Gaussian, Inc., Wallingford, CT, 2009 Search PubMed.
- H. Vovusha, S. Sanyal and B. Sanyal, J. Phys. Chem. Lett., 2013, 4, 3710–3718 CrossRef CAS.
- S. F. Boys and F. Bernardi, Mol. Phys., 2002, 19, 553–566 CrossRef.
- R. F. W. Bader, Atoms in molecules, Wiley Online Library, 1990, DOI:10.1002/0470845015.caa012.
- A. E. Reed, L. A. Curtiss and F. Weinhold, Chem. Rev., 1988, 88, 899–926 CrossRef CAS.
- T. Lu and F. Chen, J. Comput. Chem., 2012, 33, 580–592 CrossRef CAS PubMed.
- W. Humphrey, A. Dalke and K. Schulten, J. Mol. Graphics, 1996, 14, 33–38 CrossRef CAS PubMed.
Footnote |
| † Electronic supplementary information (ESI) available. See DOI: 10.1039/c7ra00008a |
| This journal is © The Royal Society of Chemistry 2017 |

