 Open Access Article
Study of dielectric relaxation and thermally activated a.c. conduction in lead containing topological glassy semiconductors†
Arvind Sharmaa and
N. Mehta *b
*b
aSchool of Physical and Material Sciences, Mahatma Gandhi Central University, Motihari-845401, India
bDepartment of Physics, Institute of Science, Banaras Hindu University, Varanasi-221005, India. E-mail: dr_neeraj_mehta@yahoo.co.in
First published on 30th March 2017
Abstract
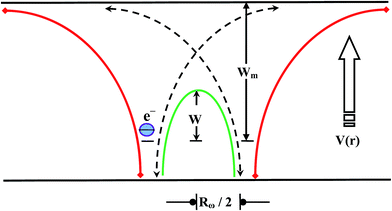
Multi-component topological glasses of the Te20Sn2Se78−xPbx (0 ≤ x ≤ 6) system have been prepared by a cost-effective melt-quench technique that is well-known for its convenience. The study of dielectric relaxation in this novel glassy system was investigated as a function of temperature in the 300–350 K temperature regime and 50 kHz to 1 MHz frequency regime. An extensive investigation proved that dielectric losses are dipolar in nature and can be implicit in terms of hopping of charge carriers over a potential barrier, as suggested by Elliot for the case of chalcogenide materials. It was found that both dielectric constant and dielectric loss depend on temperature and frequency. Moreover, it was found that the values of both dielectric constant ε′ and dielectric loss ε′′ decrease with frequency and increase with increasing temperature. A detailed analysis showed that dielectric loss ε′′ obeys Guintini relation. The variation in the dielectric properties and a.c. conductivity with Pb composition was also explored. Density of defect states in the present glasses was measured using a correlated barrier hopping (CBH) model. According to the CBH model, electron hopping takes place over the coulombic barrier height W and neighbouring sites at a distance, R. The Coulomb wells overlap and result in a lowering of the effective barrier height from Wm to a value, W.
1. Introduction
Chalcogenide glassy semiconductors (ChGS) have come under scientific scrutiny in the recent two decades due to their potential applications in optoelectronics and optics.1–8 These materials exhibit flexible structure, enormous variation in properties, and almost unlimited ability for doping and alloying for chemical sensors in the investigation of industrial aqueous solutions to monitor pollutant gasses.1 Furthermore, ChGS are the recognized candidates for utilization in fiber optics and integrated optics due to their excellent transparency in the infrared region,2 electronic and optical switching3,4 and optical recording media.5–7 Due to their IR transparency, photosensitivity, and high optical nonlinearity, these materials have been utilized to fabricate photonic devices such as fibers,7 planar waveguides, and8 gratings. The fundamental assets of ChGS can be modified as per the necessity of the technological applications. Incorporating metallic substituents alters the necessary bonding network and bonding structures of the material.Incorporating Pb into the glassy network is a way to tune its physico-chemical properties by improving thermal stability and glass forming ability by lowering the aging effects.9,10 Addition of lead at a specific composition in some ChGS shows carrier-type reversal.11 In recent years, Pb- and Sn-containing glasses9–11 and topological crystalline insulators12–14 of Se and Se–Te system have drawn attention of scientific community due to their interesting, significant and novel properties.
Dielectric and a.c. conductivity measurements in various types of advanced functional materials are of particular importance, not only from an application point of view but also from a fundamental point of view.15–17 In addition, a study of temperature dependence of dielectric permittivity, particularly in the range of frequencies where dielectric dispersion occurs, can be of great importance for understanding the nature and origin of losses occurring in these materials. Moreover, the assimilation of some metallic elements to the chalcogenide glasses causes enriched conductivity, followed by producing a substantial decrease in activation energy for transporting electrical conduction.18 This feature makes them more suitable for integrated circuits (ICs) device applications. A sensibly comprehensive understanding of electrical transport properties of ChGS is, therefore, a prime goal and demand of glass science and technology to provide relevant information for their practical utilization in the field of solid state devices. With this research plan in mind, we prepared a novel multi-component ChGS of Se–Te–Sn–Pb system.
In fact, our previous studies on ChGS of Se–Te–Sn showed that adding Sn to the Se–Te system is an efficient tool to enhance its dielectric dispersion.19 The reason behind the selection of Pb as a modifier is the unique optical, electrical and thermal properties of lead-containing chalcogenide glasses due to the small band gap and large Bohr radius of Pb. Due to this feature, lead chalcogenides become a better candidate for a tremendous number of applications.20–29 Examples of their potential applications are solar cells [20-221], telecommunications,23 field effect transistors (FET),24 and sensitive membrane materials for developing conventional chemical sensors selective to metal ions in liquid media, as well as biological imaging.25,26
The aim of the present investigation was to study the effect of Se atom replacement by Pb atoms on the electrical properties of a multi-component system. We observed that when Pb was incorporated into ternary parent Se78Te20Sn2 glass, then the thermal stability and glass forming ability of quaternary samples was enhanced noticeably. This communication deals with frequency and temperature dependence of the dielectric properties of multi-component ChGS of the Te20Sn2Se78−xPbx (0 ≤ x ≤ 6) system over the 303–348 K temperature range and 50 kHz to 1 MHz frequency range. We have seen the influence of impurity element Pb into the host glassy Se78Te20Sn2 alloy on the dielectric properties and a.c. conductivity.
2. Material synthesis and characterization
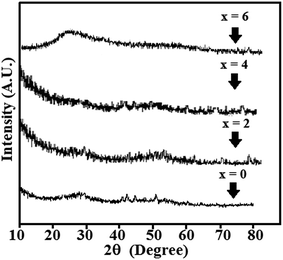
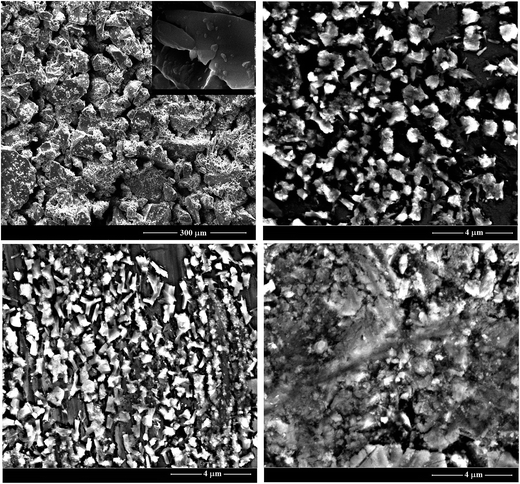
The multi-component ChGS of the present system was synthesized by the usual melt quenching technique, and the details of this quaternary system have been described elsewhere.2,19 The glassy nature of the aforesaid system has been confirmed by the X-ray diffraction technique (XRD). For this, a standard X-ray diffractometer with CuKα radiation (λ = 1.5405 Å) was employed. The typical XRD patterns of all the samples are shown in Fig. 1. The existence of crystalline-like ordering in the melt-quenched glasses is still a subject of debate in the literature.30 Therefore the presence of some blunt peaks in the XRD patterns creates a doubt regarding the possibility of crystallized fractions, but this can be regarded as negligible since the corresponding peak intensities are very small or; in other words, these XRD patterns show diffraction peaks without any signatures of crystalline phases on the macro-scale.Surface morphology characterization of the synthesized material was carried out by employing a scanning electron microscope (SEM) (Model: Quanta 200F) with an operating voltage of 25 keV (see Fig. 2).
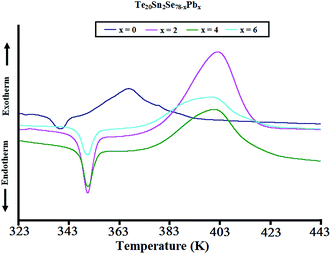
Fig. 3 shows characteristic DSC scans of the topological parent ternary and Pb-containing quaternary glasses. This figure reveals that the present samples underwent distinctive structural relaxation and crystallization phenomena through well defined endothermic and exothermic peaks in the region of the peak glass transition temperature Tg and peak crystallization temperatures, respectively. The appearance of these peaks was the further confirmation of the overall glassy nature of the present topological semiconductors.
For dielectric measurements, the aforementioned prepared glassy systems were ground to a very fine powder, and pellets (diameter ∼ 10 mm and thickness ∼ 1 mm) were obtained by compressing the powder in a die at a 5 Ton load. The pellets were mounted between two smooth aluminum electrodes of a metallic sample holder for dielectric measurements.
The sample holder employed in the present measurements consisted of two portions (see Fig. 4). The upper portion had two electrodes and an evacuation port. The samples were mounted between the jaws of two electrodes having a spring arrangement. At the end of the two electrodes, two UHF connectors were used for the electrical connections to the sample. Kanthal wire was wound as a heating element on the outer covering of the sample holder assembly (Fig. 4(b)). The heating element was covered with Plaster of Paris in order to avoid heat losses due to radiation. An O-ring was provided between the two parts of the sample holder for proper evacuation inside the chamber. The pellets were coated with silver paint to ensure good electrical contact between the sample and the electrodes.
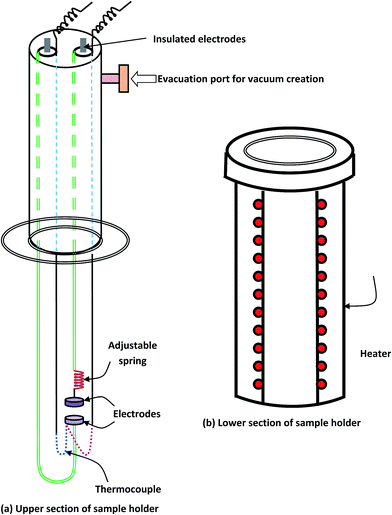 | ||
| Fig. 4 Sample holder assembly for dielectric and a.c. conductivity measurements of disc shaped samples (pellets) under vacuum at ∼10−3 Torr. | ||
The temperature measurement was facilitated by a copper constantan thermocouple mounted very near to the sample. A vacuum of 10−3 Torr was continued over the entire temperature range (303–348 K). Dielectric measurements were made using a digital LCR meter (Wayne Kerr Electronics, Model: 43100). The parallel capacitance and dissipation factor were measured, and ε′ and ε′′ were calculated. The authors favored to experiment on the pellet since the bulk had potential macroscopic effects (gas bubbles, etc.) that may have appeared during preparation. As was previously shown,28 both theoretically and experimentally, the bulk ingots and compressed pellets exhibit similar dielectric behavior in chalcogenide glasses for the suspected inhomogeneities in the case of compressed pellets for these materials.
3. Theoretical basis
Guintini and his co-workers31 suggested a suitable model for the study of dielectric dispersion in terms of the variation of the dielectric loss with the frequency and/or the temperature range as follows:
 | (1) |
In this model, n is the number of electrons that hop, N is the concentration of localized sites, ε0 is the static dielectric constant, ε∞ is the dielectric constant at infinitely high frequencies, and Wm is the energy required to move the electron from one site to an infinite distance. This above equation can be formed in another way as follows:
| ε′′ = Bωm | (2) |
 | (3) |
The study of thermally activated a.c. conduction in ChGS was carried out by a correlated barrier hopping (CBH) model. This model suggests a random distribution of the localized states and the “to-and-fro” motion of the electronic charged carriers through a rigorous relaxation time between a pair consisting of two localized states. In ChGS, the total contribution to a.c. conductivity comes from the sum of all of such pairs.
The expression for the frequency dependency of a.c. conductivity in ChGS is as follows:32
| σac(ω) = Aωs | (4) |
 | (5) |
This fact is shown in Fig. 5. Here, n represents the number of electrons involved in a hop (n = 1 and n = 2 for the single-polaron and bi-polaron processes, respectively).
The relaxation time τ for the electrons to hop over a coulombic barrier having height W is given as follows:
 | (6) |
 | (7) |
 | (8) |
The a.c. conductivity, σac(ω) for single polaron hopping originating from randomly distributed defect centers can be written as follows:32–34
 | (9) |
The corresponding value of the hopping distance is as follows:
 | (10) |
If we denote the respective contributions of single-polaron hopping originating from randomly distributed defect states to a.c. conductivity and bi-polaron hopping originating from non-random distribution of defect states by [σac(ω)]s and [σac(ω)]b, then the a.c. conductivity of ChGS can be determined by the sum of these two contributions, i.e.,
| σac(ω) = [σac(ω)]s + [σac(ω)]b | (11) |
4. Results and discussion
4.1 Analysis of surface morphology
Fig. 2(a–d) shows the microstructures of the as-prepared ChGS of the Te20Sn2Se78−xPbx (0 ≤ x ≤ 6) system. Image 2(a) exhibits a cluster like morphology at the same resolution of 300 μm, which gives a dimension of around 100 μm for the pure host clusters. The morphology of the same composition at high resolution is shown in the inset of this image. Image 2(b), taken at 4 μm resolution, explores comparatively more homogeneous clusters of several tenths of μm dimensions and shows a hierarchical surface morphology. Thus, it can be concluded that an addition of 2 atomic weight percentage (at. wt%) of Pb content into the host material gives some un-agglomerated and hierarchical distribution of clusters of smaller size. The microstructure 2(c) shows the surface morphology of 4 at. wt% Pb content incorporated into host material at a resolution of 4 μm. This image shows the clusters of nearly the same dimensions as in 2(b) but they come closer to each other following hierarchy in the surface morphology. This change in morphology appears to be due to the addition of 2 at. wt% of Pb impurity that causes a change in chemical properties of host material. Furthermore, addition of 6 at. wt% of Pb content into the host material breaks the Pb acceptance capability of the host material, which results in a drastic change in the morphology, as shown in image 2(d) taken at the same resolution of 4 μm. In this image, the clusters are almost the same size as in 2(c) and are embedded into a base material that appears to be in another phase. Upon careful examination of these images, one can see that the hierarchical style of distribution of clusters was maintained up to 4 at. wt% of Pb into the host material and is disrupted at 6 at. wt% of Pb. Thus, the morphological studies indicated that the acceptance of Pb into the host material was saturated at 6 at. wt% of Pb.4.2 Study of dielectric relaxation
Dielectric analysis measures the electrical properties of materials as a function of temperature and frequency. There are two fundamental electrical characteristics of materials that are defined by the dielectric analysis. The first one is the capacitive insulating nature, which signifies its ability to store electrical charge. Second is the conductive nature, which represents the ability of motion of the electrical charges in the material. In the following section, we report the investigation on the dielectric properties of the newly designed multi-component glassy Te20Sn2Se78−xPbx (0 ≤ x ≤ 6) system in the 50 kHz to 1 MHz frequency range and in the 303–348 K temperature range. The temperature and frequency dependence of dielectric constant and dielectric loss were investigated. Furthermore, we discussed the results of the variation in a.c. conductivity against applied field frequency and different glass compositions.Fig. 7 illustrates the temperature dependence of dielectric constant (ε′) at different frequencies in the abovementioned ranges for the glassy Te20Sn2Se78−xPbx (0 ≤ x ≤ 6) system as a representative example. It is clear from this figure that dielectric constant (ε′) increases slowly at lower temperature, and after that, it increases appreciably with the temperature increase being different at different frequencies. This behavior was observed for all the glassy compositions under investigation. This increasing variation in dielectric constant (ε′) with temperature can be attributed to the fact that the dipoles in polar materials cannot orient themselves at low temperature. When the temperature is increased dipoles exist in the material, attain some freedom, i.e. the orientation of dipoles is facilitated, and hence increase the value of orientation polarization, which increases the value of dielectric constant (ε′). Thus the temperature dependence of ε′ in the present study of a multi-component chalcogenide glassy system is similar to that report by various scientists on other chalcogenide glasses.35–37
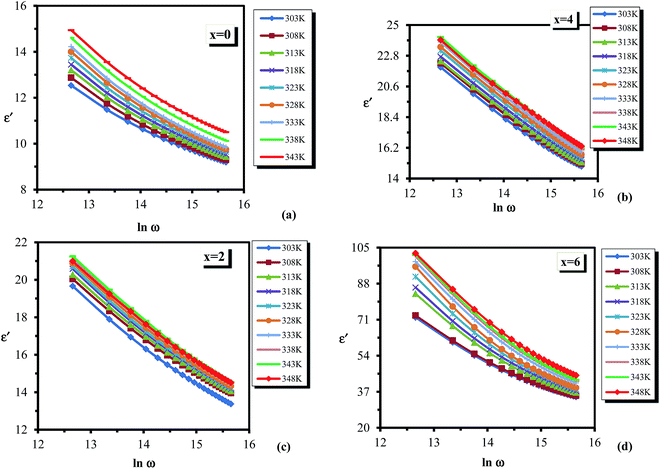 | ||
| Fig. 6 Frequency dependence of dielectric constant ε′ for the glassy Te20Sn2Se78−xPbx (0 ≤ x ≤ 6) system. | ||
To explain the variation of dielectric loss against frequency, Mott et al. suggested an assumption38,39 that when a sample is placed in an electric field, electron hopping takes place between the localized sites. The charge carriers moving between these sites hop from a donor to an acceptor state. In this respect, each pair of sites forms a dipole. Therefore, it can be revealed that the dielectric properties of chalcogenide materials can be deduced by regarding them as a set of dipoles, but only if the temperature is high enough;40 it was experimentally confirmed that under a definite temperature, the dielectric loss does not depend on the temperature. Moreover, it was supposed that each dipole has a relaxation time depending on its activation energy;41,42 which can be essentially attributed to the existence of potential barrier Wm over which the charge carriers must hop.43 The potential barrier, Wm, which was proposed by Elliot, is due to the coulombic interaction between the neighboring sites forming a dipole.44,45
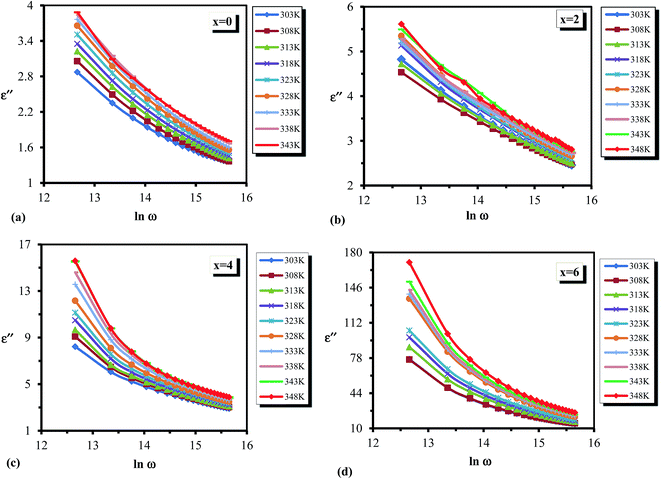
Variation of dielectric loss (ε′′) with respect to temperature is shown in Fig. 9(a–d) at different frequencies for all the glassy alloys. It is clear from the figure that the dielectric loss (ε′′) increases with increasing temperature. According to Stevels,46 the dielectric relaxation phenomenon is divided into three parts, viz. dipole losses, conduction losses and vibrational losses. The conduction losses connect the migration of ions in excess of the large distance. The ions jump excess of the highest potentials in the glassy network. As the ions move, they give some of the energy to the lattice as heat, and the amount of heat lost per cycle is proportional to σac(ω)/ω.46 Therefore, the temperature increases above room temperature for the sample, consequently increasing the σac(ω)/ω, and thus the a.c. conduction loss increases amid increasing the temperature. At low temperatures, dielectric loss shows a minimum value, which may be due to the low values of conduction and dipole and vibration losses; however, at higher temperatures, all these three losses contribute to the dielectric loss. Hence it leads to an increase in dielectric loss with increasing temperature.
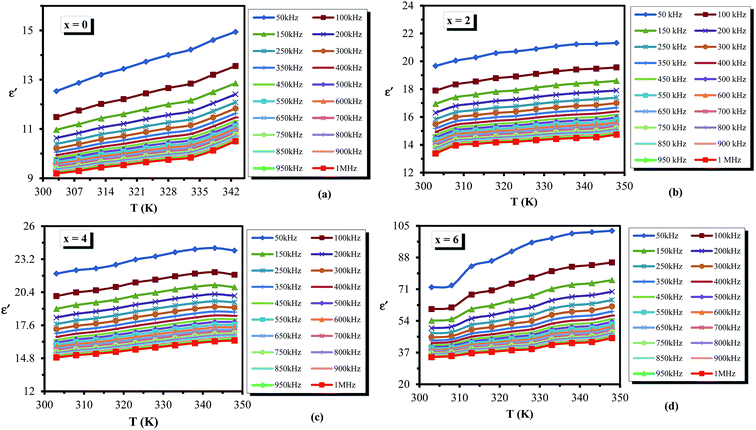 | ||
| Fig. 7 Temperature dependence of dielectric constant ε′ for the glassy Te20Sn2Se78−xPbx (0 ≤ x ≤ 6) system. | ||
According to Guintini et al.,31 the power m in eqn (2) can be determined from the slopes of the straight lines by plotting ln![[thin space (1/6-em)]](https://www.rsc.org/images/entities/char_2009.gif) ε′′ against ln
ε′′ against ln![[thin space (1/6-em)]](https://www.rsc.org/images/entities/char_2009.gif) ω at different temperatures for all the compositions. Using such plots, the frequency exponent m was determined for various samples at different temperatures. Temperature dependence of m for a particular sample (glassy Te20Sn2Se76Pb2 alloy) is shown in Fig. 10. This figure clearly reveals that the frequency exponent m decreases with increasing temperatures. Similar results were obtained for other samples.
ω at different temperatures for all the compositions. Using such plots, the frequency exponent m was determined for various samples at different temperatures. Temperature dependence of m for a particular sample (glassy Te20Sn2Se76Pb2 alloy) is shown in Fig. 10. This figure clearly reveals that the frequency exponent m decreases with increasing temperatures. Similar results were obtained for other samples.
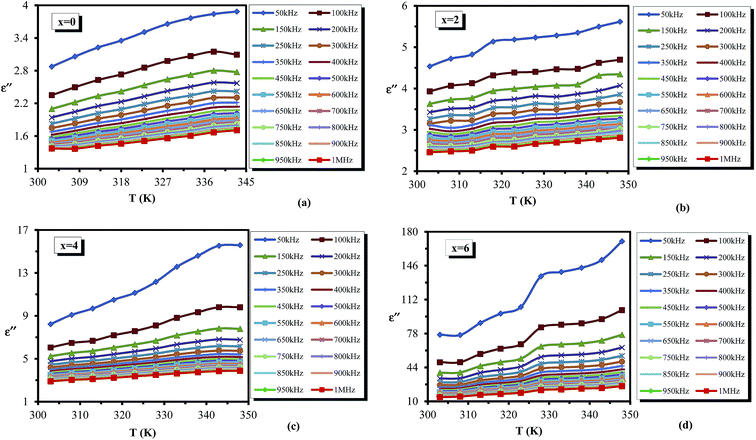 | ||
| Fig. 9 (a–d) Temperature dependence of dielectric loss ε′′ for the glassy Te20Sn2Se78−xPbx (0 ≤ x ≤ 6) system. | ||
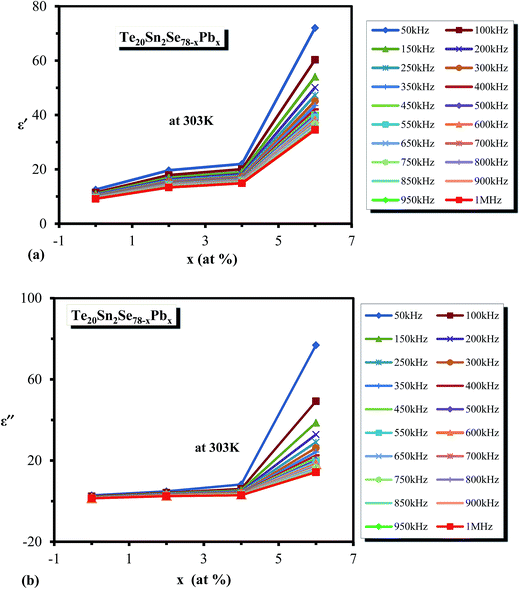
When the concentration of Pb content increases, the glassy matrix becomes heavily cross-linked, and the steric hindrance increases. The Se–Se bond will be replaced by Se–Pb bonds, which have higher bond energy as compared to the Se–Se bond since we incorporated Pb content in place of Se. Hence, the adhesive energy of the glassy matrix increases with increasing Pb content. Consequently, the increase in dielectric constant and dielectric loss takes place after the addition of Pb in parent ternary glass.
When iso-electronic atom Te is added to a-Se, the density of defect states is increased.47 This observation is explained on the basis of a structural defect model where Te is assumed to form positively charged impurities due to the low value of electro-negativity of Te compared to Se.48 When Sn atom, having lower electro-negativity in comparison of Se and Te atoms, is added to binary Se–Te system,48 it forms positively charged defect impurities. When Pb is introduced in the ternary Se–Te–Sn system at the cost of Se, one can expect that the further positive charged defects states are generated because Pb possesses lower electro-negativity compared to Se.48 This causes an increase in the density of defect states in the glassy network of quaternary alloys compared to the parent ternary alloy. From the above discussion, we can conclude that adding Pb content into the parent Se78Te20Sn2 glass increases the number of charged defect states, which enhances the dielectric properties of materials.
4.3 Analysis of thermally activated a.c. conduction
![[thin space (1/6-em)]](https://www.rsc.org/images/entities/char_2009.gif) σac(ω) and ln
σac(ω) and ln![[thin space (1/6-em)]](https://www.rsc.org/images/entities/char_2009.gif) ω for all the compositions at different temperatures nearly coincided with each other. The weak temperature dependent mechanism in the present case may be ascribed to bi-polaron hopping between D+ and D− centres around the Fermi level.44,45 Temperature dependence of s for a particular sample (glassy Te20Sn2Se74Pb4 alloy) is shown in Fig. 13. From this figure, it is clear that the frequency exponent s is reduced with increasing temperature. Similar results were obtained for other samples. The temperature dependence of the frequency exponent s indicates that a feasible conduction mechanism in the present ChGS is governed by correlated barrier hopping.
ω for all the compositions at different temperatures nearly coincided with each other. The weak temperature dependent mechanism in the present case may be ascribed to bi-polaron hopping between D+ and D− centres around the Fermi level.44,45 Temperature dependence of s for a particular sample (glassy Te20Sn2Se74Pb4 alloy) is shown in Fig. 13. From this figure, it is clear that the frequency exponent s is reduced with increasing temperature. Similar results were obtained for other samples. The temperature dependence of the frequency exponent s indicates that a feasible conduction mechanism in the present ChGS is governed by correlated barrier hopping.
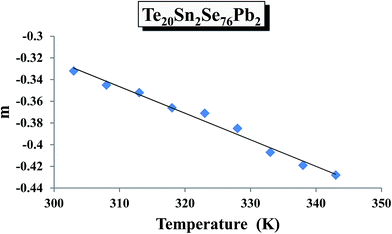 | ||
| Fig. 10 Temperature dependence of frequency exponent m of dielectric loss ε′′ for the glassy Te20Sn2Se78Pb2 alloy. | ||
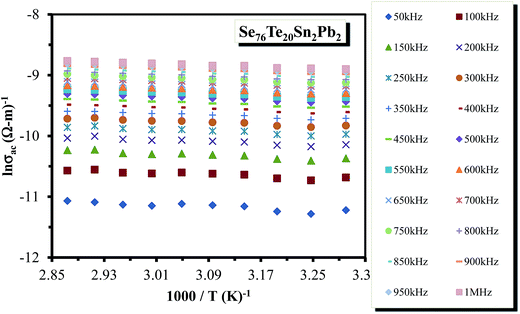
![[thin space (1/6-em)]](https://www.rsc.org/images/entities/char_2009.gif) σac against 1000/T were almost straight lines at different frequencies. Such plots are shown in Fig. 14 for a particular sample (glassy Te20Sn2Se76Pb2 alloy). Similar results were obtained for other samples. The abovementioned results show that the a.c. conductivity varies exponentially with temperature according to the following equation:
σac against 1000/T were almost straight lines at different frequencies. Such plots are shown in Fig. 14 for a particular sample (glassy Te20Sn2Se76Pb2 alloy). Similar results were obtained for other samples. The abovementioned results show that the a.c. conductivity varies exponentially with temperature according to the following equation:
 | (12) |
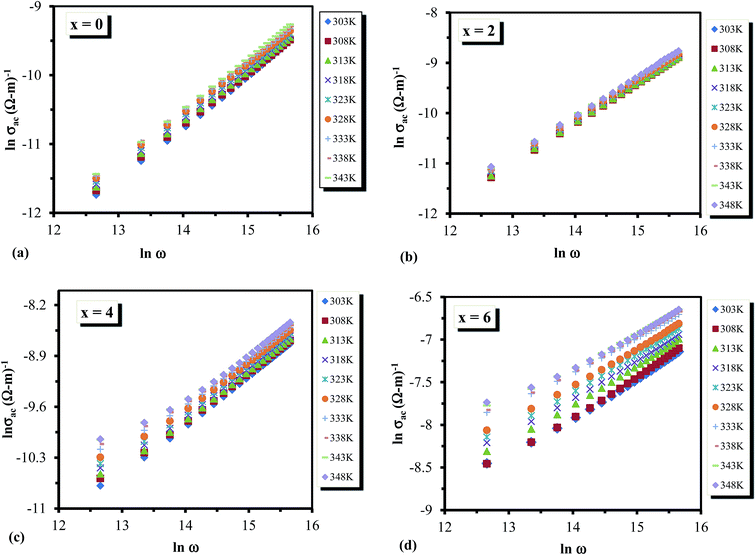 | ||
Fig. 12 (a–d) Plots between ln![[thin space (1/6-em)]](https://www.rsc.org/images/entities/char_2009.gif) σac(ω) against ln σac(ω) against ln![[thin space (1/6-em)]](https://www.rsc.org/images/entities/char_2009.gif) ω for the glassy Te20Sn2Se78−xPbx (0 ≤ x ≤ 6) system. ω for the glassy Te20Sn2Se78−xPbx (0 ≤ x ≤ 6) system. | ||
It is evident from above relation that a.c. conduction in present samples of ChGS is a thermally activated phenomenon that follows Arrhenian temperature dependence.
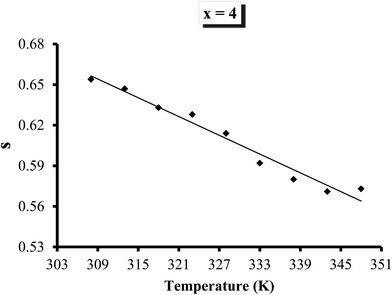 | ||
| Fig. 13 Variation in frequency exponent s of σac with temperature for the glassy Te20Sn2Se74Pb4 alloy. | ||
In Se based glasses, there is tendency to form polymerized network glasses, and the homo-polar bond is qualitatively concealed. Therefore, when Pb was added into the host glassy material, the glassy matrix became heavily crosslinked and steric hindrance increased. Furthermore, replacing Se–Se bonds by Se–Pb bonds (which have higher bond energy than Se–Se48) caused an increase in the adhesive energy after the inclusion of Pb content. This is probably the reason for an increase in the a.c. conductivity after the inclusion of Pb content into the host material.
![[thin space (1/6-em)]](https://www.rsc.org/images/entities/char_2009.gif) σac(ω) versus 1/T. The fitting is at a particular frequency and identical fitting parameter values were used for other frequencies (see Table 1).
σac(ω) versus 1/T. The fitting is at a particular frequency and identical fitting parameter values were used for other frequencies (see Table 1).
| x | Rω (Å) | Wm (eV) | ε | NNp (m−6) | |
|---|---|---|---|---|---|
| Single-polaron | Bi-polaron | ||||
| 0 | 18.6 | 0.96 | 9.7 | 8.2 × 1053 | 7.2 × 1056 |
| 2 | 11.4 | 1.02 | 14.5 | 5.8 × 1053 | 1.2 × 1051 |
| 4 | 15.4 | 0.79 | 16.1 | 6.3 × 1053 | 3.8 × 1051 |
| 6 | 10.2 | 0.61 | 39.9 | 1.8 × 1055 | 5.4 × 1053 |
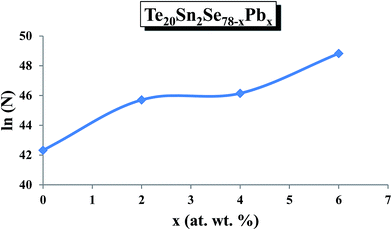
Fig. 16 shows the results of fitting of theoretical and experimental results in terms of the contributions for single-polaron and bi-polaron hopping and their sum. From Fig. 16, one can easily see that the theoretical curves are in good agreement with the experimental results. It is also evident that the contribution of single polaron hopping is much smaller than that of bi-polaron hopping. The estimated values of density of charged defect states are determined using these plots and the composition dependence of N is shown in Fig. 17.
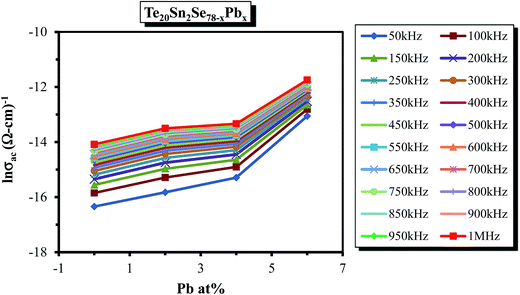 | ||
| Fig. 15 Composition dependence of σac for the glassy Te20Sn2Se78−xPbx (0 ≤ x ≤ 6) system at a particular temperature (303 K). | ||
It is evident from this figure that the density of charged defect states increased with increasing Pb content in the host material. In the previous section, we observed that the dielectric loss also increased after adding Pb content in the host material.
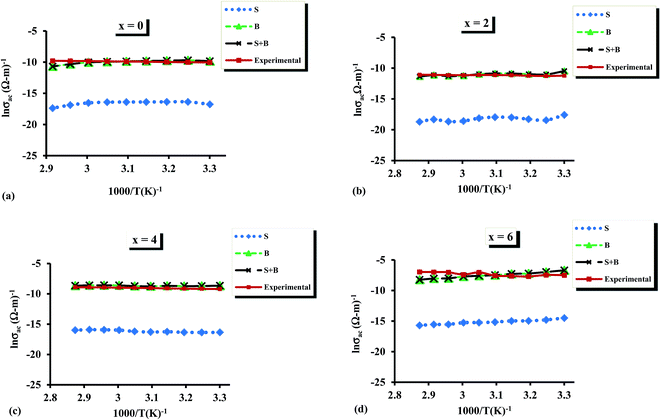 | ||
| Fig. 16 (a–d) Comparative analysis of theoretical and experimental a.c. conductivity for the glassy Te20Sn2Se78−xPbx (0 ≤ x ≤ 6) system at 500 kHz. | ||
It was reported37 that the dielectric loss in these materials mainly depends on the total number of localized sites. Thus, the increase of dielectric loss with the increased Pb content can be comprehended in terms of the increased density of defect states after inclusion of Pb content to the parent composition. The dielectric constant is also likely to rise with Pb content, as was observed in the present study, and this may be due to the increase in the number of dipoles at the higher Pb concentration. This is probably the reason for the increase in the value of density of defect states with increasing Pb content.
5. Conclusions
Temperature and frequency dependence of dielectric constant and dielectric loss were studied for the glassy Se78−xTe20Sn2Pbx (x = 0, 2, 4, 6) system. The obtained experimental results were carried out through the 303–348 K temperature range and 50 kHz to 1 MHz frequency range. It was found that the dielectric constant and dielectric loss both decreased with increasing frequency and increased with increasing temperature. It is also concluded that frequency and temperature dependence of the dielectric constant were attributed to the interfacial and orientational polarization, respectively. The temperature and frequency dependence of dielectric loss was linked to the conduction loss. Dielectric constant and loss both increased with increasing Pb content in the Se–Te–Sn composition. It was also found that a.c. conductivity did not show a strong temperature dependence. In addition, a.c. conductivity increased with increasing the Pb content into the parent composition. This happens due to the cross linking after inclusion of Pb content into the parent alloy and increases the adhesive energy of quaternary composition. Furthermore, the density of defect states for this system was also determined by fitting electrical a.c. conductivity data. Density of defect states increased after incorporating Pb in the parent Se78Te20Sn2 alloy.Acknowledgements
NM is thankful to the Department of Science and Technology (DST), New Delhi, India for providing financial assistance under the Fast Track Young Scientists Scheme [Scheme No. SR/FTP/PS-054/2010].References
- K. Michel, B. Bureau, C. Boussard-Pledel, T. Jouan, J. L. Adam, K. Staubmann and T. Baumannc, Sens. Actuators, B, 2004, 101, 252–259 CrossRef CAS.
- N. Mehta, J. Sci. Ind. Res., 2006, 65, 777–786 CAS.
- N. Mehta and A. Kumar, Recent Pat. Mater. Sci., 2013, 6, 59–67 CrossRef CAS.
- N. Mehta, Reviews in Advanced Sciences and Engineering, 2015, 4, 173–182 CrossRef.
- H. F. Hamann, M. O'Boyle, Y. C. Martin, M. Rooks and H. K. Wickramasinghe, Nat. Mater., 2006, 5, 383–387 CrossRef CAS PubMed.
- M. Wuttig and N. Yamada, Nat. Mater., 2007, 6, 824–833 CrossRef CAS PubMed.
- D. Lencer, M. Salinga, B. Grabowski, T. Hickel, J. Neugebauer and M. Wuttig, Nat. Mater., 2008, 7, 972–977 CrossRef CAS PubMed.
- J. A. Moon, L. E. Busse, J. S. Sanghera and I. D. Aggarwal, Chalcohalide based infrared optical fibers, US6195483, 2001.
- Deepika and N. S. Saxena, J. Phys. Chem. B, 2010, 114, 28–35 CrossRef CAS PubMed.
- H. Kumar and N. Mehta, Glass Phys. Chem., 2013, 39, 490–498 CrossRef CAS.
- B. Vaidhyanathan, S. Murugavel, S. Asokan and K. J. Rao, J. Phys. Chem. B, 1997, 101, 9717–9726 CrossRef CAS.
- P. Dziawa, B. J. Kowalski, K. Dybko, R. Buczko, A. Szczerbakow, M. Szot, E. Lusakowska, T. Balasubramanian, B. M. Wojek, M. H. Berntsen, O. Tjernberg and T. Story, Nat. Mater., 2012, 11, 1023–1027 CAS.
- Y. Okada, M. Serbyn, H. Lin, D. Walkup, W. Zhou, C. Dhital, M. Neupane, S. Xu, Y. Jui Wang, R. Sankar, F. Chou, A. Bansil, M. Z. Hasan, S. D. Wilson, L. Fu and V. Madhavan, Science, 2013, 341, 1496–1499 CrossRef CAS PubMed.
- I. Zeljkovic, Y. Okada, M. Serbyn, R. Sankar, D. Walkup, W. Zhou, J. Liu, G. Chang, Y. J. Wang, M. Z. Hasan, F. Chou, H. Lin, A. Bansil, L. Fu and V. Madhavan, Nat. Mater., 2015, 14, 318–324 CrossRef CAS PubMed.
- S. Devautour, C. P. E. Varsamis, F. Henn, E. I. Kamitsos, J. C. Giuntini and J. Vanderschueren, J. Phys. Chem. B, 2001, 105, 5657–5662 CrossRef CAS.
- B. Barrau, P. Demont, A. Peigney, C. Laurent and C. Lacabanne, Macromolecules, 2003, 36, 5187–5194 CrossRef.
- L. Carpentier, M. Paluch and S. Pawlus, J. Phys. Chem. B, 2011, 115, 1062–1066 CrossRef CAS PubMed.
- M. Frumar and T. Wagnar, Curr. Opin. Solid State Mater. Sci., 2003, 7, 117–126 CrossRef CAS.
- A. Sharma, N. Mehta and A. Kumar, J. Mater. Sci., 2011, 46, 4509–4516 CrossRef CAS.
- M. Mokni, A. Kahouli, F. Jomni, J. L. Garden, E. Andre and A. Sylvestre, J. Phys. Chem. A, 2015, 119, 9210–9217 CrossRef CAS PubMed.
- L. E. Johnson, S. J. Benight, R. Barnes and B. H. Robinson, J. Phys. Chem. B, 2015, 119, 5240–5250 CrossRef CAS PubMed.
- R. D. Schaller and V. I. Klimov, Phys. Rev. Lett., 2004, 92, 186601 CrossRef CAS PubMed.
- R. J. Ellinson, M. C. Beard, J. C. Johnson, P. Yu, O. I. Micic, A. J. Nozik, A. Shabaev and A. L. Efros, Nano Lett., 2005, 5, 865–871 CrossRef PubMed.
- S. A. McDonald, G. Konstantatos, S. Zhang, P. W. Cyr, E. J. D. Klem, L. Levina and E. H. Sargent, Nat. Mater., 2005, 4, 138–142 CrossRef CAS PubMed.
- M. T. Harrison, S. V. Kershaw, M. G. Burt, A. L. Rogach, A. Kornowski, A. Eychmuller and H. Weller, Pure Appl. Chem., 2000, 72, 295–307 CrossRef CAS.
- D. V. Talapin and C. B. Murray, Science, 2005, 310, 86–89 CrossRef CAS PubMed.
- P. Kania and S. Civis, Spectrochim. Acta, Part A, 2003, 59, 3063–3074 CrossRef CAS.
- M. Lach-hab, D. A. Papaconstantopoulos and M. J. Mehl, J. Phys. Chem. Solids, 2002, 63, 833–841 CrossRef CAS.
- D. R. Goyal, S. Walker and K. K. Srivastava, Phys. Status Solidi A, 1981, 64, 35–357 CrossRef.
- A. C. Wright, J. Non-Cryst. Solids, 2014, 401, 4–26 CrossRef CAS.
- J. C. Guintini, J. V. Zanchetta, D. Jullien, R. Eholie and P. Houenou, J. Non-Cryst. Solids, 1981, 45, 57–62 CrossRef.
- S. R. Elliot, Philos. Mag., 1977, 36, 1291–1304 CrossRef.
- K. Shimakawa, Philos. Mag. B, 1982, 46, 123–135 CAS.
- S. R. Elliot, Adv. Phys., 1987, 36, 135–217 CrossRef.
- M. W. Barsoum, Fundamentals of Ceramics, McGraw-Hill, New York, 1997, p. 585 Search PubMed.
- V. Modgil and V. S. Rangra, Phys. B, 2014, 445, 14–23 CrossRef CAS.
- J. Sharma and S. Kumar, Pramana, 2010, 74, 411–420 CrossRef CAS.
- N. F. Mott, E. A. Davis and R. A. Street, Philos. Mag., 1975, 32, 961–996 CrossRef CAS.
- R. A. Street and N. F. Mott, Phys. Rev. Lett., 1975, 35, 1293–1296 CrossRef CAS.
- K. K. Srivastava, A. Kumar, O. S. Panwar and L. N. D. Lakshminarayan, J. Non-Cryst. Solids, 1979, 33, 205–224 CrossRef CAS.
- A. E. Stearn and H. Eyring, J. Chem. Phys., 1937, 5, 113–123 CrossRef CAS.
- S. Glasstone, K. J. Laidler and H. Eyring, The theory of rate processes, McGraw Hill, New York, 1941 Search PubMed.
- P. Pollak and G. E. Pike, Phys. Rev. Lett., 1972, 28–22, 1449–1451 CrossRef.
- S. R. Elliott, Philos. Mag. B, 1978, 37, 553–560 CAS.
- S. R. Elliott, Solid State Commun., 1978, 27, 749–751 CrossRef CAS.
- J. M. Stevels, The Electrical Property of Glasses, in Hnadbuch der Physik, ed. S. W. Flugge, Springer, Berlin, 1997, vol. 20, p. 350 Search PubMed.
- A. Onozuka, O. Oda and I. Tsuboya, Thin Solid Films, 1987, 149, 9–15 CrossRef CAS.
- L. Pauling, J. Am. Chem. Soc., 1932, 54, 3570–3582 CrossRef CAS.
Footnote |
| † PACS.72.80.Ng disordered solids – 61.43.Fs glasses. |
| This journal is © The Royal Society of Chemistry 2017 |

