 Open Access Article
Synthesis of In2O3 nanoparticle/TiO2 nanobelt heterostructures for near room temperature ethanol sensing†
Yujie Li‡
,
Hongru Yang‡,
Jian Tian *,
Xiaolin Hu and
Hongzhi Cui*
School of Materials Science and Engineering, Shandong University of Science and Technology, Qingdao 266590, China. E-mail: jiantian@sdust.edu.cn; cuihongzhi1965@163.com
First published on 15th February 2017
Abstract
In2O3 nanoparticle/TiO2 nanobelt heterostructures are prepared via a facile hydrothermal strategy. Plenty of smaller In2O3 nanoparticles are uniformly deposited onto the surface of TiO2 nanobelts. Compared with pure TiO2 nanobelts and In2O3 nanoparticles, the obtained In2O3 nanoparticle/TiO2 nanobelt heterostructures exhibit enhanced ethanol sensing properties at a temperature as low as 45 °C and a low detection limit (1 ppm). The improved sensing properties are mainly attributed to the synergic effect of fast charge transfer of heterostructure and the formation of preferential adsorption sites by the small size of the In2O3 nanoparticles.
Introduction
The growing concerns related to safety in residential areas resulted in the rapid development of the effective detection of toxic and hazardous gases.1,2 As an important direct semiconductor with a band gap of 3.2 eV, TiO2 has been applied in many fields of research, including solar cells,3 Li-ion batteries,4 photocatalysis,5 photoelectrochemical cells,6 and sensors,7 due to its low cost and power consumption, ease of fabrication and use, stability in harsh environments, etc. Nanostructured TiO2 is generally considered a remarkable candidate for gas sensors. However, the development of near room temperature/low detection limit gas sensors remains a challenge.There are two common strategies that have been pursued in the literature to improve the properties of gas sensors.8 One method is controlling the growth of TiO2 with a specially designed shape and morphology, such as one-dimensional (1D) TiO2 nanobelts.9 Previous results have demonstrated that TiO2 nanobelts are highly advantageous for use in chemical sensors comparing with their thin-film or bulk counterparts because of their high surface-to-volume ratio, controllable structure and facile electron transport in materials.10 The other method is surface modification with semiconductor oxides, such as ZnO,11 In2O3,12 and Sn3O4,8 to construct heterostructure. In gas sensing, the heterostructure acts as a lever in electron transfer, through which electron transfer is facilitated or restrained, resulting in the enhanced sensing properties of the sensor.
It is generally difficult for a gas sensor based on a single oxide semiconductor to satisfy all requirements on sensor response, selectivity, stability, and working temperature. Sensors based on two or more components have been explored to improve gas sensing performance.13 Among the various oxides, 1D TiO2, such as TiO2 nanobelt, is a promising candidate as the backbone for the design and fabrication of composite nanostructures.14 Indium oxide (In2O3), an n-type indirect band semiconductor with an indirect band gap of 2.8 eV, has been recognized as the potential sensing material due to its high electric conductance.15 Other studies also show that In2O3 has high sensitivities to many gases such as H2,16 CO,12 NO2,17 NH3,18 O3,19 and Cl2.20 In particular, In2O3-based sensors have been reported to be highly selective to ethanol gas.15 However, the In2O3 nanoparticles have limited sensing activity due to the presence of fewer active surface sites inducing by aggregation. So In2O3 nanoparticles need to be well dispersed on the support to achieve high mass activity and resistance to aggregation. TiO2 nanobelts possess a large surface area, and can provide sufficient space for the nucleation and growth of In2O3 nanoparticles on their surfaces. As motivated by the driving force of developing nanomaterials with enhanced sensing performance, great efforts have been exhausted on the design of In2O3 nanoparticle/TiO2 nanobelt heterostructures.
In this work, a novel heterostructure made of TiO2 nanobelt backbones and small size of well-dispersed In2O3 nanoparticles is prepared by a facile hydrothermal method. Compared to pristine TiO2 nanobelts and In2O3 nanoparticles, a near room temperature (45 °C)/low detection limit (1 ppm) gas sensing performance enhancement of In2O3 nanoparticle/TiO2 nanobelt heterostructures is first documented. The TiO2 nanobelt substrates restrict the growth of In2O3 nanoparticles, resulting in the formation of smaller In2O3 nanoparticles with more interaction sites for analytic gases. This remarkable property can be attributed to the combination of several factors, including efficient electron separation of heterostructure, increased surface active sites of In2O3 nanoparticles with small size, and the large surface area.
Materials and methods
Materials
Titania P25 (TiO2), sodium hydroxide (NaOH), hydrochloric acid (HCl), sulfuric acid (H2SO4), indium nitrate hydrate (In(NO3)3·5H2O), carbamide (CO(NH2)2), diethylene glycol (DEG), and ethanol were purchased from Sinopharm.Synthesis
![[thin space (1/6-em)]](https://www.rsc.org/images/entities/b_char_2009.gif) :
:![[thin space (1/6-em)]](https://www.rsc.org/images/entities/b_char_2009.gif) 2, 1
2, 1![[thin space (1/6-em)]](https://www.rsc.org/images/entities/b_char_2009.gif) :
:![[thin space (1/6-em)]](https://www.rsc.org/images/entities/b_char_2009.gif) 1 and 2
1 and 2![[thin space (1/6-em)]](https://www.rsc.org/images/entities/b_char_2009.gif) :
:![[thin space (1/6-em)]](https://www.rsc.org/images/entities/b_char_2009.gif) 1). First, In(NO3)3·5H2O (73.3–293 mg) and CO(NH2)2 (1 g) were dissolved in the mixture of 13 mL of diethylene glycol and 2 mL of H2O under magnetic stirring. The TiO2 nanobelts (15 mg) were dispersed in above solution with magnetically stirring for 2 h, and the final pH 6.5, then transferred into a 20 mL Teflon-lined stainless autoclave, sealed and maintained at 200 °C for 24 h. The as-fabricated products were collected out and washed several times with ethanol and deionized water by filtration, respectively. After drying at 60 °C for 12 h, the In2O3 nanoparticle/TiO2 nanobelt heterostructures (mole ratios at 1
1). First, In(NO3)3·5H2O (73.3–293 mg) and CO(NH2)2 (1 g) were dissolved in the mixture of 13 mL of diethylene glycol and 2 mL of H2O under magnetic stirring. The TiO2 nanobelts (15 mg) were dispersed in above solution with magnetically stirring for 2 h, and the final pH 6.5, then transferred into a 20 mL Teflon-lined stainless autoclave, sealed and maintained at 200 °C for 24 h. The as-fabricated products were collected out and washed several times with ethanol and deionized water by filtration, respectively. After drying at 60 °C for 12 h, the In2O3 nanoparticle/TiO2 nanobelt heterostructures (mole ratios at 1![[thin space (1/6-em)]](https://www.rsc.org/images/entities/char_2009.gif) :
:![[thin space (1/6-em)]](https://www.rsc.org/images/entities/char_2009.gif) 2, 1
2, 1![[thin space (1/6-em)]](https://www.rsc.org/images/entities/char_2009.gif) :
:![[thin space (1/6-em)]](https://www.rsc.org/images/entities/char_2009.gif) 1 and 2
1 and 2![[thin space (1/6-em)]](https://www.rsc.org/images/entities/char_2009.gif) :
:![[thin space (1/6-em)]](https://www.rsc.org/images/entities/char_2009.gif) 1) were obtained. For comparison, pure In2O3 nanoparticles were also synthesized in the same manner without the addition of TiO2 nanobelts.
1) were obtained. For comparison, pure In2O3 nanoparticles were also synthesized in the same manner without the addition of TiO2 nanobelts.Results and discussion
XRD analysis associated with TiO2 nanobelts, In2O3 nanoparticles and In2O3 nanoparticle/TiO2 nanobelt heterostructures is performed to investigate the crystal structure and purity of the samples, which is shown in Fig. 1. For TiO2 nanobelts (curve a), eight distinctive peaks at 2θ = 25.3°, 37.8°, 48.1°, 53.9°, 55.1°, 62.7°, 68.8°, and 76.0° match well with anatase TiO2 (JCPDS 21-1272).22 At the same time, the TiO2(B) phase appears in the sample. The peak sites of TiO2(B) locate at 14.2°, 28.5° and 43.5° (JCPDS 46-1237).23 As shown in curve (b), the crystal phase of In2O3 nanoparticles with the diffraction peaks at about 2θ = 22.4°, 30.9°, 32.6°, 37.7°, 45.6°, 50.3°, 54.1°, 57.2°, 58.2° and 68.4°, which could be perfectly indexed to the (012), (104), (110), (113), (024), (116), (018), (214), (300) and (220) crystal faces of cubic In2O3 crystalline phase (JCPDS 71-2194).24 For In2O3 nanoparticle/TiO2 nanobelt heterostructures (curve c), all the peaks can be assigned to TiO2 or In2O3, with no extra peaks observed, which demonstrates the high purity of the samples.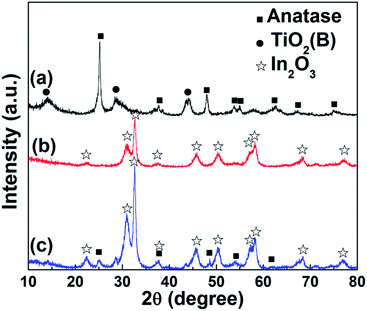 | ||
Fig. 1 XRD patterns of (a) TiO2 nanobelts, (b) In2O3 nanoparticles, and (c) In2O3 nanoparticle/TiO2 nanobelt heterostructures (mole ratio 1![[thin space (1/6-em)]](https://www.rsc.org/images/entities/char_2009.gif) : :![[thin space (1/6-em)]](https://www.rsc.org/images/entities/char_2009.gif) 1). 1). | ||
The size and morphology of samples were investigated by scanning electron microscopy (SEM), as exhibited in Fig. 2 and S1.† The as-obtained TiO2 nanobelts are around 200 nm in width, 20–40 nm in thickness, and several micrometers in length25 (Fig. S1a†). After the acid etching process, the surface-coarsened TiO2 nanobelts are obtained (Fig. S1b and c†), which have a large specific surface area and can offer abundant nucleation sites for the deposition of In2O3 nanoparticles.10 Fig. 2a reveals an agglomeration of individual In2O3 nanoparticles. The successful formation of In2O3 nanoparticle/TiO2 nanobelt heterostructures is confirmed by the SEM image (Fig. 2b). The TiO2 nanobelts are homogeneously covered by numerous In2O3 nanoparticles with several nanometers in size. It is the coarsened surface of TiO2 nanobelts that prevents In2O3 nanoparticles forming aggregation in the reaction procedure. The formed heterostructure can improve the efficiency of interfacial charge separation and enhance the gas sensing activity.26 Besides, the very small size of the In2O3 nanoparticles could lead to highly sensitive sensors because of the high sensing surface.27 EDS mapping (Fig. S2†) also shows that In, Ti, and O elements are found in the In2O3 nanoparticle/TiO2 nanobelt heterostructures, and no other impurities are observed.
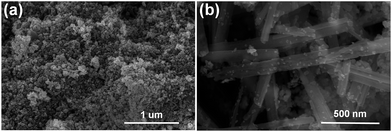 | ||
Fig. 2 SEM image of (a) In2O3 nanoparticles and (b) In2O3 nanoparticle/TiO2 nanobelt heterostructures (mole ratio 1![[thin space (1/6-em)]](https://www.rsc.org/images/entities/char_2009.gif) : :![[thin space (1/6-em)]](https://www.rsc.org/images/entities/char_2009.gif) 1). 1). | ||
N2 isotherms adsorption–desorption curves are used to determine specific surface areas (Fig. S3†). The In2O3 nanoparticle/TiO2 nanobelt heterostructures with rough surface generally have a higher specific surface area (43.357 m2 g−1) than In2O3 nanoparticles (39.356 m2 g−1) and TiO2 nanobelts (32.767 m2 g−1), which is favorable for gas detection. The large contact area can provide more reaction surface between heterostructure and target gas, resulting in the enhancement of gas sensing performance.
Fig. 3 shows the typical TEM images of In2O3 nanoparticle/TiO2 nanobelt heterostructures. It can be seen that the In2O3 nanoparticles with size of ca. 10–15 nm are attached on the surface of TiO2 nanobelts (Fig. 3a and b), coinciding with the results from the SEM observations. The crystalline lattice for the nanoparticle displays a d-spacing of approximately 0.29 nm, which corresponds to the interplanar spacing of the (222) planes of cubic In2O3 (Fig. 3c).28 In addition, the spacing of the fringes in the brighter region are 0.35 nm, which are assigned to the interplanar spacing of the (110) planes of TiO2 (Fig. 3c).29 The HRTEM images (Fig. 3c) clearly confirm that the In2O3 nanoparticle/TiO2 nanobelt heterostructure has been fabricated successfully through as-adopted hydrothermal strategy. Such a close contact is expected to favor an efficient charge transfer between In2O3 and TiO2, inducing a faster response of the sensor.
 | ||
Fig. 3 (a and b) TEM and (c) high-magnification TEM images of In2O3 nanoparticle/TiO2 nanobelt heterostructures (mole ratio 1![[thin space (1/6-em)]](https://www.rsc.org/images/entities/char_2009.gif) : :![[thin space (1/6-em)]](https://www.rsc.org/images/entities/char_2009.gif) 1). 1). | ||
The XPS measurement of In2O3 nanoparticle/TiO2 nanobelt heterostructures is performed to further confirm the chemical composition and oxidation state, and the results are shown in Fig. 4. The fully scanned spectrum of In2O3 nanoparticle/TiO2 nanobelt heterostructures suggests that the sample consists of In, Ti, O and C, as shown in Fig. 4a. The elements of In, Ti, and O belong to the In2O3 nanoparticle/TiO2 nanobelt heterostructure. The peak for C 1s at 284.8 eV is ascribed to adventitious carbon from the XPS instrument.30 The XPS spectrum (Fig. 4b) for Ti 2p shows two peaks at 464.2 and 458.5 eV that are assigned to Ti 2p1/2 and Ti 2p3/2 respectively, which is a characteristic of Ti4+ in TiO2.31 The In 3d XPS spectrum (Fig. 4c) consists of two peaks centered at 452.5 and 444.5 eV for the 3d3/2 and 3d5/2 peaks, respectively, corresponding to the In3+ spectrum in In2O3.32 The O 1s spectrum shows three peaks at 529.6, 531.2 and 532.0 eV, as shown in Fig. 4d. Here, the intense peaks at 529.6 and 531.2 eV can be assigned to lattice oxygen in TiO2 and In2O3 species, whereas the weak peak at 532 eV is possibly related to the adsorbed oxygen.33 All of these results give the insight that the In2O3 nanoparticle/TiO2 nanobelt heterostructures are composed of In2O3 and TiO2. Moreover, the In 3d peaks in the In2O3 nanoparticle/TiO2 nanobelt heterostructures shift toward the higher binding energies as compared with those of pure In2O3, while lower binding energies of Ti 2p from TiO2 are observed in the heterostructure (Fig. S4†). These phenomena can be explained by partial electron transfers from In2O3 to TiO2, i.e., an increase (decrease) of the electron density of TiO2 (In2O3) leads to the reduction (enhancement) of the binding energies of Ti 2p (In 3d). From the XPS results, we can expect the strong interfacial coupling effect between In2O3 and TiO2, which could promote the electron transfer and further enhance the gas sensing performance of In2O3 nanoparticle/TiO2 nanobelt heterostructures.
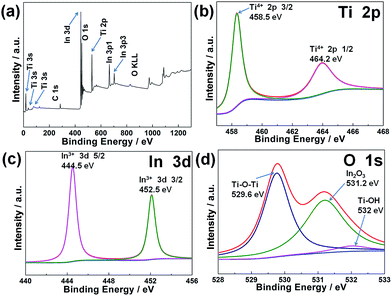 | ||
Fig. 4 XPS spectra of In2O3 nanoparticle/TiO2 nanobelt heterostructures (mole ratio 1![[thin space (1/6-em)]](https://www.rsc.org/images/entities/char_2009.gif) : :![[thin space (1/6-em)]](https://www.rsc.org/images/entities/char_2009.gif) 1): (a) fully scanned spectra, (b) Ti 2p, (c) In 3d, and (d) O 1s. 1): (a) fully scanned spectra, (b) Ti 2p, (c) In 3d, and (d) O 1s. | ||
The schematic of the ethanol gas sensor is shown in Fig. 5a. The relationship between the operating temperature and gas responses to 100 ppm ethanol of the three kinds of sensor devices were first investigated in the temperature range of 45–440 °C (Fig. 5b and S5†). Since the target gas molecules are not active enough to overcome the activation energy barrier to react with the surface-absorbed oxygen species at a low temperature,34–37 while at temperatures that are too high and difficult in gas adsorption, in turn cause the low utilization rate of the sensing material; thus, low gas responses are achieved in both of two situation.38 Hence, an “increase-maximum-decay” tendency is obtained along with the temperature increasing. More noticeable, it can be seen that TiO2 nanobelts, In2O3 nanoparticles, and In2O3 nanoparticle/TiO2 nanobelt heterostructures share the same optimal operating temperature at about 400 °C. The sensor response of the pure TiO2 nanobelts and In2O3 nanoparticles is only 10.2 and 63.8, respectively at 400 °C. The response of the sensor based on In2O3 nanoparticle/TiO2 nanobelt heterostructures reaches a maximum value of 106.3 at 400 °C, which was 1.67 times and 10.4 times higher than that of In2O3 nanoparticles and TiO2 nanobelts, respectively. Even at operating temperature as low as 100 °C (Fig. 5b), the sensitivity of the In2O3 nanoparticle/TiO2 nanobelt heterostructures reaches to about 13, which is much higher than those listed in literatures.39,40 Moreover, the In2O3 nanoparticle/TiO2 nanobelt heterostructures still have response even at near room temperature (45 °C) (Fig. S5†). To the best of our knowledge, this remarkable response to ethanol and selectivity at 45 °C has never reported before for an In2O3 based sensor. Thus, it is a proof of concept that In2O3 nanoparticle/TiO2 nanobelt heterostructures can be used as selective sensor at near room temperature.
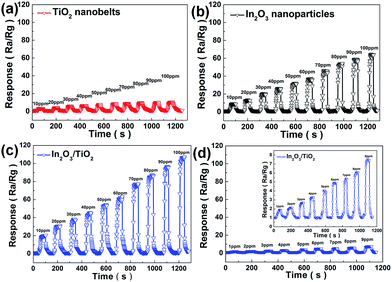
The dynamic responses of TiO2 nanobelts, In2O3 nanoparticles and In2O3 nanoparticle/TiO2 nanobelt heterostructures under different concentration from 1 ppm to 100 ppm of ethanol at an optimal operating temperature of 400 °C are revealed in Fig. 6. It can be seen that the corresponding responses of the sensors are highly dependent on the concentration of ethanol. The sensor made from the In2O3 nanoparticle/TiO2 nanobelt heterostructures even shows a higher response (21) at 10 ppm, which is better than that of TiO2 nanobelts and In2O3 nanoparticles, indicating the good sensing capability to ethanol (Fig. 6a–c). Impressively, the In2O3 nanoparticle/TiO2 nanobelt heterostructures still have the response at the very low concentration of 1 ppm (Fig. 6d).
From the perspective of practical application of sensor device, not only high response but also fast response speed should be paid attention to, on account of their vital roles on avoiding possible loss and disasters. The dynamic response curve shown in Fig. 6a–c demonstrates the In2O3 nanoparticle/TiO2 nanobelt heterostructures exhibit excellent response and recovery capability toward 100 ppm ethanol. The response time of In2O3 nanoparticle/TiO2 nanobelt heterostructures to 100 ppm ethanol is as low as 6 s, which is far less than that of In2O3 nanoparticles (9 s) and TiO2 nanobelt (21 s). Meanwhile, the recovery time of the In2O3 nanoparticle/TiO2 nanobelt heterostructures, In2O3 nanoparticles and TiO2 nanobelts are 3 s, 4 s and 45 s to 100 ppm ethanol, respectively. Therefore, the In2O3 nanoparticle/TiO2 nanobelt heterostructure sensor displays faster response and recovery speed than pristine In2O3 nanoparticle and TiO2 nanobelt.
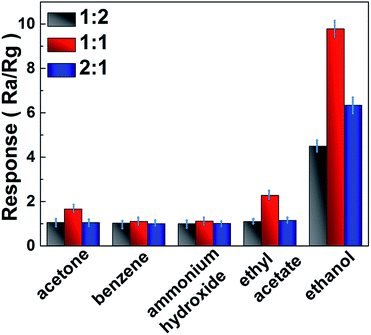
Since selectivity is a remarkable aspect of sensing properties. Fig. 7 reveals the response of the sensor that coating In2O3 nanoparticle/TiO2 nanobelt heterostructures to various kinds of test gases (acetone, benzene, ammonium hydroxide, ethyl acetate and ethanol) at 100 ppm. All of those gases are tested at a low temperature of 100 °C. Obviously, the response to ethanol is much higher than that of other probe analytes, suggesting good selectivity of as prepared In2O3 nanoparticle/TiO2 nanobelt heterostructures.
It should be noted that the sensing activity of In2O3 nanoparticle/TiO2 nanobelt heterostructures also depend on the In2O3![[thin space (1/6-em)]](https://www.rsc.org/images/entities/char_2009.gif) :
:![[thin space (1/6-em)]](https://www.rsc.org/images/entities/char_2009.gif) TiO2 molar ratio, as shown in Fig. 7. All of the In2O3 nanoparticle/TiO2 nanobelt heterostructures at different mole ratios present excellent response to ethanol at a low temperature of 100 °C, which can be explained that the high dispersed In2O3 nanoparticles on the surface of TiO2 nanobelts will have good sensing activity. The optimal molar ratio of In2O3
TiO2 molar ratio, as shown in Fig. 7. All of the In2O3 nanoparticle/TiO2 nanobelt heterostructures at different mole ratios present excellent response to ethanol at a low temperature of 100 °C, which can be explained that the high dispersed In2O3 nanoparticles on the surface of TiO2 nanobelts will have good sensing activity. The optimal molar ratio of In2O3![[thin space (1/6-em)]](https://www.rsc.org/images/entities/char_2009.gif) :
:![[thin space (1/6-em)]](https://www.rsc.org/images/entities/char_2009.gif) TiO2 is 1
TiO2 is 1![[thin space (1/6-em)]](https://www.rsc.org/images/entities/char_2009.gif) :
:![[thin space (1/6-em)]](https://www.rsc.org/images/entities/char_2009.gif) 1. The In2O3 nanoparticle/TiO2p nanobelt heterostructures at mole ratio (1
1. The In2O3 nanoparticle/TiO2p nanobelt heterostructures at mole ratio (1![[thin space (1/6-em)]](https://www.rsc.org/images/entities/char_2009.gif) :
:![[thin space (1/6-em)]](https://www.rsc.org/images/entities/char_2009.gif) 2) exhibit lower ethanol response due to the less amount of In2O3 and low number of junctions with TiO2 nanobelts. Moreover, the In2O3 nanoparticle/TiO2 nanobelt heterostructures at mole ratio (1
2) exhibit lower ethanol response due to the less amount of In2O3 and low number of junctions with TiO2 nanobelts. Moreover, the In2O3 nanoparticle/TiO2 nanobelt heterostructures at mole ratio (1![[thin space (1/6-em)]](https://www.rsc.org/images/entities/char_2009.gif) :
:![[thin space (1/6-em)]](https://www.rsc.org/images/entities/char_2009.gif) 1) present higher ethanol response than that of In2O3/TiO2 mole ratio (2
1) present higher ethanol response than that of In2O3/TiO2 mole ratio (2![[thin space (1/6-em)]](https://www.rsc.org/images/entities/char_2009.gif) :
:![[thin space (1/6-em)]](https://www.rsc.org/images/entities/char_2009.gif) 1). This should be caused that excessive In2O3 nanoparticles cover the active sites of TiO2 nanobelts, which hinder the electron transfer on the interface of In2O3 nanoparticle/TiO2 nanobelt heterostructures, and thus in turn inhibit the sensing activity.
1). This should be caused that excessive In2O3 nanoparticles cover the active sites of TiO2 nanobelts, which hinder the electron transfer on the interface of In2O3 nanoparticle/TiO2 nanobelt heterostructures, and thus in turn inhibit the sensing activity.
The cyclic experiment on sensing performance of In2O3 nanoparticle/TiO2 nanobelt heterostructures proves that the heterostructures display excellent ethanol response stability even after 6 weeks (Fig. S6†).
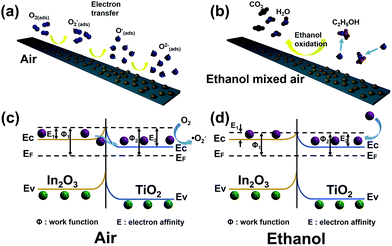
On the basis of the above results, a synergetic mechanism between In2O3 nanoparticles and TiO2 nanobelts in the In2O3 nanoparticle/TiO2 nanobelt heterostructures for the enhanced gas sensing property is proposed (Fig. 8). The conducted band (CB) and valence band (VB) potentials of In2O3 nanoparticles are estimated to be −0.63 and +2.17 eV, and the CB and VB of TiO2 nanobelts are at −0.4 and +2.8 eV, respectively (Fig. S7†).26,39–43
To further explain the mechanism of the reactions between In2O3 nanoparticle/TiO2 nanobelt heterostructures and the target gas ethanol, a rational model is proposed, as shown in Fig. 8a and b. It has been clearly revealed that the In2O3 nanoparticles decorated TiO2 nanobelts nanostructure exhibit much better sensing performances than that of pure In2O3 nanoparticles and TiO2 nanobelts, indicating the formation of heterostructure, which can contribute greatly to the improvement of sensing properties. The dramatic enhancement in sensing properties of In2O3 nanoparticle/TiO2 nanobelt heterostructures can be attributed to the following three factors.
First, the striking synergistic effect of the two metal oxides. For the as-prepared In2O3 nanoparticle/TiO2 nanobelt heterostructures, the surfaces of TiO2 nanobelts are not completely enclosed by In2O3 nanoparticles, resulting in both of them being highly accessible for the adsorption of oxygen molecules and promoting the formation of depletion layers on the surfaces of both metal oxides while exposed to air.44–47 Therefore, both In2O3 nanoparticles and TiO2 nanobelts contribute to ethanol response.
Second, preparation of small and well-dispersed sensing materials is an effective manner to improve the sensor response. In the current work, well-dispersed In2O3 nanoparticles are deposited onto the surface of TiO2 nanobelts through controlling pH = 6.5 to keep strong electrostatic attraction between TiO2 and In2O3 (Fig. S8†). The TiO2 nanobelts can act as backbone for the nucleation and growth of In2O3 nanoparticles,48 and prevent the aggregation of In2O3 nanoparticles. The smaller In2O3 nanoparticles on the surface of TiO2 nanobelts have the exposure of more sensitive surfaces, and can serve as effective adsorption sites to bind and activate oxygen molecules. Thus, more absorbed oxygen species will diffuse to the surface of the sensing semiconductor, resulting in a larger degree of electron extractions from the conduction band of TiO2 nanobelts. The high coverage of chemisorbed oxygen species make the In2O3 nanoparticle/TiO2 nanobelt heterostructures more sensitive to ethanol, directly resulting in a high response.
More importantly, owing to the strong electronic interaction between In2O3 nanoparticles and TiO2 nanobelts, a typical semiconductor junction was formed. The charge transport is significantly enhanced in the heterostructure, resulting in a rapid response–recovery.49 So, the In2O3 nanoparticle/TiO2 nanobelt heterostructures are more sensitive to target gas and have superior properties.
Fig. 8c and d show the energy band diagram near the In2O3 nanoparticle/TiO2 nanobelt heterostructures. When the n-type semiconductor In2O3 nanoparticles and n-type semiconductor TiO2 nanobelts contact with each other, electrons would transfer from the CB of In2O3 to the CB of TiO2 until the Fermi energy levels (EF) of them become equal50 (Fig. 8c). In ambient air, sensing materials can absorb oxygen molecules (O2) and form surface-adsorbed oxygen species (O2(ads)−, O(ads)−, and O(ads)2−, eqn (1)–(4)) by capturing free electrons from the CB of In2O3 nanoparticles. The reaction kinematics can be described as follows:25
| O2(g) → O2(ads) | (1) |
| O2(ads) + e− → O2(ads)− | (2) |
| O2(ads)− + e− → 2O(ads)− | (3) |
| O(ads)− + e− → O(ads)2− | (4) |
In this process, a thick electron depletion layer formed on the surface area, resulting in a decrease of carrier concentration and increase of sensor resistance in coincidence.51 When the sensor is exposed to ethanol, at a moderate temperature, the adsorbed oxygen species will take part in the reaction with these gas molecules to form CO2 and H2O (eqn (5)). The reactions between reducing gases and the surface adsorbed oxygen species can be described as follows:
| C2H5OH + 6O(ads)− → 2CO2 + 3H2O + 6e− | (5) |
As a result, the electrons trapped in the ionized oxygen species are released back to the CB of In2O3 nanoparticles (Fig. 8d), which eventually lead to the thickness of electron depletion layer decreases and lowering the measured resistance of the sensor.
Conclusions
Unique 1D nanostructures of TiO2 decorated with In2O3 nanoparticles have been synthesized via a simple hydrothermal method. The TiO2 nanobelt substrates restrict the growth of In2O3 nanoparticles, resulting in the formation of uniform and smaller In2O3 nanoparticles with a high number of surface active sites. Notably, the obtained In2O3 nanoparticle/TiO2 nanobelt heterostructures exhibit a much higher sensitive toward ethanol at near room temperature of 45 °C and low detection limit of 1 ppm. The synergic effect of pronounced electron transfer of heterostructure, as well as the creation of active adsorption sites by the small size of In2O3 nanoparticles result in an enhancement of gas response in terms of response, response/recovery time and selectivity toward ethanol.Acknowledgements
The authors are thankful for fundings from the National Natural Science Foundation of China (No. 51502160 and 51272141), National High Technology Research and Development Program of China (No. 2015AA034404), Taishan Scholar Climbing Plan of Shandong Province, Natural Science Foundation of Shandong Province (No. ZR2015EQ001), Applied Basic Research Foundation of Qingdao City (No. 16-5-1-93-jch), and SDUST Research Fund (No. 2015JQJH101).Notes and references
- S. Ghosh, N. A. Kouamé, L. Ramos, S. Remita, A. Dazzi, A. Deniset-Besseau, P. Beaunier, F. Goubard, P. H. Aubert and H. Remita, Nat. Mater., 2015, 14, 505–511 CrossRef CAS PubMed.
- X. Liang, T.-H. Kim, J.-W. Yoon, C.-H. Kwak and J.-H. Lee, Sens. Actuators, B, 2015, 209, 934–942 CrossRef CAS.
- T. Kitamura, M. Ikeda, K. Shigaki, T. Inoue, N. A. Anderson, X. Ai, T. Lian and S. Yanagida, Chem. Mater., 2004, 16, 1806–1812 CrossRef CAS.
- F. Cao, X. Wu, S. Xin, Y. Guo and L. Wan, J. Phys. Chem. C, 2010, 114, 10308–10313 CAS.
- Y. Zhang, Z. Tang, X. Fu and Y. Xu, ACS Nano, 2011, 5, 7426–7435 CrossRef CAS PubMed.
- T. Stergiopoulos, I. M. Arabatzis, G. Katsaros and P. Falaras, Nano Lett., 2002, 2, 1259–1261 CrossRef CAS.
- C. Wang, L. Yin, L. Zhang, Y. Qi, N. Lun and N. Liu, Langmuir, 2010, 26, 12841–12848 CrossRef CAS PubMed.
- G. Chen, S. Ji, H. Li, X. Kang, S. Chang, Y. Wang, G. Yu, J. Lu, J. Claverie and Y. Sang, ACS Appl. Mater. Interfaces, 2015, 7, 24950–24956 CAS.
- A. Hazra, B. Bhowmik, K. Dutta, P. Chattopadhyay and P. Bhattacharyya, ACS Appl. Mater. Interfaces, 2015, 7, 9336–9348 CAS.
- P. Hu, G. Du, W. Zhou, J. Cui, J. Lin, H. Liu, D. Liu, J. Wang and S. Chen, ACS Appl. Mater. Interfaces, 2010, 2, 3263–3269 CAS.
- C. Wang, L. Yin, L. Zhang, D. Xiang and R. Gao, Sensors, 2010, 10, 2088–2106 CrossRef CAS PubMed.
- N. Singh, R.-K. Gupta and P.-S. Lee, ACS Appl. Mater. Interfaces, 2011, 3, 2246–2252 CAS.
- B. Wu, Z. Lin, M. Sheng, S. Hou and J. Xu, Appl. Surf. Sci., 2016, 360, 652–657 CrossRef CAS.
- J. Tian, Z. Zhao, A. Kumar, R. I. Boughton and H. Liu, Chem. Soc. Rev., 2014, 43, 6920–6937 RSC.
- S. Park, S. Kim, G.-J. Sun and C. Lee, ACS Appl. Mater. Interfaces, 2015, 7, 8138–8146 CAS.
- A. Qurashi, E. El-Maghraby, T. Yamazaki and T. Kikuta, Sens. Actuators, B, 2010, 147, 48–54 CrossRef CAS.
- S. Elouali, L. G. Bloor, R. Binions, I. P. Parkin, C. J. Carmalt and J. A. Darr, Langmuir, 2012, 28, 1879–1885 CrossRef CAS PubMed.
- G. W. Ho, Sci. Adv. Mater., 2011, 3, 150–168 CrossRef CAS.
- X. Lu, Q. Yu, K. Wang, L. Shi, X. Liu, A. Qiu, L. Wang and D. Cui, Cryst. Res. Technol., 2010, 45, 557–561 CrossRef CAS.
- Y. Zhang, G. Jiang, K. W. Wong and Z. Zheng, Sens. Lett., 2010, 8, 355–361 CrossRef CAS.
- X. Wang, S. Qiu, J. Liu, C. He, G. Lu and W. Liu, Eur. J. Inorg. Chem., 2014, 2014, 863–869 CrossRef CAS.
- J. Tian, P. Hao, N. Wei, H. Cui and H. Liu, ACS Catal., 2015, 5, 4530–4536 CrossRef CAS.
- W. Zhou, G. Du, P. Hu, G. Li, D. Wang, H. Liu, J. Wang, R. I. Boughton, D. Liu and H. Jiang, J. Mater. Chem. A, 2011, 21, 7937–7945 RSC.
- K. Nouneh, M. Oyama, R. Diaz, M. Abd-Lefdil, I. V. Kityk and M. Bousmina, J. Alloys Compd., 2011, 509, 2631–2638 CrossRef CAS.
- X. Wang, Y. Sang, D. Wang, S. Ji and H. Liu, J. Alloys Compd., 2015, 639, 571–576 CrossRef CAS.
- J. Tian, Y. Sang, Z. Zhao, W. Zhou, D. Wang, X. Kang, H. Liu, J. Wang, S. Chen and H. Cai, Small, 2013, 9, 3864–3872 CrossRef CAS PubMed.
- T.-T. Trinh, N.-H. Tu, H.-H. Le, K.-Y. Ryu, K.-B. Le, K. Pillai and J. Yi, Sens. Actuators, B, 2011, 152, 73–81 CrossRef CAS.
- J. Luo, X. Zhou, L. Ma, X. Xu, H. Ruan and Z. Zhang, RSC Adv., 2016, 6, 52627–52635 RSC.
- Q. Li, T. Li, S. Chang, Q. Tao, B. Tian and J. Zhang, CrystEngComm, 2016 10.1039/c6ce00938g.
- S. Gao, C. Dong, L. Hong, K. Xiao, X. Pan and X. Li, Electrochim. Acta, 2013, 114, 233–241 CrossRef CAS.
- L. Ma, M. Hou, Z. Xie and Z. Zhang, Sci. Rep., 2015, 5, 12890 CrossRef CAS PubMed.
- L. Lin, J. Yu, S. Cheng and P. Lu, Chin. Phys. B, 2015, 24, 078103 CrossRef.
- J. G. Kim, D. L. Pugmire, D. Battaglia and M. A. Langell, Appl. Surf. Sci., 2000, 165, 70–84 CrossRef CAS.
- R. Asapu, V. M. Palla, B. Wang, Z. Guo, R. Sadu and D. H. Chen, J. Photochem. Photobiol., A, 2011, 225, 81–87 CrossRef CAS.
- C. Jin, K. Baek, H. Kim and C. Lee, Curr. Appl. Phys., 2011, 11, S274–S278 CrossRef.
- L. Zhang, K. Wong, H. Yip, C. Hu, J. Yu, C. Chan and P. Wong, Environ Sci Tech, 2010, 44, 1392–1398 CrossRef CAS PubMed.
- R. Bari, P. Patil, S. Patil and A. Bari, Bull. Mater. Sci., 2013, 36, 967–972 CrossRef CAS.
- J. Liu, M. Dai, T. Wang, P. Sun, X. Liang, G. Lu, K. Shimanoe and N. Yamazoe, ACS Appl. Mater. Interfaces, 2016, 8, 6669–6677 CAS.
- X. Li, J. Liu, H. Guo, X. Zhou, C. Wang, P. Sun, X. Hu and G. Lu, RSC Adv., 2015, 5, 545–551 RSC.
- T. Zhang, F. Gu, D. Han, Z. Wang and G. Guo, Sens. Actuators, B, 2013, 177, 1180–1188 CrossRef CAS.
- J. Zai, J. Zhu, R. Qi and X. Qian, J. Mater. Chem., 2013, 1, 735–745 RSC.
- Z. Zhao, D. Wang, X. Kang, Y. Sang and H. Liu, Energy and Environment Focus, 2014, 3, 404–410 CrossRef.
- J. Lv, T. Kako, Z. Li, Z. Zou and J. Ye, J. Phys. Chem. C, 2010, 114, 6157–6162 CAS.
- Y. Wang, Q. Wang, X. Zhan, F. Wang, M. Safdar and J. He, Nanoscale, 2013, 5, 8326–8339 RSC.
- S. Mubeen, G. Hernandez-Sosa, D. Moses, J. Lee and M. Moskovits, Nano Lett., 2011, 11, 5548–5552 CrossRef CAS PubMed.
- J. Mu, B. Chen, M. Zhang, Z. Guo, P. Zhang, Z. Zhang, Y. Sun, C. Shao and Y. Liu, ACS Appl. Mater. Interfaces, 2011, 4, 424–430 Search PubMed.
- P. Feng, Q. Wan and T. Wang, Appl. Phys. Lett., 2005, 87, 213111 CrossRef.
- G. Chen, S. Ji, Y. Sang, S. Chang, Y. Wang, P. Hao, J. Claverie, H. Liu and G. Yu, Nanoscale, 2015, 7, 3117–3125 RSC.
- T. Kirchartz, W. Gong, S. A. Hawks, T. Agostinelli, R. C. MacKenzie, Y. Yang and J. Nelson, J. Phys. Chem. C, 2012, 116, 7672–7680 CAS.
- S. Xu, J. Gao, L. Wang, K. Kan, Y. Xie, P. Shen, L. Li and K. Shi, Nanoscale, 2015, 7, 14643–14651 RSC.
- R. Sharma, S. Patel and K. Pargaien, Adv. Nat. Sci.: Nanosci. Nanotechnol., 2012, 3, 035005 CrossRef.
Footnotes |
† Electronic supplementary information (ESI) available: SEM image of TiO2 nanobelts and surface-coarsened TiO2 nanobelts; elemental energy-dispersive X-ray spectroscopy (EDS) mapping of the obtained In2O3 nanoparticle/TiO2 nanobelt heterostructures (mole ratio 1![[thin space (1/6-em)]](https://www.rsc.org/images/entities/char_2009.gif) : :![[thin space (1/6-em)]](https://www.rsc.org/images/entities/char_2009.gif) 1), nitrogen adsorption–desorption isotherms of TiO2 nanobelts, In2O3 nanoparticles and In2O3 nanoparticle/TiO2 nanobelt heterostructures (mole ratio 1 1), nitrogen adsorption–desorption isotherms of TiO2 nanobelts, In2O3 nanoparticles and In2O3 nanoparticle/TiO2 nanobelt heterostructures (mole ratio 1![[thin space (1/6-em)]](https://www.rsc.org/images/entities/char_2009.gif) : :![[thin space (1/6-em)]](https://www.rsc.org/images/entities/char_2009.gif) 1), In 3d and Ti 2p core-level XPS spectra of the samples, response of ethanol vapor sensors based on In2O3 nanoparticle/TiO2 nanobelt heterostructures (mole ratio 1 1), In 3d and Ti 2p core-level XPS spectra of the samples, response of ethanol vapor sensors based on In2O3 nanoparticle/TiO2 nanobelt heterostructures (mole ratio 1![[thin space (1/6-em)]](https://www.rsc.org/images/entities/char_2009.gif) : :![[thin space (1/6-em)]](https://www.rsc.org/images/entities/char_2009.gif) 1) upon exposure to 100 ppm of ethanol vapor at low operating temperature (45 °C, 55 °C and 80 °C), the sensing stability of the In2O3 nanoparticle/TiO2 nanobelt heterostructures (mole ratio 1 1) upon exposure to 100 ppm of ethanol vapor at low operating temperature (45 °C, 55 °C and 80 °C), the sensing stability of the In2O3 nanoparticle/TiO2 nanobelt heterostructures (mole ratio 1![[thin space (1/6-em)]](https://www.rsc.org/images/entities/char_2009.gif) : :![[thin space (1/6-em)]](https://www.rsc.org/images/entities/char_2009.gif) 1) sensor to 100 ppm ethanol with respect to a low temperature of 100 °C; UV-vis diffuse reflectance spectra of TiO2 nanobelts, In2O3 nanoparticles and In2O3 nanoparticle/TiO2 nanobelt heterostructures. Mott–Schottky plots of TiO2 nanobelts and (c) In2O3 nanoparticles collected at a frequency of 1000 Hz in dark; zeta potentials of TiO2 nanobelts and In2O3 nanoparticles in aqueous solution at different pH values. See DOI: 10.1039/c7ra00011a 1) sensor to 100 ppm ethanol with respect to a low temperature of 100 °C; UV-vis diffuse reflectance spectra of TiO2 nanobelts, In2O3 nanoparticles and In2O3 nanoparticle/TiO2 nanobelt heterostructures. Mott–Schottky plots of TiO2 nanobelts and (c) In2O3 nanoparticles collected at a frequency of 1000 Hz in dark; zeta potentials of TiO2 nanobelts and In2O3 nanoparticles in aqueous solution at different pH values. See DOI: 10.1039/c7ra00011a |
| ‡ Theses authors contributed equally. |
| This journal is © The Royal Society of Chemistry 2017 |


