 Open Access Article
Preparation and photoluminescence properties of yellow-emitting CuInS2/ZnS quantum dots embedded in TMAS-derived silica†
Chikako Wadaa,
Yoshiki Iso *a,
Tetsuhiko Isobe*a and
Hirokazu Sasakib
aDepartment of Applied Chemistry, Faculty of Science and Technology, Keio University, 3-14-1 Hiyoshi, Kohoku-ku, Yokohama 223-8522, Japan. E-mail: iso@applc.keio.ac.jp; isobe@applc.keio.ac.jp; Fax: +81 45 566 1551; Tel: +81 45 566 1558 Tel: +81 45 566 1554
bSHOEI CHEMICAL INC., 2-1-1 Nishi-Shinjuku, Shinjuku-ku, Tokyo 163-0443, Japan
First published on 23rd January 2017
Abstract
The degradation of CuInS2 (CIS) quantum dots (QDs) under excitation light due to photo-oxidization by O2 has been a significant problem. Embedding QDs into a matrix to protect them against O2 would improve their photostability. In this paper, hydrophilized CIS/ZnS/ZnS QDs prepared by a ligand exchange method were embedded in silica through a sol–gel method using tetramethylammonium silicate (TMAS) aqueous solution, in which negatively-charged nanoparticles can be well dispersed. QDs modified with 3-mercaptopropionic acid (MPA) were well dispersed into TMAS-derived silica. The obtained monolithic TMAS-derived silica composites containing embedded MPA-modified CIS/ZnS/ZnS QDs exhibited high photoluminescence (PL) quantum yields (43–47%). Changes in PL intensity under continuous excitation were measured to evaluate the photostability of the QDs. The PL intensity of the composite was 105% that of the initial value after 5 h irradiation, while the PL intensities of as-prepared QDs and a PMMA composite decreased to 88% and 92%, respectively. The good gas barrier properties of TMAS-derived silica likely caused the high photostability by preventing O2 from reaching the surface of the embedded QDs.
1 Introduction
White LEDs, which have high emission efficiencies and low environmental loads, have been developed as alternative light sources to traditional incandescent lamps and fluorescent lamps.1,2 Most common LEDs are composed of a blue InGaN LED and phosphors that down-convert blue light to yellow-orange light. YAG:Ce3+ has been used as a down-convertor for white LEDs owing to its broad greenish-yellow emission under blue light excitation and good durability. However, poor color rendering properties are obtained when YAG:Ce3+ is combined with LEDs because of the low red emission intensity of the phosphor.3,4I–III–VI2 type quantum dots (QDs) of CuInS2 (CIS) have drawn much attention as new down-convertors for white LEDs. Traditional II–VI and III–V type QDs, which emit through interband transitions, have smaller Stokes shifts. I–III–VI2 type QDs exhibit defect emission with a large Stokes shift suppressing self-absorption.5 This red-light-rich emission of CIS QDs would improve the color rendering of white LEDs. Additionally, the low toxicity of CIS compared with that of Cd-containing materials is a further advantage for practical applications.5 Core/shell-type CIS/ZnS QDs with a high fluorescence quantum yield (QY) of ∼100% have been fabricated through progress in the development of liquid-phase CIS QD syntheses. Various methods of CIS QD synthesis have been reported, including thermal decomposition of a single source precursor,6–8 rapid injection of S source solution into a solution containing Cu and In sources with high temperature heating (hot-injection method),9–11 and solvothermal reaction using an autoclave.12,13 After these studies, a non-injection method was suggested and developed to achieve higher QYs.14–23 Zhong et al. mixed copper(I) acetate, indium(III) acetate, 1-dodecanethiol (DDT), and 1-octadecene (ODE) with a Cu/In molar ratio of 1![[thin space (1/6-em)]](https://www.rsc.org/images/entities/char_2009.gif) :
:![[thin space (1/6-em)]](https://www.rsc.org/images/entities/char_2009.gif) 1, followed by heating at 240 °C under Ar atmosphere.18 In a following work, a QY of 5% was obtained by adding oleic acid and changing copper(I) acetate to copper(I) iodide in consideration of their reactivity based on the HSAB principle.23 Jang et al. fabricated CIS/ZnS/ZnS QDs by a two step-growth process involving the fabrication of a ZnS shell on CIS core particles obtained by a non-injection method using copper(I) iodide, indium(III) acetate, and DDT as sources.22 These core/shell/shell type QDs showed a QY of 92%. However, the photoluminescence (PL) intensity of CIS QDs is decreased by the photooxidation of sulfide to sulfate by oxygen. This degradation could not be sufficiently suppressed in the core/shell type CIS/ZnS QDs.22,24
1, followed by heating at 240 °C under Ar atmosphere.18 In a following work, a QY of 5% was obtained by adding oleic acid and changing copper(I) acetate to copper(I) iodide in consideration of their reactivity based on the HSAB principle.23 Jang et al. fabricated CIS/ZnS/ZnS QDs by a two step-growth process involving the fabrication of a ZnS shell on CIS core particles obtained by a non-injection method using copper(I) iodide, indium(III) acetate, and DDT as sources.22 These core/shell/shell type QDs showed a QY of 92%. However, the photoluminescence (PL) intensity of CIS QDs is decreased by the photooxidation of sulfide to sulfate by oxygen. This degradation could not be sufficiently suppressed in the core/shell type CIS/ZnS QDs.22,24
Embedded-QD composites for white LEDs have been fabricated by curing a mixture of silicone resin and QDs by heating or UV light irradiation.21,25,26 However, these methods have the following problems: (i) QDs might be degraded by the heating process used to cure the resin; (ii) the silicone resin is not be cured completely owing to the prevention of its polymerization by long-chain alkyl ligands adsorbed on the surface of the QDs.26 Furthermore, QDs with hydrophobic surfaces could not be dispersed homogeneously in the hydrophilic silicone resin. The aggregation of QDs decreases their QY through fluorescence resonance energy transfer (FRET) from smaller QDs to larger ones.21,22
To overcome the problems of QD photooxidation and the methods used for fabricating QD-embedded composites for white LEDs, the embedding of QDs into various other matrix materials has been investigated. Jang et al. fabricated QD@polymethylmethacrylate (PMMA) composites by curing a mixture of QD dispersion and powdered PMMA.22 The QDs were homogeneously dispersed in the PMMA, but were degraded by photooxidation owing to the high O2 permeability of PMMA. Therefore, the QD@PMMA was coated with low O2 permeability silica, resulting in a high photostability. Ziegler et al. prepared core/shell-structured QDs coated with a silica layer via a reverse-micelle technique.26 They fabricated composites without the polymerization of the silicone resin suffering because the ligands on the QDs had no long alkyl-chain groups. However, in this method, aggregation of the QDs occurred during the hybridization process because of the silica coating the surface ligands of the QDs, resulting in decreased PL intensity.26 Sohn et al. hydrophilized QDs through surface modification by ligand exchange, and then embedded them in silica particles synthesized via a modified sol–gel chemistry using the Stöber–Fink–Bohn method and seeded growth. Finally, they dispersed the QD-containing silica particles in epoxylated trimethylolpropane triacrylate (ETPTA).27 The QDs were found to be well dispersed in the silica particles by electron microscopy. Jun et al. mixed hydrophilized QDs fabricated by ligand-exchange with a sol solution containing tetraethylorthosilicate (TEOS), and obtained monolithic silica composites after a sol–gel process.28 High concentrations of QDs could be dispersed in the composites using sols containing highly-concentrated QDs. Moreover, the composites showed good photostability because silica is a low O2 gas permeable material. As a result, CIS QDs could be highly-concentrated into a monolithic silica composite while also suppressing photodegradation.
Researchers have previously suggested a number of methods of exchanging hydrophobic surface ligands with hydrophilic ones to embed QDs into silica. These include refluxing a mixture of hydrophobic QDs and thiol molecules with a hydrophilic functional group such as OH, COOH, or SO3H,29,30 and phase-transfer using a two-phase mixture of a hydrophobic solvent containing dispersed QDs and a hydrophilic solvent containing thiol molecules with other hydrophilic functional groups.31,32 Li et al. reported a QY of 30–68% for core/shell-type InP/ZnS QDs prepared by shell coating through phase transfer and photochemical reaction in an aqueous phase.31 Talapin et al. exchanged the ligands of long-chain alkylamines adsorbed on CdSe and CdTe QDs with thiol molecules having a hydrophilic dimethylammonium group by stirring the hydrophobic QDs with an aqueous solution containing the thiol molecules.33 However, a decrease in QY from 30% to 18% was observed in this report. A further method is the injection of hydrophilic molecules during QD growth. Kim et al. carried out ligand exchange by injecting an excess quantity of molecules having a SH group and a OH group during the growth of CIS/ZnS QDs having adsorbed long-chain alkylthiol ligands.34,35 This ligand exchange using objective ligands in excess quantity occurred through adsorption–desorption equilibrium on the QDs during their growth process. The dry conditions likely suppressed any decrease in QY. In traditional ligand exchange processes, significant degradation of QDs by water has been a serious problem. The in situ process of the above-described ligand exchange method overcomes this issue.
In this work, we investigated improvement of the QY and photostability of CIS QDs by embedding them in silica to suppress the degradation of their PL properties. Aqueous tetramethylammonium silicate (TMAS) solution was chosen as the silica source. This is a basic aqueous solution containing silicate unit anions, e.g., Si8O208−, and tetramethylammonium.36 The addition of ester compounds such as methyl lactate into TMAS solution initiates a decrease in pH through the generation of carboxylic acid by the hydrolysis of the ester. This phenomenon results in gelation possibly through the flocculation of the silicate units, caused by a decrease in the electrostatic repulsion among them.36 TMAS solution containing such electrostatically dispersed silicate anions also well disperses nanoparticles modified with negatively-charged ligands under basic conditions, allowing the formation of TMAS-derived silica composites containing homogeneously-dispersed nanoparticles.37 Accordingly, QDs modified with thiol molecules having a carboxyl group, charged negatively by deprotonation under basic conditions, via ligand exchange process were expected to be homogeneously dispersed in the TMAS-derived silica. To compare the dispersibility of hydrophilized QDs with different surface ligands in the silica composites, 11-mercapto-1-undecanol (MUD), 11-mercaptoundecanoic acid (MUA), and 3-mercaptopropionic acid (MPA) were used in the ligand exchange process. In situ injection of thiol molecules having a hydrophilic group was used in the ligand exchange process to suppress the degradation of the QDs. The changes in the PL properties and photostability of the QDs after the hybridization process with TMAS-derived silica were investigated and discussed.
2 Experimental
2.1 Materials
Zinc(II) acetate dihydrate (99.9%) and copper(I) iodide (99.5%) were purchased from Wako Pure Chemical Industries Ltd. Zinc(II) stearate (10.6%) was purchased from Mitsuwa Chemicals Co., Ltd. Indium(III) acetate (99.99%), MUD (97%), MUA (95%), and aqueous TMAS solution (99.99%) were purchased form Sigma-Aldrich Co. LLC. Oleic acid (>85.0%), DDT (>95.0%), ODE (>90.0%), MPA (98.0%), methyl L-(−)-lactate (98%), and PMMA were purchased from Tokyo Chemical Industry Co., Ltd. Chloroform (99.0%), ethanol (99.5%), and hexane (95.0%) were purchased from Kanto Chemical Co., Inc. All reagents were used without further purification.2.2 Preparation of QDs
A mixture of zinc(II) acetate dihydrate (4.0 mmol), oleic acid (1.5 mL), DDT (1 mL), and ODE (4 mL) was heated at 190 °C for 5 min. The mixture was then bubbled with Ar for 30 min to yield a first ZnS shell stock solution. A mixture of zinc(II) stearate (4 mmol), DDT (1 mL), and ODE (4 mL) was heated at 190 °C for 5 min. This mixture was then bubbled with Ar for 30 min to yield a second ZnS shell stock solution.DDT (5.0 mL) was placed in a four-necked flask and bubbled with Ar for 30 min. Copper(I) iodide (0.125 mmol) and indium(III) acetate (0.500 mmol) were then added to the four-necked flask. The first ZnS shell stock solution was put into a funnel connected to the four-necked flask. The system was degassed at 100 °C for 30 min and purged with Ar. The temperature was increased to 230 °C and maintained at this temperature for 5 min to grow CIS core QDs. The first ZnS shell stock solution was then dropped into the colloidal solution of CIS core QDs at a rate of 1.0 mL min−1 at 230 °C. The temperature was increased to 240 °C and maintained for 50 min to grow the CIS/ZnS core/shell QDs. When the CIS/ZnS/ZnS core/shell/shell QDs had been prepared, the second ZnS shell stock solution was injected into the colloidal solution of CIS/ZnS QDs at a rate of 1.0 mL min−1 at 240 °C. The mixture was maintained at this temperature for 60 min to grow the second ZnS shell. After cooling to room temperature, the colloidal solution was washed with chloroform and excess ethanol, collected by centrifugation at ∼16![[thin space (1/6-em)]](https://www.rsc.org/images/entities/char_2009.gif) 000 ×g (12
000 ×g (12![[thin space (1/6-em)]](https://www.rsc.org/images/entities/char_2009.gif) 000 rpm using a rotor of 10 cm in diameter), and re-dispersed in chloroform. Powder samples were obtained by drying the colloid in a vacuum desiccator for 1 day after the centrifugation.
000 rpm using a rotor of 10 cm in diameter), and re-dispersed in chloroform. Powder samples were obtained by drying the colloid in a vacuum desiccator for 1 day after the centrifugation.
2.3 Ligand exchange of QDs
The ligand exchange of the QDs was carried out by an in situ method during the QD growth stage. MPA (9.8 mmol or 29 mmol) was injected to the as-prepared colloidal solution of CIS/ZnS or CIS/ZnS/ZnS QDs at 240 °C. The colloidal solution was maintained at this temperature for 15 min, after which it was cooled to room temperature and washed with ethanol and hexane to yield hydrophilized QD paste. For comparison, MUD (9.8 mmol) or MUA (9.8 mmol) was dissolved in ODE (2 mL) at 100 °C and the solution was injected into a colloidal solution of CIS/ZnS QDs. The same procedures for ligand exchange and purification were then performed.2.4 Preparation of QDs embedded in TMAS-derived silica
The hydrophilized QD paste (0.02 g) was dispersed in aqueous TMAS solution (2.0 g) under ultrasonication. Then, methyl L-(−)-lactate (0.14 g) was added to the solution. The prepared sol was poured into a plastic mold (25 mm × 25 mm × 15 mm) and placed in an electric desiccator for four days to a yield QD@TMAS-derived silica composite by gelation and drying. For comparison, QDs were also embedded in PMMA resin. CIS/ZnS/ZnS paste (0.06 g) obtained before ligand exchange was dispersed in 10 mL of chloroform and the dispersion was then mixed with 1.00 g of PMMA powder. The mixture was subjected to degassing treatment and poured into a glass mold. The mixture was then dried in an electric desiccator for one day to yield the QD@PMMA composite.2.5 Characterization
Powder X-ray diffraction (XRD) profiles were obtained using an X-ray diffractometer (Rigaku, RINT-2200) with a Cu Kα radiation source and monochromator. Crystallite sizes (D) were calculated using the Scherrer eqn (1).
 | (1) |
 | (2) |
3 Results and discussion
3.1 Characterization of as-prepared QDs
Crystallographic structures of the as-prepared CIS, CIS/ZnS, and CIS/ZnS/ZnS QD powder samples were evaluated by the XRD method. XRD profiles are shown in Fig. S1 of ESI.† Each sample contained tetragonal-chalcopyrite CIS and zinc-blende ZnS. However, the peaks of CIS and ZnS could not be distinguished clearly from each other because their positions are close together. Compared with those of the CIS QDs, the peaks of the CIS/ZnS and CIS/ZnS/ZnS QDs were slightly shifted toward those of zinc-blende ZnS. The crystallite size of the CIS QDs was 2.0 nm.UV-vis absorption spectra of CIS, CIS/ZnS, and CIS/ZnS/ZnS QD dispersions are shown in Fig. 1(A). The shouldered spectra without obvious peaks correspond to the conventional absorption spectrum of CIS QDs.38 This spectral shape might be attributed to either sole or combined factors of broad size distribution, unequal composition distribution, or a unique electronic property of the CIS QDs.39 The Tauc plots shown in Fig. 1(B) were calculated according to eqn (3) to determine the band gap (Eg) of the QDs.40
| (αhν)2 = A(hν − Eg), | (3) |
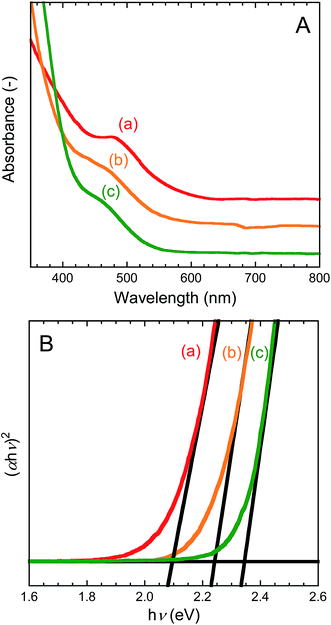 | ||
| Fig. 1 UV-vis absorption spectra (A) and Tauc plots (B) of (a) CIS, (b) CIS/ZnS, and (c) CIS/ZnS/ZnS QD dispersions. | ||
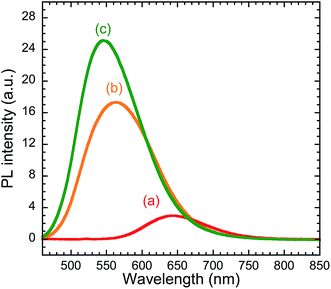
Chloroform dispersions of the CIS, CIS/ZnS, and CIS/ZnS/ZnS QDs emitted red, yellow, and greenish-yellow light, respectively, under 365 nm irradiation (see Fig. S2 of ESI†). Their PL spectra measured with λex = 450 nm are shown in Fig. 2. The emission peaks of the CIS, CIS/ZnS and CIS/ZnS/ZnS QDs were observed at about 650 nm, 560 nm, and 550 nm, respectively. The emission mechanism of CIS QDs has not been confirmed yet.5 One of the reasons for the blue-shift of the emission peak by ZnS-shelling would be the increase in Eg which originates from a decrease in CIS core size by formation of an alloy at the core–shell interface.
Relative QYs were calculated using eqn (2). The relative QYs of the CIS, CIS/ZnS, and CIS/ZnS/ZnS QDs were 7%, 40% and 57%, respectively. The improvement in relative QY caused by the ZnS shell may be explained by the passivation of the surface defects causing non-radiative recombination.22
3.2 Dispersibility of hydrophilized QDs in TMAS-derived silica
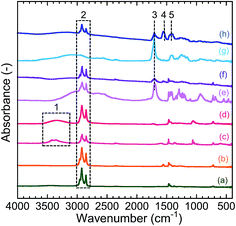
The hydrophilization of the CIS/ZnS QDs was carried out using an injection of MPA (9.8 mmol) or ODE solution of MUD (9.8 mmol) or MUA (9.8 mmol), followed by aging. Fig. 3 shows the FT-IR spectra of the CIS/ZnS QDs before and after the hydrophilization. The spectrum of the as-prepared CIS/ZnS QDs (b) corresponds to that of DDT (a), indicating that DDT was adsorbed on the QD surface. The spectrum of the CIS/ZnS QDs modified with MUD (d) exhibited a broad absorption peak assigned to the OH stretching vibration (ν(OH), no. 1) at ∼3400 cm−1.34 The absorption peaks of CH stretching vibrations (ν(CH), no. 2) were observed at around 2900 cm−1 and 2800 cm−1 in the spectra of CIS/ZnS-MUD (d), CIS/ZnS-MUA (f), and CIS/ZnS-MPA (h).41 It should be noted that the ν(CH) absorption was very weak in the spectrum of MPA (g), so some of the DDT molecules would have adsorbed to the QD surface even after the hydrophilization. In the spectra of the QDs modified with MUA and MPA (CIS/ZnS-MUA (f) and CIS/ZnS-MPA (h), respectively), a C![[double bond, length as m-dash]](https://www.rsc.org/images/entities/char_e001.gif) O stretching vibration (ν(C
O stretching vibration (ν(C![[double bond, length as m-dash]](https://www.rsc.org/images/entities/char_e001.gif) O), no. 3) absorption peak was observed at ∼1700 cm−1.42 In the spectrum of CIS/ZnS-MPA, absorption peaks of the asymmetric (νas(COO−), no. 4) and symmetric (νs(COO−), no. 5) stretching vibration of COO− were also observed at around 1560 cm−1 and 1400 cm−1, respectively.42 According to these results, the surfactant of each QD was exchanged from DDT to MUD, MUA, or MPA. Additionally, the smaller weight loss of CIS/ZnS-MPA compared with as-prepared CIS/ZnS in TGA supports the evidence for exchange of DDT on the QD surface with MPA (see Fig. S3 of ESI†). The spectrum of CIS/ZnS-MPA contained νas(COO−) and νs(COO−) peaks, indicating the deprotonation of the carboxyl group of the injected MPA and its coordination to unreacted metal cations. The XRD profiles of the QDs did not change after the hydrophilization process, as shown in Fig. S4 of ESI.† In other words, the crystallinity of the CIS/ZnS QDs was maintained through the surfactant injection and following aging.
O), no. 3) absorption peak was observed at ∼1700 cm−1.42 In the spectrum of CIS/ZnS-MPA, absorption peaks of the asymmetric (νas(COO−), no. 4) and symmetric (νs(COO−), no. 5) stretching vibration of COO− were also observed at around 1560 cm−1 and 1400 cm−1, respectively.42 According to these results, the surfactant of each QD was exchanged from DDT to MUD, MUA, or MPA. Additionally, the smaller weight loss of CIS/ZnS-MPA compared with as-prepared CIS/ZnS in TGA supports the evidence for exchange of DDT on the QD surface with MPA (see Fig. S3 of ESI†). The spectrum of CIS/ZnS-MPA contained νas(COO−) and νs(COO−) peaks, indicating the deprotonation of the carboxyl group of the injected MPA and its coordination to unreacted metal cations. The XRD profiles of the QDs did not change after the hydrophilization process, as shown in Fig. S4 of ESI.† In other words, the crystallinity of the CIS/ZnS QDs was maintained through the surfactant injection and following aging.
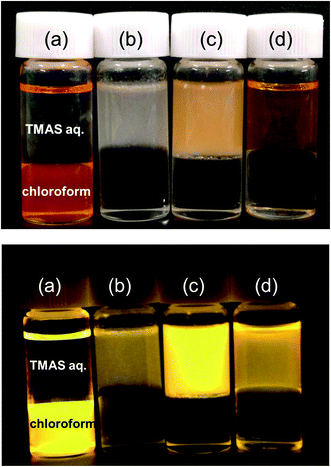
Fig. 4 shows photographs of dispersions containing as-prepared and hydrophilized CIS/ZnS QDs. The upper and bottom phases are aqueous TMAS solution and chloroform, respectively. The as-prepared CIS/ZnS QDs which were dispersed in the chloroform (a) moved to the TMAS solution after the hydrophilization. The upper phases containing CIS/ZnS-MUD (b) and CIS/ZnS-MUA (c) QDs were turbid, while the one containing CIS/ZnS-MPA QDs (d) was relatively clear. Fig. 5 shows fabricated monolithic CIS/ZnS@TMAS-derived silica composites containing CIS/ZnS-MUD, CIS/ZnS-MUA, and CIS/ZnS-MPA QDs. The CIS/ZnS-MUD QDs were strongly aggregated. The CIS/ZnS-MUA QDs were dispersed relatively well in the TMAS-derived silica, but the composite was opaque. In contrast, the CIS/ZnS-MPA QDs were dispersed homogeneously, resulting in a translucent orange composite. The difference in dispersibility could be explained by the molecular structure of the surfactants used in the hydrophilization (Fig. S5 of ESI†). All of the surfactants had an SH group, the S of which coordinated to a metal atom on the QD surface. The OH and COOH groups of the surfactants were therefore oriented to the outside. The COOH group was charged negatively by deprotonation in the basic TMAS solution. The resulting electrostatic repulsion among the negatively surface-charged QDs enhanced their dispersibility. The reason for the strong aggregation of the QDs modified with MUD in the TMAS-derived silica was that OH group of alcohol is hard to deprotonate. The difference in the alkyl-chain-length of MPA and MUA likely influenced the hydrophilicity of the QDs because the alkyl group was the hydrophobic part. MPA has a shorter alkyl chain than MUA, resulting in a high hydrophilicity that made the QDs easily dispersible in the TMAS solution and gelled silica. According to Rayleigh's light scattering theory, light scattering intensity is proportional to the sixth power of the dispersed particle size.43 The high dispersibility of the CIS/ZnS-MPA QDs allowed a sufficiently small particle size to be maintained, resulting in a low light scattering intensity and thereby causing the TMAS-derived silica composite with embedded QDs to be translucent.
3.3 Characterization of TMAS-derived silica composite embedded MPA-modified QDs
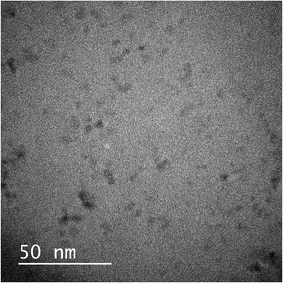
The optical properties of the composite-embedded QD were evaluated. In this section, CIS/ZnS/ZnS QD (relative QY = 57%) prepared using the two-step ZnS shell growth process was used to exploit its superior PL properties compared with those of the CIS/ZnS QDs. Furthermore, the injected amount of MPA was increased from 9.8 mmol to 29 mmol to improve the dispersibility of the hydrophilized QDs. The transmission spectrum and photograph of a monolithic TMAS-derived silica composite with MPA-modified CIS/ZnS/ZnS QDs is shown in Fig. 6. The decrease in transmittance at <550 nm was derived from light absorption by the embedded QDs. However, transmittance at >550 nm was over 60%. The TEM image shown in Fig. 7 revealed that the QDs were homogeneously dispersed in the TMAS-derived silica.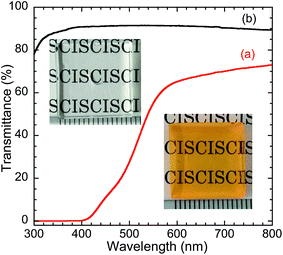 | ||
| Fig. 6 Transmission spectra and photographs of (a) monolithic TMAS-derived silica composite with 6 wt% CIS/ZnS/ZnS-MPA and (b) blank TMAS-derived silica. Both samples were 15 mm × 15 mm × 2 mm. | ||
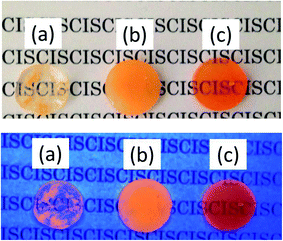
Fig. 8 exhibits TMAS-derived silica composites containing 1.0 wt% to 15 wt% embedded CIS/ZnS/ZnS QDs. Increasing the QD concentration changed the color of the composite from greenish-yellow to orange. The normalized PL spectra of the composites are compared in Fig. 9. Red-shift of the emission peak was observed as the QD concentration was increased. From the TEM image in Fig. 7 confirming the homogeneous dispersion of the QDs in the TMAS-derived silica, this phenomenon is attributable to the reabsorption of luminescence, not FRET.28 The absolute QYs of TMAS-derived silica composite embedded CIS/ZnS and CIS/ZnS/ZnS QDs measured for 450 nm excitation were shown in Fig. S6 of ESI.† When the QD concentration was 1–15 wt%, the absolute QYs of the composite-embedded CIS/ZnS and CIS/ZnS/ZnS QDs were 27–30% and 43–47%, respectively.
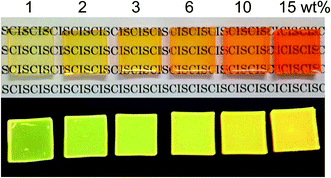 | ||
| Fig. 8 Photographs of monolithic TMAS-derived composites containing CIS/ZnS/ZnS-MPA at 1–15 wt% under white light (top) and 365 nm near-UV light (bottom). | ||
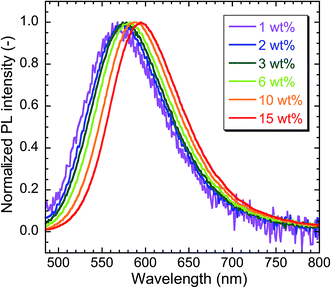 | ||
| Fig. 9 Comparison of normalized PL spectra of TMAS-derived silica composites containing different concentrations of embedded CIS/ZnS/ZnS-MPA. λex = 450 nm. | ||
3.4 Evaluation of photostability of QDs
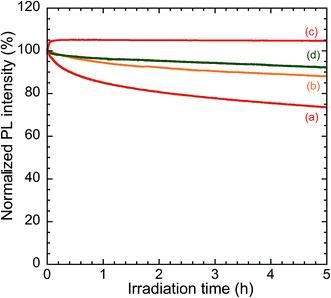
Fig. 10 shows the changes in PL intensity of the samples under continuous irradiation with 450 nm light. The irradiance of the excitation light was 0.10 mW cm−2. The initial PL intensity of each sample was normalized to 100% for comparison. After 5 h irradiation, the PL intensities of the powdered samples of CIS/ZnS and CIS/ZnS/ZnS QDs were 74% and 88% of their initial values, respectively. The higher photostability of the CIS/ZnS/ZnS QDs was attributed to the more effective suppression of the photooxidation of the CIS core by O2 by the doubly-grown ZnS shell. The PL intensity of the TMAS-derived silica composite-embedded CIS/ZnS/ZnS QDs increased to 105% in the early stage of measurement (in ∼5 min). The PL intensity showed almost no change after this rise, indicating a high photostability of the composite. The early increase in PL intensity is attributable to the photoreduction of the partially-oxidized surface of the QDs by the adsorbed thiol ligands, namely MPA.44 Moreover, it is possible that residual molecules such as lactic acid generated by the hydrolysis of methyl L-(−)-lactate photoreduced the partially-oxidized QDs. The high photostability of the composite was derived from its protection by the silica matrix, which acted as a gas barrier against O2 and thereby preventing photooxidation. For comparison, a PMMA–resin composite containing CIS/ZnS/ZnS QDs was fabricated and evaluated in the same way. The PL intensity of this composite decreased to 92% of its initial value after 5 h irradiation. The improvement in the photostability of the QDs obtained using silica instead of PMMA resin is explained by the excellent O2 impermeability of silica compared with that of PMMA.224 Conclusions
CIS/ZnS QDs were hydrophilized through ligand exchange by injecting thiol molecules with OH or COOH groups (MUD, MUA or MPA) into a dispersion of DDT-modified QDs followed by aging. The hydrophilized QDs were dispersed into aqueous TMAS solution, and monolithic TMAS-derived silica composites containing embedded QDs were fabricated through a sol–gel method by adding methyl L-(−)-lactate. MUD- and MUA-modified QDs aggregated in the TMAS derived-silica. Conversely, MPA-modified QDs exhibited excellent dispersion in the TMAS-derived silica. The difference in dispersibility could be explained by the molecular structure of the surfactants. Negatively-charged surfactants with deprotonated COOH groups in the basic TMAS solution generate electrostatic repulsion among QDs. MUD, which does not have a COOH group, could not endow the QDs with sufficient dispersibility. Furthermore, the difference in the alkyl chain lengths of MPA and MUA also had an influence because alkyl chain length determines hydrophobicity. The excellent dispersibility of QDs modified with MPA, which has a short alkyl chain in its structure, therefore arose from the sufficient hydrophilicity of the MPA-adsorbing surface. Additionally, CIS/ZnS/ZnS QDs (relative QY = 57%) prepared using a double-step shell growth method was hydrophilized with MPA and embedded into TMAS-derived silica at concentrations of 1–15 wt%. The fabricated CIS/ZnS/ZnS@TMAS-derived silica composites showed absolute QYs of 43–47%. Their photostability was evaluated by comparing the change in their PL intensity under continuous excitation normalized by their initial PL intensity. A monolithic TMAS-derived silica embedded-QDs composite exhibited higher photostability than the QD powder sample. This improvement may have been caused by suppression of the photooxidation of the QDs; the TMAS-derived silica prevented O2 from reacting with the embedded QDs. Moreover, an increase in PL intensity possibly caused by the photoreduction of partially-oxidized QDs by thiol ligands or residual lactic acid was also observed for the composite. The photostability of the TMAS-derived silica composite was higher than that of composite containing PMMA resin as the matrix. This could be explained by the lower O2 permeability of silica compared with that of PMMA resin.Acknowledgements
The authors thank Otsuka Electronics Co. Ltd. for fluorescence QY evaluations.References
- E. F. Schubert and J. K. Kim, Science, 2005, 308, 1274–1278 CrossRef CAS PubMed
.
- M. S. Shur and A. Žukauskas, Proc. IEEE, 2005, 93, 1691–1703 CrossRef CAS
.
- T. Suehiro, N. Hirosaki and R.-J. Xie, ACS Appl. Mater. Interfaces, 2011, 3, 811–816 CAS
.
- C. Lorbeer and A.-V. Mudring, J. Phys. Chem. C, 2013, 117, 12229–12238 CAS
.
- A. D. P. Leach and J. E. Macdonald, J. Phys. Chem. Lett., 2016, 7, 572–583 CrossRef CAS PubMed
.
- S. L. Castro, S. G. Bailey, R. P. Raffaelle, K. K. Banger and A. F. Hepp, Chem. Mater., 2003, 15, 3142–3147 CrossRef CAS
.
- S. L. Castro, S. G. Bailey, R. P. Raffaelle, K. K. Banger and A. F. Hepp, J. Phys. Chem. B, 2004, 108, 12429–12435 CrossRef CAS
.
- J. S. Gardner, E. Shurdha, C. Wang, L. D. Lau, R. G. Rodriguez and J. J. Pak, J. Nanopart. Res., 2008, 10, 633–641 CrossRef CAS
.
- R. Xie, M. Rutherford and X. Peng, J. Am. Chem. Soc., 2009, 131, 5691–5697 CrossRef CAS PubMed
.
- T. Pons, E. Pic, N. Lequeux, E. Cassette, L. Bezdetnaya, F. Guillemin, F. Marchal and B. Dubertret, ACS Nano, 2010, 4, 2531–2538 CrossRef CAS PubMed
.
- R. Zhang, P. Yang and Y. Wang, J. Nanopart. Res., 2013, 15, 1910–1919 CrossRef
.
- W. Yue, S. Han, R. Peng, W. Shen, H. Geng, F. Wu, S. Tao and M. Wang, J. Mater. Chem., 2010, 20, 7570–7578 RSC
.
- T.-L. Li and H. Teng, J. Mater. Chem., 2010, 20, 3656–3664 RSC
.
- T. Kino, T. Kuzuya, K. Itoh, K. Sumiyama, T. Wakamatsu and M. Ichidate, Mater. Trans., 2008, 49, 435–438 CrossRef CAS
.
- H. Nakamura, W. Kato, M. Uehara, K. Nose, T. Omata, S. Otsuka-Yao-Matsuo, M. Miyazaki and H. Maeda, Chem. Mater., 2006, 18, 3330–3335 CrossRef CAS
.
- K. Nose, Y. Soma, T. Omata and S. Otsuka-Yao-Matsuo, Chem. Mater., 2009, 21, 2607–2613 CrossRef CAS
.
- M. Uehara, K. Watanabe, Y. Tajiri, H. Nakamura and H. Maeda, J. Chem. Phys., 2008, 129, 134709–134715 CrossRef PubMed
.
- H. Zhong, Y. Zhou, M. Ye, Y. He, J. Ye, C. He, C. Yang and Y. Li, Chem. Mater., 2008, 20, 6434–6443 CrossRef CAS
.
- L. Li, T. J. Daou, I. Texier, T. T. K. Chi, N. Q. Liem and P. Reiss, Chem. Mater., 2009, 21, 2422–2429 CrossRef CAS
.
- L. Li, A. Pandey, D. J. Werder, B. P. Khanal, J. M. Pietyga and V. I. Klimov, J. Am. Chem. Soc., 2011, 133, 1176–1179 CrossRef CAS PubMed
.
- W.-S. Song and H. Yang, Chem. Mater., 2012, 24, 1961–1967 CrossRef CAS
.
- E.-P. Jang, W.-S. Song, K.-H. Lee and H. Yang, Nanotechnology, 2013, 24, 045607–045615 CrossRef PubMed
.
- H. Zhong, S. S. Lo, T. Mirkovic, Y. Li, Y. Ding, Y. Li and G. D. Scholes, ACS Nano, 2010, 4, 5253–5262 CrossRef CAS PubMed
.
- H. Kim, B.-H. Kwon, M. Suh, D. S. Kang, Y. Kim and D.-Y. Jeon, Electrochem. Solid-State Lett., 2011, 14, K55–K57 CrossRef CAS
.
- K. Kim, J. Y. Woo, S. Jeong and C.-S. Han, Adv. Mater., 2011, 23, 911–914 CrossRef CAS PubMed
.
- J. Ziegler, S. Xu, E. Kucur, F. Meister, M. Batentschuk, F. Gindele and T. Nann, Adv. Mater., 2008, 20, 4068–4073 CrossRef CAS
.
- I. S. Sohn, S. Unitharattil and W. B. Im, ACS Appl. Mater. Interfaces, 2014, 6, 5744–5748 CAS
.
- S. Jun, J. Lee and E. Jang, ACS Nano, 2013, 7, 1472–1477 CrossRef CAS PubMed
.
- J. Aguilera-Sigalat, S. Rocton, J. F. Sánchez-Royo, R. E. Galian and J. Pérez-Prieto, RSC Adv., 2012, 2, 1632–1638 RSC
.
- A. M. Coto-García, M. T. Fernández-Argüelles, J. M. Costa-Fernández, A. Sanz-Medel, M. Valledor, J. C. Campo and F. J. Ferrero, J. Nanopart. Res., 2013, 15, 1330–1340 CrossRef
.
- C. Li, M. Ando, H. Enomoto and N. Murase, J. Phys. Chem. C, 2008, 112, 20190–20199 CAS
.
- B.-K. Pong, B. L. Trout and J.-Y. Lee, Langmuir, 2008, 24, 5270–5276 CrossRef CAS PubMed
.
- D. V. Talapin, A. L. Rogach, I. Mekis, S. Haubold, A. Kornowski, M. Haase and H. Weller, Colloids Surf., A, 2002, 202, 145–147 CrossRef CAS
.
- H. Kim, M. Suh, B.-H. Kwon, D. S. Jang, S. W. Kim and D. Y. Jeon, J. Colloid Interface Sci., 2011, 363, 703–706 CrossRef CAS PubMed
.
- H. Kim, H. S. Jang, B.-H. Kwon, M. Suh, Y. Kim, S. H. Cheong and D. Y. Jeon, Electrochem. Solid-State Lett., 2012, 15, K16–K18 CrossRef CAS
.
- D.-Y. Kim, H. Du, D. W. Johnson Jr and S. Bhandarkar, J. Am. Ceram. Soc., 2004, 87, 1789–1791 CrossRef CAS
.
- Y. Iso, S. Takeshita and T. Isobe, Opt. Mater., 2014, 36, 717–722 CrossRef CAS
.
- W. Zhang and X. Zhong, Inorg. Chem., 2011, 50, 4065–4072 CrossRef CAS PubMed
.
- D.-E. Nam, W.-S. Song and H. Yang, J. Mater. Chem., 2011, 21, 18220–18226 RSC
.
- N. Radychev, D. Scheunemann, M. Kruszynska, K. Frevert, R. Miranti, J. Kolny-Olesiak, H. Borchert and J. Parisi, Org. Electron., 2012, 13, 3154–3164 CrossRef CAS
.
- P. Jiang, Z.-F. Liu and S.-M. Cai, Langmuir, 2002, 18, 4495–4499 CrossRef CAS
.
- T. Burks, M. Avila, F. Akhtar, M. Göthelid, P. C. Lansåker, M. S. Toprak, M. Muhammed and A. Uheida, J. Colloid Interface Sci., 2014, 425, 36–43 CrossRef CAS PubMed
.
- C. F. Bohren and D. R. Huffman, Absorption and Scattering of Light by Small Particles, Wiley-Interscience, New York, 1983 Search PubMed
.
- S. Sarkar, B. K. Patra, A. K. Guria and N. Pradhan, J. Phys. Chem. Lett., 2013, 4, 2080–2090 Search PubMed
.
Footnote |
| † Electronic supplementary information (ESI) available: XRD profiles of the as-prepared CIS, CIS/ZnS, and CIS/ZnS/ZnS QD powder samples (Fig. S1); photographs of CIS, CIS/ZnS, and CIS/ZnS/ZnS QD dispersions under white light and 365 nm near-UV light (Fig. S2); TGA curves of as-prepared CIS/ZnS and CIS/ZnS-MPA QD powder samples under Ar gas flow (Fig. S3); XRD profiles of as-prepared and MPA-modified QDs (Fig. S4); molecular structures of MUD, MUA, and MPA (Fig. S5); absolute QYs of TMAS-derived silica composites containing different concentrations of CIS/ZnS/ZnS and CIS/ZnS QDs (Fig. S6). See DOI: 10.1039/c7ra00081b |
| This journal is © The Royal Society of Chemistry 2017 |

